Monday, September 20, 2010

Wrap up will be out around 10

What I see right now doesn't surprise me a bit taking a quick look.

Remember, there are 4 possible price volume relationships:

Price Up/ Volume Up-the most Bullish
Price Up/ volume Down-the most Bearish
Price Down/ Volume Up- at the start of a down trend this indicates panic selling and is bearish. After a prolonged downtrend it can indicate capitulation and that we are nearing a bottom
Price Down/ Volume Down- is the most commonly seen relationship in a bear market and doesn't tell us much.

Here are the dominant P/V relationships today:

Dow 30: 29 stocks -Price up/ Volume down
NASDAQ 100: 76 -Price up/ Volume down
S&P-500 397-Price up/ Volume down
Russell 2k -1500 -Price up/ Volume down
Russell 3k -2214 -Price up/ Volume down


As I expected by seeing the volume today, the P/V dominant relationship for all the majors was the most bearish possible on a breakout day. As I stated before, all price advances are not equal.

Update

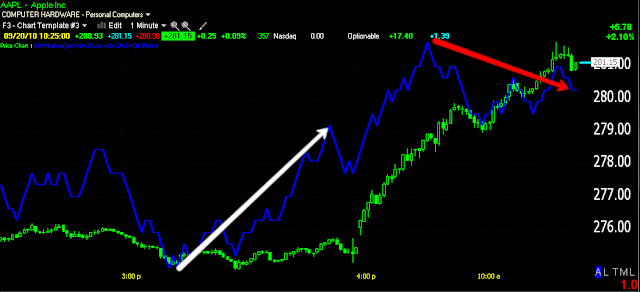
Now AAPL is breaking the channel on serious sell side volume. The Q's which I said were leading have the best negative divergence and are finally showing red volume.
My gut still tells me after all I've seen this is a false move, with maybe a gap up in the a.m and a close much lower, but it's Fed day too, which may have something to do with this. A breakout like this should be on double the volume we are seeing. As of now, it looks like the volume will be below Friday's-tha's not what you expect to see on a breakout like this. Until the market is closed I won't be able to see the true breadth, but the NAS a/d line is not getting stronger with price, it's falling lower-less stocks participating, buyers backing off and AAPL is definitely in the driver's seat.

Maybe an Early Warning...

The AAPL move seems to parabolic, it had a nice uptrend channel that it broke out of, this is usually a blow-off move. AAPL is still being used to bully the market around and perhaps XOM as well. There's a negative divergence finally on the 1 min in AAPL and it is back inside the channel.


The triangle that I showed you yesterday was very obvious and the break out, although large, is in context with the size of the triangle. The question now is, "is this a false move as we have seen 75% of the time?" and when do we get an answer to that question? The near parabolic spike in SPY/AAPL/DIA/QQQQ is usually not a good sign for the rally. Sometimes these turn into consolidation patterns, watching volume and price right now is key to look for signs of churning.

The SPY 1 min chart is in line with price, but the 5 min chart(more substantial) has failed to move above it's 2 pm position, meaning ti didn't confirm the rally since 2 pm and is in a negative divergence. 2/3's of the timeframes are now negative on the SPY, the more we see line up, the closer it is to a reversal.

The DIA is just starting a negative 1 min divergence.

The Q's are in a 1 min negative divergence-suggesting a reversal and about 3-4 other time frames are also negative.

AAPL is toying with the channel it broke out of, this is not really good news for bulls looking for continued gains as a break out of a solid trading channel often leads to a reversal. It's like the charts you see a straight runup and straight run back down forming what looks like a church steeple.

All 3 versions of 3C 1 min are suggesting a reversal here.

Volume at this point is crucial, we'd like to see high volume with no price advance, churning.

I can't say I'd like to see a close up here, although I can see it's benefits for a reversal especially with the Fed meeting tomorrow. In general, for the bulls H&S bottom theory, as it stands now, unless the volume picks up SUBSTANTIALLY, there's a high probability this is a false breakout.

It's hard to imagine a price move of this caliber with so little volume starting a new leg on top of the September rally.

It's taken me a long time to type this as I watch the market so somethings may have changed, I'll continue to update on anything I see, right now I'm trying to concentrate fully on the situation.

More on FAZ

1+1=2 Right? So we see negative divergences in the market and positive divergences in the inverse ETFs, if that's not confirming a bearish set-up, I don't know what else would. These are totally unrelated. I would still give the market's negative divergences credibility without the positive ones in FAZ, but to see an inverse ETF in a positive divergence (bad for the market) kind of seals the deal for me.

Some people are wondering, "Is it time to add to FAZ?" Lets take a quick look....

Here's the hourly chart... Note cause and effect of the positive divergences in 3C (white arrows) and the negative divergences (red arrow). The rally is in the white box, the decline in the red box. Note that right now we are seeing an hourly (very serious time frame) positive divergence at the last white arrow-look what the last positive divergence produced, a $4.50 move in a few weeks.

Here's the 30 minute chart. 3C doesn't just automatically confirm each time frame, each one is treated separately, so if I don't see multiple timeframes, I don't consider the equity a strong candidate. I've removed the boxes, but you can still see cause and effect of the divergences.

The 15 minute chart is easily capable of detecting month long swings and we have a positive divergence here too. What's interesting is the support that was broken today (see red trendline). Remember, anything obvious is usually taken out as most technicians believe that support will hold so they put their stops just below or at it. The market maker or in this case the specialist CAN SEE the orders, so triggering them is a FREE LUNCH, plus it allows them to stock up on the cheap and to remove any "weak hands" that may sell into the rally, thus diminishing it's momentum.

The 1 minute chart above shows that the specialist is not selling this break of resistance like most technical analysts would, instead, they appear to be buying it as it reaches the highest level of accumulation-a leading positive divergence.

Now, where to enter? As you can see from the long term charts at the top, a divergence can go on for days, weeks and in some cases months. Just because they are buying doesn't mean it's time for you to. You may want to scale into a position, a little at a time, but their goal is to buy as cheap as possible so price declines are welcome.... who wouldn't want to buy at a discount. However, if you buy now and it continues down you do not have the same nearly unlimited (relatively)funds available, draw down effects you a lot more then them. So, I would like to see part of the position put on above the green arrow at $13.20, perhaps you might consider adding a little down here, but not a lot. I'd fill out the position above the gap at the yellow arrow. Sure you lose a little profit, but you have a much higher probability trade at much lower risk.

KEEP FAZ ON YOUR RADAR!

AS FOR THE MARKET...

Right now there are some weak negative divergences, they don't look strong enough to turn the market yet. As we see with FAZ above, it is quite common to see a stock like that, especially on a double bottom, make a new shakeout low as the market may be trying to make a shake out high. We'll see, Fed day is tomorrow. I'll keep you posted on the divergences, but don't forget to watch FAZ for entries-this one can move-take a look at its history.

Looks Like A Downside Reversal is Coming

That quick little rally between 12:44 and 1:08 seems to have been news driven, but tonight I'll show you something interesting on the chart that foretold of it. In any case, negative divergences are setting in and it looks like it may have climaxed, at least as of now.

Watch for a bounce in this area.

NOW We're Seeing distribution


'nuff said?

FAZ being bought here?

Sure looks like it...

Divergences Piling Up

SPY 3C negative divergence-pretty much a leading negative divergence.

The DIA Negative Divergence

QQQQ Almost a leading negative divergence and what appears to be ANOTHER false breakout/ failed breakout from a bullish bull flag consolidation.

AAPL in a leading negative divergence and what also appears to be a false breakout from a bull flag. These guys are getting way too obvious.

Here's the indicator I told you about last week that works pretty well, just use the TICK (intraday) vs the SPY and look for divergences like this one to spot changes in trend-at least on a short term basis.

If I Were Day Trading...

I'd probably fade the gap in the market right about now with a stop above the recent highs.

Morning Update

So far we aren't seeing anything unexpected.

Above is the obvious triangle I mentioned last night.

Here's our breakout off the gap higher. Notice the first attempt and where it failed, confirming a resistance zone and confirming $113 - $113.05 is the level that is being fought over. The breakout was on moderate volume, if not a little on the low side.

Here we have a slight 3C negative divergence, although I wouldn't make any calls based on it.

And finally AAPL showing a 1 -minute positive divergence and more recently a negative divergence is unfolding on the 1-min chart.

Before I Leave

As mentioned last night I'll be out this a.m. until about 10 a.m. As of now it looks like we are set for nearly a half % gap up, also as mentioned last night this is not surprising given the triangle found at Friday's close. These obvious patterns, big and small have been hit with false moves in the last month about 80% of the time, the more obvious, the more likely.

While I won't be here on the open, unless the gap stays in the opening area, I won't be able to see if they fade the gap, but I'd think they would fade it to some extent. Day traders may want to use that opportunity of a gap up, watch for hints of a reversal-such as big volume with no price appreciation and then go short the gap for a quick buck as it pulls back. Wait for a reversal confirmation unless you here from me with a 3C confirmation.

The Fed will be meting later this week so there may be a range stocks stay in until that meeting unless insider information is acted upon early. Although policy is supposed to be decided at the meeting, it seems in the past that smart money has had forehand knowledge of the policy to come out of the FED, 3C has often shown this.

So this could be an exciting week. Always think defense first though. Try to imagine any situation that may arise and how you'll react now before it arises, then you have a clear , objective plan to follow should that situation arise.

See you soon.

AAPL Quietly Leading This Rally

Options expiration is a hurdle finally cleared, and interestingly right in time for Consumer Sentiment to hit 13 month lows, this should keep or move money out of risk assets and into safe haven assets like treasuries, so watch for an exodus from stocks this week. Like I've said so many times, we can see what they are doing, but it usually takes some time to find out why. For instance we just found out last week about the increase in the overall market short position by 4.5% in the last half of August, ironically or suspiciously about the same time we saw the bounce being set up. We are so far behind the information curve it's almost useless to guess “Why?” All will be revealed in good time.

As for our VIX positive divergence, it's still there and stronger then the last-that's got to be scary to bulls, or would be if they knew about it.


Compare the VIX positive divergences to the SP-500 during the same relative period.

Both times the VIX showed accumulation, both times the SP-500 showed distribution. Coincidence? I didn't make these up. These are two totally different assets, but linked with a high degree of correlation, still, 3C treats each one separately, what it finds in the VIX has nothing to do with what it finds in the S&P.

I wouldn't be long right now (generally speaking, there's always an exception) as this looks like a time bomb.

The NASDAQ 100 has been on a tear and why? I don't really care, the true reason is probably not something you're likely to find in any case. If one were trying to pull the other indices up through their August highs and pull the market into the status of a Dow Theory Intermediate Uptrend, why would you use the least important of the 4 majors to do it?

For me, this says, “If the market crashes, I want to be short the NASDAQ-100” as it has stepped a little further out on the limb then the others are willing to. Looking at the NASDAQ 100 breadth charts I always post, that limb seems to be getting thinner and thinner as it advances.  A few ETFs to consider on a market plunge would be: PSQ, QID, SQQQ and probably the semis using something like SSG .

Here's how we left the market Friday...

Everything is still bearishly intact, distribution and all.

The gap up on 9/13 was aggressively sold into by institutions. The bulls smelling profits were all too happy to provide the demand Wall Street needed to exit the trade and go short. The relative position of institutional support via 3C is now below that of when the rally began and price is significantly higher. It seems obvious that they have put on a large short position.

To me this looks like the bounce didn't proceed up to the Bull Zone of $113 fast enough and most likely the market was goosed a bit to get it up there, seemingly “in time for something” meaning they needed the bulls in position in time for "something" and it wasn't proceeding fast enough so a little help was thrown out there. Something coming down the news pipeline perhaps? Remember, these guys are way ahead of the information curve and if my last post didn't show you the government is every bit as corrupt as Wall Street, then..... We do have some excellent swamp land for sale down here in sunny South Florida.

Thinking out loud... “I wonder what AAPL looked like?”

Well look at that, 3C confirmation-maybe a they got a little help from their friends, This is a 15 minute chart, remember though, changes that occur will be seen first on the shorter charts.....

This version of 3C is very fast to pick up on changes.

Is that a change in character I detect in AAPL's 5 min chart?

This one is better for smoothing out the trend and the blue one below, I wouldn't expect to see a divergence there yet as it's very long term, but it's there and it's negative. Note how AAPL was showing confirmation into the uptrend, a healthy stock until Friday. Also note the triangle that formed in AAPL Friday.  Triangles are often signs of a top when accompanied by a 3C negative divergence. The reality that we see 3 or 4 times a day though is that even if this is as I suspect, a bearish top, the most likely outcome will be a false upside breakout-perhaps a gap up to clear the stops and orders above the very obvious triangle. Typically I'd say there's an 80% chance we will see this, but it should be short loved and once price falls below the apex (point) of the triangle, the longs will be at a loss and the supply/demand equation will rapidly shift as longs sell losing positions and flood the market with supply pressuring prices lower-this is the reason for a false breakout-that and the market makers pay day.

Why the fascination with AAPL? Because moving AAPL moves both the NASDAQ 100, the Composite as well and the S&P-500.

I've been told that AAPL

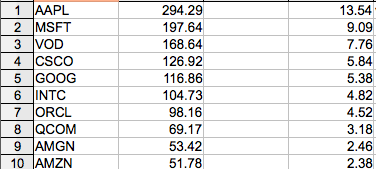
Here's the chart of the top 10 NASDAQ components using a calculation I put together based on what is known about how they weight their components....


That means if we had an index composed of AAPL, AMZN, AMGN, QCOM and ORCL-a 1% move in AAPL vs a 1% loss in the other 4 would still close our mini index higher-and those 4 companies are in the top 10 of the NASDAQ 100. Imagine if the real figure is 18 to 19%!

Imagine this, even using my number of 13.54%, which I'm sure is light, a 1% move in AAPL could still move the NASDAQ 100 higher if the bottom 53 companies all lost 1%! That's how powerful AAPL's weighting is and if it were 19% as the information I have received suggests, then you'd up that 53 stocks to 66 stocks. Imagine that-66 stocks of the NASDAQ 100 close down 1%, everything else is flat and AAPL closes up 1%, the NASDAQ 100 still posts a gain for the day!

This weekend I figured out the weighting of the S&P-500. I came up with XOM as the top dog, but still, AAPL had more weight then over 100 S&P stocks combined!

While the Dow is weighted differently, if I used the same weighting as the S&P-500, AAPL would have the weight of approximately the bottom 25% of the Dow-30.
As the Dow is actually weighted (to my knowledge), AAPL would, by my calculations, be the top dog on the Dow, by a margin of 2:1 over the current top dog, IBM. AAPL would have a heavier weighting then the bottom 1/3 of the DOW-30. Or in other words, AAPL by itself could take the place of slightly more then 10 Dow components.

The point is, if you want to move the market, AAPL is a stock that can move it. So by the looks of things, that's what has been happening and why we have followed AAPL so closely last week.

The change in character we are seeing in AAPL may be a leading indicator with regard to the course of the market.

So tomorrow a.m. I'll be online around 10:30. There's no telling what we will see as of this moment, but it seemed to me that smart money was in a rush (as if the market wasn't moving fast enough) to get the bulls locked into trades by throwing out a teaser, the break above $113 in the SPY which many bulls see as the neck line of an inverted H&S top. Their enthusiasm after seeing such a dynamic rally in September would have led many to jump the gun. Apparently we saw some heavy after hours action as well with bulls paying a real premium in a market that is nearly unregulated, save for the regulations your broker puts in place because no one else seems to want to. After Hours trading is the Wild West of the market for sure.

The advance we have seen on declining breadth (I've posted these breadth charts every day) shows that the market has been manipulated higher on a few heavy hitters like AAPL while a majority of stocks have posted net declines. That is a sure sign of manipulation and as pointed out, it looks like the manipulation in pushing the market higher via AAPL may have begun the process of being unwound. Keep an eye on AAPL it's in my mind, a leading indicator at this point.

If I didn't get to your emails, rest assured I will, don't be bashful about reminding me.

I'll see you in the a.m.