Friday, April 20, 2012

Gold Miners Setting Up a Volatility Bounce

This is one of those trades that I would use options with for a quick gain.

 A weekly chart shows the large top GDX recently broke below.

 However since breaking below, GDX has sat in a consolidation. The trend has been for a volatility shakeout of the shorts that entered on the break of a large top, this one appears to be no different.

 The 30 min 3C chart shows a clear positive leading divergence in the consolidation area.

 Since seeing strong distribution and breaking support, the 30 min chart's positive divergence has bled through to the 60 min chart, this implies a pretty strong bounce.

As the consolidation (confirmed by volume) is already a descending triangle (bearish bias), short traders will be looking for a break below support at $46, that is where we should see the short term 3C charts go very positive and see a reversal of the head fake break down and a likely move through $49.50-$50. Using calls, with a good timing signal such as the break of $46, this should produce a very nice gain using some calls.


OP Ex PIN-Moving Target

Looking at the SPY contracts from when we looked at them Wednesday to Thursday's closing contracts, there was a huge shift in the open interest in Puts and calls.


The SPY calls increased across the board from the $138-$140 level...

At 138 the open interest was 8824 that jumped to 156,261 about 147,437 SPY call contracts were added
At $139 the contracts went from 16,992 to 146,967 a difference of 129,972
At $140 the call contracts went from 22,309 to 298,863

Meanwhile the open interest at the same levels in the Puts declined

At $140 they went from 252,949 to 244,842
At $139 from 168,710 to 157,103
At $138 from 242,669 to 160,303

The drastic jump in Call Open Interest made the close of $137.93, a very deliberate move of a mere seven cents knocked out an additional 553,963 calls. The close seven cents below $138, knocked out 147,437 calls alone-SEVEN CENTS.

I'm not a big follower of the changes at the end of options expiration week, but the amount of Calls added in a day is staggering. Had the original $140+ close come, over a half million calls would have been in the money.

The $.07 cent close below $138 was clearly intentional as 156,261 call contracts would have potentially been in the money, that's over 15 and half million SPY shares that could have been callable and that's just at the $138 level so those $.07 really made a big difference in the close.

This is why I NEVER want to hold options through expiration, in fact, I want to hold them for the VERY least amount of time possible with time-decy working against you. I think options have their uses, we've had a number of trades over the last month which would not have been worthwhile if they were pure equity long/short positions. The increasing volatility and the very choppy nature of the market made using options for quick trades very worthwhile, however holding them through expiration puts you in a position where the market is clearly working against you. I'm still blown away by the thought that 156 thousand contracts were worthless over $.07.

And that's just the information as of yesterday's close, who knows how much they changed today?


BIDU, PCLN, AAPL

What do these 3 have in common?

 AAPL 1 min

 AAPL 60 min

 BIDU 1 min

 BIDU 60 min

 PCLN 1 min

PCLN 60 min.


If I have time, I'm going to try to get calls for a short term trade on all 3, there's little chance they will escape the gravitational pull of the 60 min negative leading divergences but they looks like they want to pop short term.

NYSE TICK Chart

The market is capable of putting in a volatile move higher in to the close, but it's getting to the now or never point. This however is one of the first clear trends in the NYSE TICK chart today, showing a trend of more stocks ticking up than down. It may be the precursor to the EOD move.

AAPL to the rescue?

Or just pre-earnings build up?

 1 min very strong leading positive divergence.

Now bleeding to the 2 min.

The question will be answered on the close. I still have my fat finger long in AAPL, I have been REALLY wanting to get short AAPL with the 60 min chart as horrible as it is, but have been hesitant, especially with earnings coming up Tuesday. The question will be answered by the close, it may be a bit of both.

On earnings, this is just a gut feeling, a knee jerk reaction up as AAPL rarely misses and an opportunity there to sell AAPL short.

Another View of intraday and possibly closing activity.

I know that last post may sound a bit confusing with my references to the SPY, here's a clearer picture of what I'm talking about.

The last 30 minutes of the day tend to be the most important and tend to be where smart money is most active.
 Here's where the 1st 1 min positive divergence was and then a break below that, take a look at 3C.

 The first positive divergence looked to break, but accumulation is in to lower prices. The second positive divergence is now stronger than the first, but taken together...

 They are bleeding through to the 2 min chart and giving a strong signal here, leading positive, although an intraday signal at this point, it is still strong.

 The SPY breaking below the first 1 min positive

 And the SPY has put in a second positive at the break below the level of the first.

Again, this is moving to the 2 min chart.

I would suspect if this is intraday only, then we should see a move higher in to the close, the more positive the divergence, the stronger the move.

3 Pillars

Here's a look at the increasingly chaotic Tech, Financial and Energy Sectors

 XLE-Energy a huge negative divergence on the open, glad I sold those USO calls early today. For the rest of the day there's price confirmation.

 2 min chart, again the strength in Energy's gap up was immediately sold in to, a bounce attempt around noon was also sold in to.

 The 5 min chart really shows the degree to which the gap up strength in Energy was sold, the rest of the day is in line.

 The 15 min, it is a bit subtle, but every move toward strength has been sold.

 XLF 1 min, is showing a decent positive divergence here, if the SPY is testing the previous bottom where the first positive divergence was, then I would expect perhaps Financials would lead for the rest of the day which the SPY has significant exposure to.

Taking a quick peak at the SPY, it does appear that is a very distinct possibility.

 Financials/XLF 2 min leading negative on the day, overall whatever strength could be gleaned from financials appears to have been sold.

 The 5 min chart is pretty close to in line. Should the 2 min worsen, then this 5 min should see the bleed through.

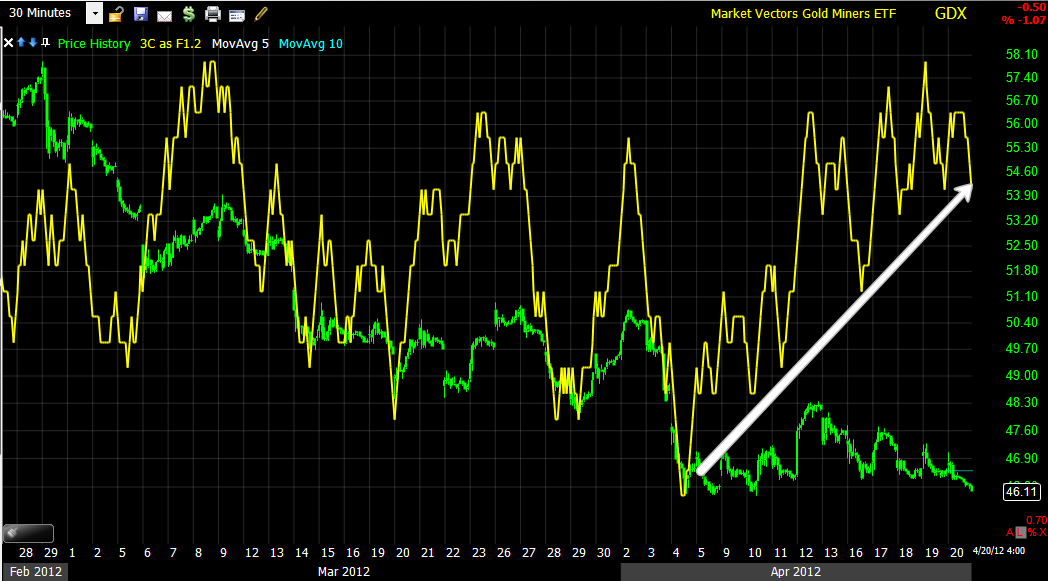
 15 min XLF, through March all strength was sold, it appears to be the same through April.


 The hourly chart shows all strength through the March highs being sold, the current chart is not much better than in line with prices.

 XLK also showing a 1 min positive here, from the first 1 min positive in the SPY and the other averages, we have seen a move below that level, but the short term positive divergences continue to build. This would suggest some support was put in and a head fake move below that support is taking place. I would still guess there will be an attempt to lift the market in to the close.

 XLK 2 min shows that building intraday support, even at a lower low than the first 1 min divergence of the last two posts.

Overall, the 60 min chart looks very bad, very similar to AAPL.

So far I'm chalking this up to op. ex. volatility, but I am very curious as to whether there is the start of an emerging trend. Hopefully the close will answer that question.

Additional Market Indications...

One word, "Chaos". I keep coming back to the longer term charts and view as this is where I'm building the model portfolio position.

 The DIA showing a nice negative 1 min divergence in to today's price strength

 Intraday the DIA has the same 1 min positive as the SPY I just showed you.

 The DIA unlike the SPY, although in a leading negative position, additionally has an intraday 2 min positive divergence at the same area I mentioned in the SPY.

 The 5 min chart is leading negative badly.

 IWM 1 min shows the same intraday 1 min positive divergence, it seems the market will try for higher prices in the last hour.

 Although the IWM 2 min is also leading negative, it also has the 2 min psoitive at the same place.

 The 5 min is leading negative, not horribly so, but it's there.

 Finally the IWM 15 min is negative here.

 QQQ 1 min positive divergence like all of the others, even though the underlying tone all day has been negative

 Curiously the 2 min QQQ is showing a much stronger 2 min positive divergence that is leading at the same place as the SPY divergence shown in the last post, sector rotation ?

 The 5 min is largely in line.
And the 15 min shows selling in to price strength in the Q's of which there has been little, but the 15 min chart here is looking more positive.

I'm going to look at the 3 pillars, Tech, Financials and Energy.

What has me a bit disturbed is the IBM positive divergence that appears stronger than an intraday move.

I'm wondering if the averages are going to come unglued with sector rotation also coming deeply unglued.

SPY Update

 Intraday, I have found a surge in volume with a bullish candlestick is like mini-capitulation and often the market reverses to the upside from here.

 The short term ascending wedge in the EUR/USD is not helpful in direction, this carries a bullish slant, but as we all know, these bullish patterns get manipulated all of the time, less so in currencies, but it happens.

 Interestingly the SPY 1 min 3C chart went positive right at the hammer/volume spike I showed you in the first chart so it appears it will try for more upside.

 The 2 min chart is not seeing that divergence as of yet and may not, the leading negative position shows exactly what we have expected all along, distribution in to any price strength.

The 5 min chart is basically in line and not helpful right now.

Next week we have AAPL earnings on Tuesday and the F_E_D/ F_O_M_C meeting Tuesday and concluding Wednesday. The bulls will be looking for hints of QE3, should there be none, the market will not be taking that well. This is always the wild card, but with gas prices and food inflation high, it doesn't seem the F_E_D would lean toward QE at this time, it would only make inflationary pressures worse.


I continue to add on strength for the model portfolio where appropriate, but my position sizes have been smaller than usual, allowing for volatility and perhaps being able to add. I'm leaning awat from leverage right now, it served us well the last month or so, but I would rather not have that increased stress on my decision making.