Friday, May 18, 2012

The Dichotomy

When I have more time I'll have to take a look at the options chains and see what the story was  regarding an op-ex pin, this is definitely one of the strangest Op-Ex Friday's we have seen in some time.

So I want to just recap what the signals are that suggest we are going to see a monster bounce, while not downplaying the extent of the trouble in the market. I didn't include the ER/USD charts which are a big part of the near term analysis, but they were in the last post.

My gut feeling has been AAPL/Tech would lead a final move. From the start I've felt this move would be the most volatile yet and with the market where it is, it is set up for a volatile move. Right now there are too many people who have it figured out and are short, NYSE short Interest shows it, the huge Put/call ratio shows it and the market action alone shows it. Wall Street doesn't make money by trading with the retail herd, they make money taking it away from the retail herd. I've always asked students/members the question, "What moves the market?" Supply and Demand? That's a mechanism, what moves the market is sentiment, emotion or more accurately Fear and Greed, I think the last several weeks have shown that to be true.

To be clear, any long positions, I have several, are all speculative longs, meaning they are small and don't represent much risk, the larger positions we have been building since the first decent bounce on 3/19, then 3/26, 4/2 and the last on 5/1 have all been short, there's only 2 longs I like for the long run, 1 is still in the oven (URRE) and the other many of us have been in since earlier this year as we saw the change of character and base developing (UNG) is now working and looks to be a secular bull move.

Whether we call a move up in the market, that I feel pretty certain about, a short squeeze, a bounce or a counter trend rally, it doesn't really matter. We know short squeezes produce powerful moves and if you look at counter trend rallies in a bear market, they are typically much stronger than a rally in a bull market, they have to be as their job is to shift sentiment, they aren't there just because, they have  purpose.

AAPL was the stock I thought would be the most likely leader of any bounce, that's where most of my speculative longs are, but also a much larger equity short. AAPL also is the 1 stock that can summarize the probability of a sharp bounce and still display the extent to which this market is in trouble and it doesn't take a bunch of chars, really only 1.

 The 15 min chart has stayed in a leading positive position, but I find it even more compelling to see a 30 min chart go positive in to a sharp decline.

 As for the 1 chart that shows both, the 60 min is leading deeply negative, below the October lows, yet it has a relative positive divergence as AAPL has declined. Putting in a positive divergence on a 60 min chart is no small matter and suggests something much stronger than just a "bounce". At the same time the position of 3C and how fast it fell apart and how sharply, shows the extent of the trouble in the market. Unless there's Central Bank intervention (and maybe despite it), this market should make short work of the October lows during the summer.

 Technology 15 min is still in leading positive position, if 3C confirmed the move down the indicator would be below the blue arrow I placed on the chart.

 The bigger picture (and this is why any longs are speculative) can be seen here.

 The Dow 30 min is in leading positive territory on the 30 min (the Dow is one of the only averages I can use 3C on intraday, the others I have to use the ETFs).

 QQQ 15 min is not looking as great as it was, but it's still holding in a leading positive position, confirmation of the move down would see 3C way below the 3C April lows.

 SPY 15 min is also in leading positive position-there's nothing about how 3C and the 3 different versions are constructed that would cause all of these averages to have the same signal.

 SPY 30 min is in a relative positive divergence. This would suggest a strong bounce, counter trend rally, etc.

 TLT as a flight to safety trade has been seeing negative divergences.

 5 min TLT-Treasuies.

 A long term view of commodities vs the SPX, something is going on here, this is the first time commods have led the SPX and rallied against the EUR/USD correlation, it looks small on this chart, but it is 5 days of breaking 2 strong correlations.

 High Yield Credit isn't overly optimistic, but it's usually lower than the market as Credit is ahead of equities, recently it's been lateral as the market has been down, it even put in a small rally the last hour.

 Long Term Yields which have been an excellent leading indicator, you can see where they diverge from the SPX and the SPX falls shortly after, now they are diverging positively, I don't remember ever seeing this big of a positive divergence in yields.

 The Euro vs the SPX recently, this correlation is typically very strong, however as we saw something not right early in the week with the currency, it has rallied, broke resistance and the correlation alone would suggest either the Euro needs to fall hard or the market needs to rally, if the Euro breaks $1.30, the short squeeze momentum will be even stronger. The market's break with the correlation today looks like a clear sign of an op-ex related move, there wasn't any news out of Europe worse than what we have seen on much mellower days and the 3C charts were predicting this move in the Euro.

The other side...

I don't want to give the impression at all that this market is bullish, so here are some charts showing how bad this market really is. The DIA 60 min is leading negative below the October lows, WAY below, you can see the distribution at each of the market bounces, as I said back then, "they are selling any strength" and that's why we were doing the same.Although this chart makes it appear the damage started  at the top, there were plenty of signs during the rally.


The SPY daily

QQQ daily


ES daily


I don't think any commentary is needed when viewing those charts.

Euro Stop Hunting- Fat Finger Trade?

I just can't resist, I don't normally slam other people's analysis, but this to me is just irresponsible.

From ZH...

EUR Soars On No News, As Santander UK Says 30% Of Visiting Customers Pulled Their Deposits Today


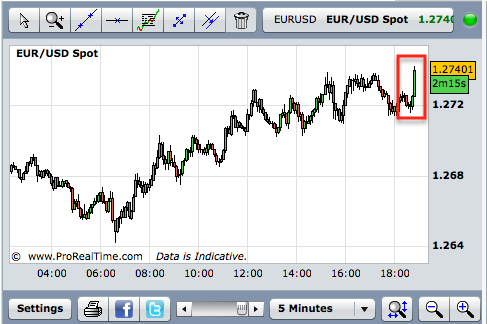
"Nothing could be more appropriate than topping a week of surreal newsflow than what just happened with the EURUSD, which soared by 80 pips on absolutely non news, "

 This is the chart they posted, what they didn't post was this...

So you know I'm not doing a "Jonny-come-lately", this is from one of the first posts at 9:46 a.m. today and also mentioned in several other posts yesterday. I posted this trendline, which they ignored and below the chart that looked exactly like this just without the breakout I said,

"Where the Euro need to break above to get upside momentum flowing..."


So is it surprising that momentum picked up as shorts covered as the trendline was broken?


Don't get me wrong, I'm bearish on the market, ZH are perma-bears and I agree with a lot of their longer term sentiment, but the market doesn't just go one way and we find some great opportunities in counter trend moves. The market should be represented as it is and as the proof of objective analysis suggests, even when it's hard to believe and even when it clashes (if only for a short time) with your perspective. 


As for other evidence, you know early in the week we saw something not looking right with the downtrend in the EUR and the uptrend in the $USD, it would be a lot more comfortable for me to find analysis that fits the direction of the trend, that's easier for people to accept, but that's not what I found. It's never easy to make calls that run counter to the price action, but there is a lot of opportunity in having a good idea of what the highest probabilities are and just look at what the Euro has done since we first noticed it!
Euro 5 min positive divergence/accumulation in a strong leading positive divergence-even at the breakout.

The 30 min chart... You can clearlt see the last distribution cycle, look at the strength of that leading positive!

It isn't just the Euro, we'd expect to see distribution in the dollar, here's the 5 min chart leading to a near 14 day low!

The 30 min chart leading negative this badly? Like I said earlier, the signs, signals, multiple indicators all suggest something a lot bigger than just a corrective move.

GOOG Short

This head fake move above resistance is the reason I shorted GOOG, it can still be shorted here with a stop at the red trendline if it pops above that, you can put on a decent size position still with less than 2% portfolio risk on the trade.

Euro Move

The financial media are picking up on that Euro spike I mentioned as it wa just breaking out. 


The ONLY news to come out of Europe is from the WSJ with an article about the inevitable bank runs in Sapin, this time on  Banco Santander, this is NOT a Euro positive event, yet the Euro runs higher. The assumption is that there's stop hunting going on, however as you know, we've found the action in the Euro to be of interest, the first post when I noticed the 3C underlying action (bullish action even as the Euro was still falling) was to ask the question, "Does someone know something we don't yet?" , ever since then the Euro has improved until it looks like this...


The breakout move I mentioned this morning that I didn't even think would come today.


Now for some assumptions, if the Euro stays around this level over the weekend or is higher, the market correlation which is very low right now, would almost certainly pop up to revert to the mean.


Stop hunting? Or has this strange set of events lasting this entire week been about something bigger?

ES Update

No doubt because of that Euro move, ES is putting in an intraday positive divergence, it won't matter if the op-ex pin is set, but here's the start of the signal. I'll add when looking at CONTEXT, our risk asset layout and how the Euro has been behaving as well as the trends in 3C, the market looks like it will put in a big move, apparently op ex is not going to help facilitate that move, but there's more confirmation on more indicators and bigger signals than we have seen throughout this entire top.


Euro just made a strong move...

This question about the Euro/USD has been nagging all week since we first saw negative divergences in the dollar and positive in the Euro, that was WHILE the Euro was still dropping. This is part of the reason I continue to hold short term long specs, although I'm happy with my GOOG short as well.

What will the market do with this?

 A nice breakout move in the Euro...

The Euro(red) vs the SPY- what will the SPX do with this market positive move in the Euro? I suppose that depends on who is the largest holder of Puts today.


OP EX

With FB stabilized at the $40 level, we can't blame the market on FB..


 SPY vs FB, FB didn't make a lower low and is holding right at $40 where it looks like it' been defended by algos.

You can't blame the Euro either...

So on an Op-Ex Friday, the most likely cause is op-ex itself, but with the huge disparity between Pus and Calls, I suppose the question is starting to be answered as to who wrote and who bought.


Why things snowball out of control

Has anyone seen the docu-drama covering the Lehman period? Hank Paulson, Tiny Tim (POMO) Geithner, the whole cast from the major Wall Street banks, Jamie, Lloyd, etc?


If you saw it Lehman went from a bad situation to an impossible situation in days. In their 10Q filings you can even see (for those that are really sharp) in the footnotes (out of the view of where most people look), their Pledgeable assets dropped by 50%, Wall Street knew there was blood in the water. I'd like to take the time and look at JPM's pledablle assets to se if there's a similar reaction. What this means is the lack of Pledgeable assets or you may have heard the term "Re-hypothecated" assets, means that hedge funds weren't doing business with Lehman, to the tune of a 50% drop off in business, this is how things spiral out of control very quickly.


We had a quiet period in Europe after the Greek bailout was "finalized" (plenty of sarcasm there), you may recall me saying, "The EU is about to come roaring back in to the spotlight" over 2 months ago, two weeks later it did. 


Spain is the domino that can take down all of Europe, Greece is another, but for now lets consider Spain. The benchmark 10 year yield on their sovereign debt has climbed above 6%, countries (especially those who can't unilaterally deflate their currency-like everyone using the Euro) simply cannot sustain those yields and make the debt payments, it becomes nearly impossible for them to go to market for funds so they turn to the EU/ECB for a bailout like Greece did at 6%, Ireland at 6% and Portugal at 6%.


However we now have a banking crisis which has actually been in place since last year, it has just gotten worse, especially since the bank runs and the downgrades. Certain investment funds cannot hold assets that are rated below a certain level, so when these sovereign or banking downgrades come, that means legally some funds HAVE to sell their holdings. That's one aspect-the other is no one wants to hold garbage.


The Spanish Banking sector was just downgraded and who holds the majority of Spanish sovereign debt? The Spanish banking sector. Today LCH Clearnet (just recently in fact), upped the margin maintenance on ALL Spanish Bonds with a duration of more than 1.25 years. This means that the severely undercapitalized Spanish banking sector has to post additional margin on their holdings, the problem? They don't have the money.


And this is exactly why tops are very unpredictable and why when things start to go south, they snowball out of control very quickly. An impossible situation was just made a LOT worse.


Risk Asset Layout Update

The ES CONTEXT model has continued to improve, looking at our own set of indicators, I can see why, it not only feels but looks like something is up.

 CONTEXT ES still very strong...

 Commodities again today are showing better relative performance vs the SPX

 The trend in commodities vs the SPX, note the  divergence in red and how much gibber this positive divergence is in white

 Commodities vs. the Euro-I have been asking just about all week, "Is there something going on in the currency pair ER/USD that we don't know about yet?", it appears there is.

 Interestingly yields gave out intraday as the SPX was making intraday highs, this is before FB started trading.

 The longer term trend in Yields since they went negative at the 10th has been positive, yields have been an excellent leading indicator and this is one of the largest positive or negative divergences I have seen (except when looking at longer timeframes).

 Here's the 3 day trend in Energy vs the SPX's relative momentum...

 Intraday financials gave out near the SPX's morning highs, since they have jumped back in line.

 XLF's trend over the last 2 days, very weak yesterday but coming in line today, even slightly leading the SPX

 Tech intraday gave out also just before the SPX morning highs, they've jumped back in line.

 The longer term Tech vs SPX since the May 1 top when they clearly went out of rotation, we saw that top developing fast on May 1, recently though this is one of the bigger positive divergences in Tech. As you know, I consider Tech, Energy and Financials to be crucial to any market bounce attempt and again it appears something is up, these indicators have served us well since we started using them as leading indicators.


 High Yield Credit dropped a bit in to this morning's SPX highs, I'm not sure if this was a reaction in the SPX to European trade in FB before it opened in the US, I can't compare.

 High Yield Corp. Credit looks to be shaping up a bit, it held up better than the SPX today as it didn't make a lower low.

 EUR/USD

 Looking at the trend in the EUR/USD you' think the market would look a lot better, I assume it' either FaceBook or op-ex, but the movement in the pair is looking better and more supportive of a market move higher before we make a significant leg lower.

 This is the rough area where the Euro will need to break through to start creating ome short covering activity and get momentum moving.

 The longer term view, there's a definitive change in character in the Euro, we saw this in 3C early in the week before the changes in price occurred.

 Intraday the Euro has held up better than the SPX, compare relative price levels

 And the trend in momentum vs the SPX is accelerating.

 As far as sector rotation today, the defensive sectors bumped up when you'd expect, as the SPX dropped in to the red, however financials are starting to rotate in, Industrials, Discretionary and Tech, Basic Materials and Energy are holding their own.

Looking since about this time yesterday, Financials fell off early today as seen above, but are starting to come back, the Defensive trades are holding their own, Utilities looks as it should, Healthcare is a bit more shaky. Energy looks impressive as do Basic Material, Industrials, Tech is clawing its way up and Discretionary is holding its own.

There are some strong signals here, stronger than we usually see. I still believe something is brewing and not just a corrective move.