Wednesday, February 8, 2012

C&D Trades (Long)

Well I've run about 6 different scans, went through 300 charts, came up with a 1st round of 64 candidates, narrowed that down to 32 and that down to 14, out of those 14, I found a mere 5 trades that look good, I will say that I'm pretty shocked, I expected to have more like 30 or so, but going through the 32 stocks in a narrowed down watchlist, I found a lot of these Cats and Dogs trades are already burned out, meaning they drove them up and got the heck out of Dodge taking their profits with them, not at all what I suspected I would find.

In any case, here are the 5 C&D trades I think have a good chance. Remember, these are trades that can move very fast and put in some spectacular gains, very few are lasting trades so I generally take at least partial profits on any double digit move, especially if it comes in a single day. The rest of the trade (if it still looks good-decent volume, closes near the top of the range, etc) should be put on a tight intraday trailing stop. The ideal situation is to get enough profit to take your original investment off the table and let   the profits run. Don't underestimate their ability to move, they can easily make 30-50% 1 day moves and several hundred percent in a run, but don't fall in love, know when to take your winnings.

DRRX
 This one saw a capitulation event, it doesn't mean this is the bottom, but it can run a bit from here. There's a nice RSI divergence and some recent activity flirting with a breakout from the range on slightly larger volume, they usually start with slight changes in volume before the huge volume days present themselves.

 The volatility stop here is $.74, although you may want to wait for a breakout and place a stop near your entry, you need to definitely set alerts for price starting to move and move quickly.

I looked at all of these with 3C and they all show some positive signs, anything that didn't, didn't make the list.

DHT
 We already had 1 trade in this shipper, they went nuts a couple of days ago and pulled back, I think they'll see another run . There's an RSI positive divergence in the base area and volume has been courting longs lately.

 This one also has a very clean X-over unlike many others, this is one of my favorites, it may still see a pullback to the 10-day m.a., I would seriously consider buying on a pullback to that area, even on an intraday basis, otherwise a move above the high of 2 days ago would make for a good entry, again, I would consider my entry level or just below as a stop.

 Here's DHT on the Swing layout, the stop here is at today's low, which also works.

GERN
 Another capitulation event and positive RSI in the base area, it has seen some initial movement on some volume and pulled back on lighter volume, I like this one in this area, of course the first hint of a move through the trend line and I'd be a buyer with a stop just below the trendline by several cents.

 Here's the Trend Chanel stop, depending on your position sizing, this wider stop could also be used if you were to buy in the area rather then wait on a breakout move to start, in which case you NEED real time price alerts.

GSIT
 This one has been flat for a long time and is just showing movement, it pulled back a little and is starting to move again. I would consider a stop just below Tuesday's low.

 The Swing Layout has the stop in the same area I mentioned above, so that confirms what my thoughts were for a stop, a slight pullback intraday would be helpful in buying this one or phasing in with an initial entry here with a little room in case of a pullback or on a breakout move.

SCHS
 This has a nice little base look to it and volume is certainly courting traders running volume surge scans. I like this one in the area as well.

For me the Swing layout stop is a little deep unless you sacrifice some shares for the wider stop. I want to see this move, so I would consider an end of day stop just below today's lows, not at them as you never want your stop in obvious places like that or at whole numbers.

If you have questions on any of these, shoot me an email.

Greece is knocking the Euro and ES down, next the EU-C&D trades coming...

The latest and what I find to be the most interesting is not the headline news that  the political party LAOS, part of the Greek ruling coalition failed to agree to the Troika terms at a meeting that ended at 1 a.m. in Greece, this part was kind of expected. As mentioned, the market moving on a Troika draft document is meaningless unless the Greek coalition agrees to it, which thus far they have not. What I found interesting was talk from  the Dutch Prime Minister that it is easier and cheaper to let Greece leave the union then it was in 2010, adding that a Greek departure (code for default) would not be a disaster.

Between that being they are still AAa rated and Germany going back to vote on measures that seemed to already be approved, it is looking more likely that Greece will default.

Lets face facts, even with time and planning, the EU hasn't been able to put together any credible programs and when under a deadline such as the G20 summit deadline to "fix the mess", their plans are even worse.

So in probably less then a week, negotiations that have gone nowhere over a period of months, need to be concluded favorably including the Greek debt restructuring, figuring out how or if the ECB will take part in said restructuring, finding the extra $15 billion dollars Greece needs that is not part of the $130 bn tranche, getting Germany, the Netherlands, Luxembourg and Finland all on the same page, establishing some kind of Greek bailout oversight that the Greeks will accept, possibly having to insert retroactive collective action clauses to force bond holders to take a 50-70% write down, and on and on and all of this needs to be wrapped up last week.

I have illustrated over and over again how in the EU, one hand never knows what the other is doing, with Greece you can magnify that by 1000%.

The chances of this all coming together would be the greatest achievement the EU has ever made and it is one of the most complicated , lets face it, their track record isn't very good.

With conditions as they are and seeing another day of the Cats and Dogs rallying (there's a little rotation noticeable), I'll be giving you several candidates as it seems to be the season of the C&D trades, the implications of these C&D trades popping right now are something else altogether.

Average True Range and the Market

As a side note, ES is moving down now close to unchanged from yesterday's close...

So in doing my research on bear market rallies, as I posted Sunday, I stumbled on this...
 Here's the Dow-30 with a 14 day Average True Range in the middle window and the Close Within Range Indicator. The Dow is unique among the averages when looking at the rally from December 20th through present in that it is wedging (bearish ascending wedge). The red arrow marks the 20th of December. Note the recent breakout above the ascending wedge, although in nearly 3 weeks (14 days) of trade, the Dow has gained +1.29%, that use to be an average day for the market not to long ago, not over a 3 week period. What is very curious though is the ATR, which is the range from high to low that the market (in this case the Dow) moves in. ATR is averaged, although you can see the 1 day ATR, but the trend is what tells you something. In this case we see the ATR (daily range) plummet as the rally develops, from about a 216 point daily range to a 123 point range. If this were a strong healthy rally, we'd expect that ATR to at least hold up if not increase, yet it is down by nearly 45%.

 In the same period, the NASDAQ 100 is more typical of the market, what is immediately striking on this chart is the fact that there are virtually no pullbacks, any healthy rally sees pullbacks. This instead looks more like a short squeeze, the only problem is that NASDAQ short interest at last check was at 10 year lows. The indicator that shows the close within range seems to indicate that getting the market to close green is what is important here, not so much digesting gains and consolidating to build a strong trend that shakes out weak hands, which is the purpose of pullbacks and why they are healthy for an uptrend. Looking at the ATR we see an average 47 point daily range slide all the way down to a 27 point range, this is less then the 40 point range seen in April of 2009 when prices were 58% lower!

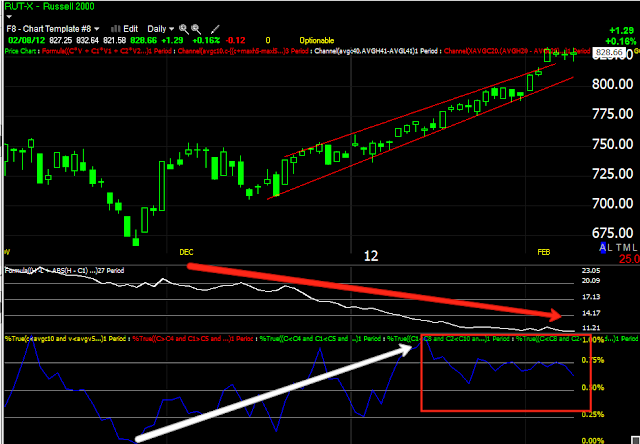
 The Russell is one of the few that is seeing the Close Within the Range drop off to about 50%, , which could look like today's doji, that is a close at about 50% of the range, also a signal of a loss of momentum. Note though how earlier in the trend, the close within the range was advancing. Again, no pullbacks in price of any significance at all. It's one of the strangest price trends I've seen. As for the ATR, it has been cut in half as the rally has developed.

 The S&P maintains the image of strong daily closes, but very small moves. Here the range drops from 28 points to 13.75 points.

I changed the ATR to a 5 day ATR just to see if it would change, it didn't. The range dropped 25 to 11 points since late December.

 I looked at the bear market rally in the SPX in 2008 and saw very much the same thing, ATR dropped off from 32 points to 18 points, also in a similar wedge like the Dow right now.

This is the period represented above...


 Although this rally hasn't seen any substantial pullbacks, you can see as it advances the ATR also advances, granted this is a more powerful rally.

DST in terms of percentage gain over the same period is on par with the market, it saw several healthy pullbacks and while the range didn't move higher until recently by about 30%, during the rally, the ATR managed to stay within a normal range of $.95 to $1.03, it didn't drop off by 50%.

So the question with bear market rallies, is whether it is a real rally that wants to carry the market higher on true risk appetite and underlying fundamentals that create that risk appetite, or whether it is a facade meant to look like something very impressive to drag investors back in to the market before leaving them holding the bag. Considering the ATR, the small price advances, the lack of pullbacks and recently in the DOW not only a bearish price pattern with what may in fact be the tell tale head fake, but a move of 1.29% in 14 trading days, I'd call this a very suspicious rally.

The danger in bear market rallies is that they slam the door fast and hard, the entire rally can be wiped out in 1/5th the time it took to build it. Even worse, bulls who recently entered the market because of the rally, have been well conditioned to "buy the dip" and the first correction in a bear market rally is just as dangerous as the initial break as longs double down.

Be careful, be thoughtful and aware of your emotions. More then anything, look at the charts, sometimes the piece of information that is most valuable is very subtle and often fleeting.

Moral Hazard

While some scans are running (by the way, I have some very interesting charts you'll be interested in), I just was browsing for the latest news and came upon what I suspected we'd eventually see.

The ink isn't even wet yet, much less dry in Athens, but anyone with the slightest understanding of envy could see this coming a mile away, as a matter of fact, just yesterday I used the very words, Moral Hazard in describing the Troika/Greek negations. Maybe "dangerous precedent" would have been more appropriate.

As we know, there's no deal even done yet and already Irish Eyes are eying what they may be able to get, if  Greece were to get anything.


Closing Sector movement

 The closing sector rotation has been pretty much across the board declining in just about every sector, defensive or not.

 XLE-Energy has been in line most of the day, with the exception of a sharp leading negative drop at 2 p.m., closing down -.36%.

 Somewhat related, the Dow/DIA shows a negative divergence in the late afternoon with the Dow rangebound at nearly unchanged with a .05% gain, unchanged for all intent and purposes, especially in context of the sub-intermediate trend.

 Financials show an early a.m. opening negative divergence sending them in to the red in the late morning session, price moved up, 3C didn't confirm and in fact was leading negative.

 Being the financials have a fairly substantial presence in the SPX, we see similar behavior in the sPY, it looks a lot like the Dow as well, with a gain of .22% in the SPX, again essentially unchanged in context of the sub-intermediate trend. Note there was no accumulation at the 11:30 lows; closing trade also range bound.

 XLK, one of the better relative performer today, although not at an impressive gain (remember the days when a 1% move was average?), shows the same negative divergence in to afternoon trade.

 The tech heavy NASDAQ 100/QQQ did show a positive divergence at the intraday lows, but quickly moved to a deeper leading negative divergence in the afternoon, with the NDX closing up .54%

 The IWM was the black sheep today, it was negative off the open, at the 1 p.m. recovery highs and at the 2:45 recovery highs, giving up the gain in to the close, the R2k just barely managed a green close in the last 5 minutes at + .16%, but as the leader of a risk on move, the IWM's performance today contrasted, even if slightly, with that of the other average, looking weaker throughout the day.
 
The NYSE TICK chart looks about right for the day's action, late morning trade saw readings of -1350, which we haven't seen too often, the 2:30-ish move in to the green saw readings reaching +1675 and the close as it was range bound in 3/4 of the averages reflected that.

Now to update the daily data and check out the internals.


USO Update

If you want to find something useful in the market, look for slight changes in character, they usually lead to more pronounced changes and even trends. This has been an interesting trend in USO and I can't see how it can be called bullish.

 Today's intraday trade is a perfect example of a small change in character that became a trend and is defining a trend in USO. These early pops that sell-off...

 On a 15 minute chart we see a number of them, note the general trend of price...

 Here's the trend in price, this trend also started around the same time we started seeing the strong opening faded in to the close, the candlesticks tell the story, look how many opened at the top of the day's range and closed near the bottom.

So far, even with all the volatility, the 1 day trend channel has held the trend, it hasn't been violated once on a close.


Meanwhile, the SPX's .16% Gain is stalling

SPY intraday

More Sewing Circle News

On a day and a week that is pretty light on macro economic data, as I warned Monday, Greece would dominate the market. Around 2:15 some volatility jumped in the market, at first I thought it may be the SPX crossing to unchanged, but I suspect it has more to do with a leaked Trokia/Greek pledge draft document. Th market's reaction is ridiculous as usual as it is moving on mere news and no event as Germany still has to vote on all of this, the Private creditor issue hasn't been resolved and the reforms the Troika wants will face stiff resistance in the Greek ruling coalition. In any case, Wall Street needs the market to move, which way doesn't matter, but to make any money, they need movement.

In any case, here's what was leaked via Bloomberg...


Greece Draft Cuts Minimum Wage 20%

Greece will pledge permanent spending cuts, including lower pension payments and a 20 percent reduction in the minimum wage, as the economy contracts this year at a faster pace than originally estimated, according to the draft of a new financing deal with the European Union and International Monetary Fund.

Additionally:


  • TROIKA DRAFT GREEK ACCORD SAYS 2012 GDP TO SHRINK AS MUCH AS 5% - 
  • GREECE TO CUT MEDICINE SPENDING TO 1.5% OF GDP FROM 1.9% OF GDP 
  • GREECE PLEDGES TO MERGE ALL AUXILIARY PENSION FUNDS 
  • GREECE TO PLEDGE 20% CUT IN MINIMUM WAGE IN TROIKA DRAFT 
  • TROIKA DRAFT GREEK ACCORD RENEWS PLEDGE TO CUT 150,000 EMPLOYEE 
  • TROIKA DRAFT GREEK ACCORD SEES RETURN TO GROWTH IN 2013 
So we probably have about 24 hours max before a denial of everything mentioned above.

CRR a more volatile RES

CRR and RES are both in the same sub-industry group, Oil and Gas Equipment Services. CRR had pretty good correlation with the sub industry group, but something went wrong recently.

CRR in green vs the Sub-Industry group (red), something went pretty wrong in 2012. Even the Industry (Energy) comparison looks similar.

 The daily MoneyStream is at a deep leading negative divergence, these signals are rare on Money Stream, yet this still looks like a tough trade with the volatility, but if you can keep your risk low either through a tight stop or a wider stop and fewer shares, the volatility may pay off as CRR is very close to a major support area.

On a 5 day chart, you can see there is a primary downtrend in place, it's not a textbook example, but it is a primary downtrend. RSI was negatively divergent at the top. What is interesting is how much volatility has picked up since the stage 2 mark up (up trend) and since the top formed.

 I created this custom indicator to show you the changes in volatility on a weekly basis, it started out with about a $3 low to high swing per week, then in the trend around $6.00 pretty consistently, then jumped to $20.00, normally we see this as a stock's price rises, but this is in a primary downtrend with falling prices.

 This correction could be described as an island top and the fact that the breakaway gap hasn't been filled is VERY bearish, we almost never see that anymore. As you can see, CRR is very close to making a new low, that's important within the context of the primary downtrend, suggesting the next leg down will head for the bottom of the channel.

 Using the X-over screen on a multi day chart, we can see the confirmed sell/short signal and a recent pullback to the 10/22 bar averages.

 3C weekly showing the accumulation stage, mark up and then distribution. It is now leading negative just like Money Stream above. This isn't a stock that is being bought, but sold/short aggressively. We need to keep an eye on Energy services as well as these two stocks could be a leading sign of what's to come in the sub group and probably the main industry group of Energy as well. If services falter, that tells us the larger Energy complex is in trouble.


 As we almost always see, this 15 min chart of the correction shows a head fake move, we almost always see a head fake move to trap longs/short -in this case longs, right before a reversal in trend. The red trendline is the area where it makes new lows.

 On a daily swing basis, it's a short and has been so since the first red candle in the series, as for a tight stop, the volatility stop at 103.31 is about as tight as you can get with this volatility.

Longer term if we apply the same layout to a 5 day chart, the stop is at $115.59. It's hard to say how to play this one, except to say that a break below $90.41 is probably worth investigating.

The Primary Channel would suggest a next leg down move to the $50-$60 area.


AEO Follow Up

The AEO trade idea (short) is from Feb. 2 

It actually looks pretty good from a risk:reward perspective right in this area.

Originally we looked at a 2-day chart to find the pivot, but the trend cleaned up a bit and it's visible on a 1-day chart.

I would initially treat this as a swing trade and see how it reacts, it would be nice to catch another major 1 day move down.

 This is a weekly chart, RSI was warning right before AEO broke as it was negative on the top of the rally. Make sure you look at charts/indicators in multiple timeframes, what everyone else sees isn't worth knowing.

 With the Swing trade layout, this already triggered a swing short on Monday, if you use the volatility stop, then $14.27 is the stop area (I'd prefer to use intraday moves for entries in swing trades and for the most part, end of day prices for the stops.) You could also use a stop above the pivot candle's high around $14.65, it depends on your risk tolerance, but I think the tighter stop is what makes this trade interesting here, the risk is fairly low compared to the entry.

Interestingly, the Trend Channel has a stop at the same place as the volatility stop, around $14.27 and the break of this correction is just above $13.50.


RES Update

RES was a trade idea (short) from January 30th, it was/is a trade that we want to come to us so they can be easy to forget about unless you set price reminders which I think is absolutely essential to getting the best set ups in real time.

 RES is much easier to see and understand on a 5-day chart, if you are new to the trade, make sure you see the link above to the original idea.  Here it is pretty clear RES is topping, the original post shows many more reasons why this is almost certainly a top.

 We were hoping to catch a bounce, but RES just hasn't been able to muster much, however from where we are now, the trade could be entered here or phased in to with a partial entry here and the rest under $16.25 with a stop just above $15.75 (don't use $15.75 as it's too obvious, $15.84 or something like that would be better).

What we are looking for in this trade is the stage 4 decline which in short terms is the equivalent of stage 2 mark up for a long, it's the area in which the stock tends to trend better and in a short, they fall a lot faster and deeper then they rise in a bull market.

 The 30 min chart has remained intact and bearish, it is now making new leading negative lows. In red there's a little head fake move that was under distribution.

 Here's the recent consolidation, I was hoping we'd see some more strength to short in to, but as you can see, the consolidation is starting to fall apart as 3C drops to new lows while price is still relatively flat.

 This is the same area on a 1 day chart. Note RES is very close to breaking down below the consolidation.

For initial purposes, here's where the 1 day stop Channel is at, so the stop I mentioned is about right, however for a longer trending position, that will likely need to be widened if you plan on trying to catch the trend. We'll have to see what volatility looks like below $16.25, but I wanted to make sure to bring this to your attention.