Thursday, November 14, 2013

Daily Wrap

I still think there's more to be learned in overnight activity than usual. A lot of old tricks aren't playing out so well and a lot of old tricks are playing out exactly as they always have, what do I mean?

If you've been with us for more than 4 months then you know I ALWAYS warn to "BEWARE THE KNEE-JERK REACTION" whenever it comes to F_E_D, F_O_M_C or really any Central Bank news or policy.

QE3 released on Sept. 19 2012 rallied for 2 hours about and that was the high not to be surpassed until mid-January of 2013, the initial strong knee-jerk rally was just that, a knee jerk. Just as the ECB's Euro drop on their surprise rate cut which lasted less than a week was a knee-jerk and the WSJ article that sent the Euro lower lasted even less, maybe an hour or so, but the initial move (like the nearly 200 pips on the rate cut) look very strong, they are usually just wrong.

Don't forget what happened just previous to yesterday's Central Bank ramp, the ES futures fell 10 points overnight, it was not set to be a pretty day and it wasn't strong demand, it was instant discounting of unheard of news, "The ECB in QE".

The ECB ramp worked better for the market than it did for the Euro.
When the surprise ECB rate cut didn't hold the Euro down they tried some intense jawboning, the Euro is now at the exact level it was at just before the ECB/WSJ article came out, but note the negative divegrence in the Euro and keep the EUR/JPY's lifting capacity for the market in mind because, something happened with the Yen today as well.

This is around 2-2:30 today when several markets did some strange things like the VIX futures.

If these divergences play out as they look prepared to do, then Euro lower and Yen higher means

This general trend in EUR/JPY (candlesticks) vs ES (purple) changes, more than that, unless the $AUD and/or $USD are extremely strong, it knocks out those two carries as well, but they have been showing less and less correlation over the past week.

Other oddities around the same time...
 First the 1 min chart, then 2, and 3 min ...this is the 5 min VIX/VXX intraday chart. This is a 3C edge, you don't have to look for it, it jumps off the chart.

This is the 2x leveraged version of the above, it looks like it started earlier, but perhaps as Yellen finished and didn't surprise? A Leading positive divegrence took off from an "In line" status.

Check out Spot VIX...
My Custom DeMark inspired buy/sell indicator works great with the VIX, note the buy and sell signals. they aren't often, but they are impressive.

However what's impressive now is the directional move building in the VIX, look at the Bollinger Bands pinch. If that VXX / VIX futures divegrence keeps up, I think we know which way this breaks.

However many times in the past I've seen Crazy Ivans here, that's our term for a shakeout of both the up and downside, both get shaken before the trend emerges.

Remember how many times this week (and over the years) I said the range in the market (2.5 weeks of chop) still had not created a head fake move and in general and in any timeframe, we see a head fake move about 85% of the time just before a reversal.
You might remember when my forward trend analysis was a wide, choppy range? Well that went on for 2.5 trading weeks, it's way too obvious not to hut and the articles, "Understanding the head fake move" will clearly explain all of the reasons why or at least numerous ones. This isn't a coincidence it happens so often, it's not random, there's a reason for it and rather than memorize a price pattern, it's much better to understand the psychology and utility of the move.


I mentioned the intraday look in the averages today vs the charts just slightly longer, take a look.

 SPY 1 min almost perfectly in line overall since the ECB story in the WSJ yesterday

However the 5 min chart is not only in a large relative negative divegrence, but a leading negative that started... guess when? Right on the open today.

 This is the 10/9 cycle to present. It might surprise you to know that we predicted this move BEFORE we had any signals based on market behavior and our watchlist.

It might also surprise you to know there were 13 days of accumulation in to the 10/9 lows and a head fake move below the yellow trendline. The mark up period lasted approx. 2 trading weeks and the distribution period about 3 trading weeks, however the distribution period is often in to higher prices that aren't actually mark up. It appears we have a head fake above the yellow line just like at the bottom of the cycle and leading divergence in to both.


 QQQ 2 days intraday 1 min in line...

However just at 2 mins we move from in line yesterday to an almost immediate negative divgerence on the open and leading negative which is interesting because that's what we saw overnight in Index Futures (5 min charts).

 I think the intraday IWM 1 min needs no commentary or drawing, that's as clear as it gets and the only average to both close in the red today and to put in a Harami (bearish) reversal. 

And the IWM 5 min chart. I really expect, but REALLY hope that both the IWM and PCLN become textbook examples of Channel Busters, if so, although I've covered the concept many times, I'll put a full post and link on the site- they are just that predictable, you could run scans looking for Channel Busters and have a high probability bunch of winning trades.

Also mentioned last night was not so much the level of the CBOE SKEW INDEX, but the Rate of Change. The CBOE's SKEW Index tries to predict unpredictable or unlikely events such as a "Black Swan" or sudden 1987-type crash.
$115 is the safe or normal zone, above $130 and it starts to get troublesome, $140 and it's in the red, but it has picked crashes in the $130's.

Now both the ROC and level are getting worrisome.

I decided to hold GDX/GLD for a bit longer, the reasons (although a tough choice) can be summed up in two charts each.
 3 min GDX looks negative and likely a gap fill pullback, but...

 There was no negative migration to the next timeframe, 5 mins which remains leading positive suggesting any pullback would see another leg higher. If GDX pulls back, we should confirm intraday positives, but it looks like a good area for a GDX call option or a 3x leveraged long, NUGT.

GLD is the exact same situation...
 Toward the end of the day several timeframes went very positive like this 5 min, again around the same time as VXX or the Yen or HYG.

The 15 min is still leading so I'm still thinking any correction will see a leg higher. I do think GLD is not done yet with its final pullback before a strong up trend, but this is tradable.

In Leading Indicators there were almost no surprises, things looked like the 1 min charts of the averages, only in a few places are they odd.

Take Yields...
Yields (red) vs SPX (always green) recently converged or reverted to the mean as the market chop ended, however now yields are heading lower and they tend to act like a magnet for equities until they revert to the mean and touch. Long term there's a huge dislocation.

High Yield Credit (Credit leads, stocks follow) was not playing along today.
Not only did HY Credit not play along, it closed right off its low of the day and on just about 2x volume.

HYG Credit is an arbitrage (manipulation in this case, but typically short term ) asset because algos read HYG up as institutional money in risk on mode so it often is lifted to create an algo driven rally, in fact Capital Context's SPY Arbitrage model only uses 3 assets, TLT, VXX and HYG.

While HYG was in line with the market...
 3 min went leading negative around the same time VXX went leading positive and the Yen changed as did many other assets, something around 1-2:30 today


Since the 5 min chart (even though the reversal process was very close to a "V") is still not that far out of line, I expect it will take a little more time (and it's hard to get any changes on Op-Ex Friday until after 2 p.m.) for this to go negative and thus be out of the game, however maybe it does move during the pin.

We had a Dominant Price Volume Relationship in EVERY major average except the Russell 200 which only diverged because it closed down.


These are the component stocks in each average, not the averages themselves.  The Dow, SPX, Russell 2000 and NASDAQ 100 all closed: Close Up / Volume Down, this is the most bearish of the 4 combinations and it was so dominant that it accounted for more than half of each index.

Typically this is amn overbought condition or a market losing support for higher prices, typically the next day closes down, HOWEVER TOMORROW IS THE TYPICAL MAX-PAIN OP-EX FRIDAY, which means until most contracts are closed around 2 p.m., the market doesn't do much of note. AFTER 2 p.m. price will do whatever it wants, it usually has no value for next week analysis, but the 3C signals in to the close almost always pick up on Monday right where they left off Friday regardless of what price does.


USO is one I like and last I updated it I said I thought it had a little more lateral reversal process, I think it's pretty close to done- THIS IS NOT THE SAME AS THE ENERGY GROUP, it's a part of the group, but only a part.
 The long term 60 min set up from distribution to lower prices to accumulation and a bottoming process, I think USO can make it back inside the channel before heading lower.


The 15 min chart is going from in line to a clear positive divegrence and that lateral, wider reversal process I thought we should expect to see, but from here I think it's very close to a strong counter trend rally on the upside of course.

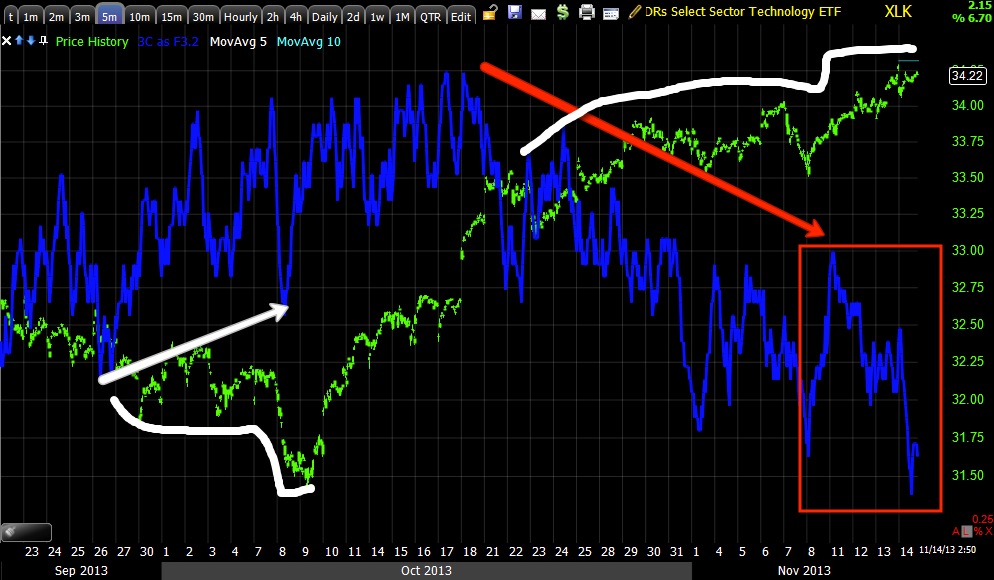
Finally here are Financials as I already covered Tech.

 In my last Financial update, I wanted to see XLF>$21 before considering a short/put and FAZ <$24.

This is the entire cycle from 10/9, significant accumulation, distribution and the move above $21 with a leading negative divegrence, there's serious damage in place everywhere.

 Inrtaday, XLF saw strong and clear distribution

The 5 min chart shows the positive where I called a "mini cycle" and now a clear leading negative in to the move above $21 which is what I wanted to see to consider adding to FAZ long or for an XLF Put option. I'll be watching for an opportunity if anyone is interested and I'd be interested in a put.


As for Index futures tonight, they moved up last night and then were nearly unchanged at this morning's open. The same nasty 1 min negative divergences are in place and the 5 mins are moving in place as well. Last time this happened Tues.-Wed. overnight in to Wednesday's open, ES lost 10 points in the overnight session before the ECB news sent the market knee-jerking higher. It will be interesting to see how this resolves, I wish it weren't an op-ex Friday tomorrow.
 ES 1 min

ES 5 min

NQ 1 min

NQ 5 min

I'll let you know if anything changes.


XLK / Technology / TECS Follow Up.

TECS (3x short Technology ) is a trading position and I have been thinking about adding to it at the right time.

Tuesday I posted an XLK/TECS update and the gist was still that XLK wasn't there yet, the rounding process, the Igloo with a chimney pattern wasn't there yet, but I do still like it and continue to hold TECS long as a trading position.

Yesterday I added to the TECS position by a little. So I'm happy to see XLK underperforming today.

Today among other areas of dispersion in the market, Technology is seeing it too, which is unexpected when looking at the Q's (tech heavy).

. *Remember that tomorrow is an op-ex Friday, typically the market opens Friday near Thursday's close as it seems Thursday is often used to get the market near "Max pain", especially if it is way off as it would have been yesterday on the open with overnight futures down -10 points until the ECB/WSJ article.

Here are the updated XLK charts
This is an hourly chart of XLK, the red trendlines are the range from open to close, yellow is today's range, down -.29%while the Tech heavy QQQ were up +.27%, an odd dislocation.

This might have been because the NASDAQ 100 which is heavily weighted with AAPL benefitted from AAPL's close of +1.48%.

However, I wouldn't get too attached to AAPL longs...
 AAPL 10 min leading negative from inline, this is probably good for at least a swing trade short.

 AAPL 5 min from small accumulation to inline to a relative negative divergence (the weaker kind) to a leading negative divegrence (the strongest kind).

AAPL 1 min intraday from in line to NO DICE, not even the 1 min intraday will follow AAPL higher.

*Market Makers, Specialists, Tech traders, etc. know what the flow or the tape is, these are the stocks they trade every day, they know who's buying or selling so it wouldn't surprise me if they were seeing trends in technology flows emerge and that's what we are seeing emerge in XLK.

As I typically show, a bottom reversal is tighter than a top most of the time, but the same concepts are in play, the "Igloo with a chimney" even at the bottom, just inverted. There's about 2 trading weeks of accumulation in to the 10/9 lows, we saw this in advance and had expected to see it before we even had 3C confirmation.

On the top side, we have about 3 trading weeks of distribution, I didn't count the mark up in the middle, we also have the Igloo/Chimney.  THESE ARE THE SAME PROCESSES, JUST IN DIFFERENT SITUATIONS, BOTH HAVE HEAD FAKES, LEADING DIVERGENCES AND AREN'T TOO DISSIMILAR IN TIME.

If you haven't already, I'd encourage you to read the two articles linked on the member's site:

"Understanding the Head Fake Move: How Technical Analysis Went From an Asset to a Trap"

Understanding the Head Fake Move: Motivation

It wasn't just XLK's daily price weakness, there was clear 3C weakness right off the open in a fast timeframe that picked it up immediately.

This is the 3 min chart, divergences migrate to longer timeframes"IF" they are strong enough.

Here we see accumulation right at the area I called a mini cycle a week ago tomorrow. The leading negative divegrence is CLEAR, but look at where the divergence started!!! It started RIGHT AFTER PRICE MADE WHAT WE'D CONSIDER A HEAD FAKE MOVE ABOVE RESISTANCE.

Selling in to strength, buying weakness, both are visible on the same chart.

It goes without saying, I like the TECS 3x short technology long trading position added to just yesterday.

Quick Market Update

The Russell 3000 Most Shorted Index (mine), has been squeezing since 1 p.m.

The 1 min charts in the averages are in line and look like there's nothing unusual with today's price move at all, it's when you get to 3 and 5 min charts that it starts standing out and the IWM with it's channel buster is one of the ugliest. I suppose if I had to pick a trade really quick among the averages for tomorrow it would be the IWM short or SRTY long which is an open position doing well that I'll continue to leave open.

Remember tomorrow is a Friday so we have the op-ex activity (pin) that we see nearly every Friday.

 MSI squeeze at 1 p.m., starting to fall apart.

IWM 1 min intraday, the faint grey line is yesterday's close which the IWM has been struggling with all day-market dispersion.

IWM Channel Buster, I didn't want to draw on the chart, but now the intraday is turning and the longer chart is in place, it looks like IWM will be heading for the lower end of the channel and maybe then some.

SPY 5 min today alone, as I said, 1 min charts won't tell you, it's in the 3, 5 min etc like Index Futures.

QQQ 2 min intraday

 VIX futures are still running positive


From a breadth perspective, the NYSE TICK trends from +1600 to...

HYG (High Yield Credit) and VXX (Short Term VIX Futures)

This is what we saw yesterday morning, it's easy to forget that the overnight session saw ES futures down 10 points by the open as things changed very quickly after the ECB hinted in the WSJ that all options, including ASSETT PURCHASES (read as QE) are on the table, even though their charter expressly forbids them from doing so (there's always a loop hole for an organization run by a Goldman Alumni- Draghi).

HYG moving up helps the arbitrage trade and supports the market and VIX or VIX futures moving down does the same, this is what we saw early yesterday and posted it in the morning, I believe it was, "They are going for the SPY Arbitrage".

So the opposite signal has the opposite effect. TLT is the third asset in this scheme, TLT up is market negative and TLT down is market positive, although the correlation with 20+ year T's has been all over the place lately unlike the 10 year benchmark.
 HYG 5 min chart showing the top rounding with a chimney (via ROC) and the sharp fall after. Then at #2 there was an attempt to accumulate and create a base to support the market, it was nearly complete when it suddenly failed. #3 is the very sharp, "V-like" reversal, this is too tight, I don't trust these to hold long and true to experience...

Here;s another look with an intraday 1 min trend, you can see the accumulation at #1 and the sudden failure as it went negative just as the "U" reversal was nearly done. At #2 we have the much sharper "V" that we were looking at yesterday early in the morning, expecting they were trying to move or support the market.

 This is HYG intraday going negative in to a very FLAT range, a common place to see accumulation or distribution (think VWAP).

And the 3 min chart going positive as mentioned early yesterday and a VERY sharp leading negative divergence this afternoon.

VIX short term futures, I'm using UVXY, some say it tracks better than VXX, but I just haven't been able to rescale VXX yet.
 Since the area in which I first saw the mini cycle divergences around the 7th, there has been positive 3C underlying tone here, despite the VIX getting hammered nearly every day to push the market up or for an EOD ramp.

This VERY sudden and very strong intraday leading divergence is an attention getter.

Something certainly seems to be going on and very quickly between HYG and VXX.

You can see it migrating to the 2 min chart as well

And the 3 min chart, this is the kind of edge I look for, it stands out, jumps off the chart.