Tuesday, October 1, 2013

EOD Market Update

The market looks to really be on the fence and can you blame it? It's very likely that the continuing resolution debate is being taken as the "tone to come" in dealing with the debt ceiling, that has to be done by Oct. 18th I believe and the last time we were in a nasty Debt Ceiling fight, the market fell nearly 20% late August of 2011 in to September.

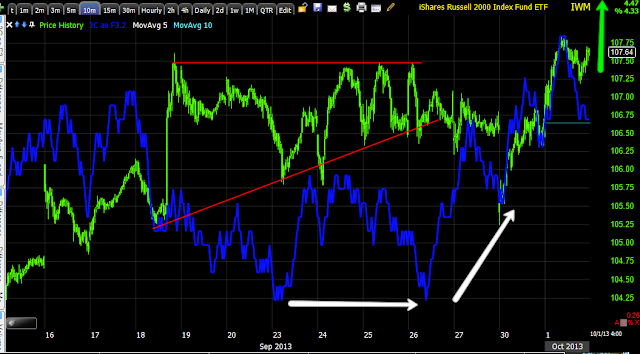
However for our purposes, this could all work out fine if for instance the market is able to pop higher over the next week or so and then falls apart in to the Debt ceiling, it's almost exactly what the IWM 10 & 15 min charts are suggesting. Last night in the video I said I could sum up the market with those two charts, the near term price action and what immediately follows, it's exactly what would benefit us the most so for now the question is simply whether the market can make the next several days count on the upside with an IWM breakout?


Leading Indicators aren't that helpful today, they seem to be on the fence as well, only HIO (sentiment) is clearly positive, VIX futures also look like underlying trade is lagging suggesting there's not a huge rush to buy protection from downside right away.

 Closer to home, the charts this afternoon...
 This 15 min SPY chart, if it can hold, answers the short term question about where the IWM/market goes.

Intraday the earlier negative gained a little strength

As did the 3 min

And you can see it reflected in the TICK data as well.

TLT just hit one of my intraday upside targets so I'm happy to have closed the puts near the L.O.D. today, but I'll be looking for the next entry in TLT short for a near term trade.

Still, the two charts that sum it all up remain the IWM 10-15 min.
 We are pretty much there, above resistance is where the core trades are, the easier trades to take, the longer trending trade, we are so close I can't see how we miss.

This is the 15 min chart and would be what comes next, once the core shorts are added, this should be the market response, it fits almost perfectly with the debt ceiling.

Short term longs right now are much more difficult than long term shorts above resistance will be, trust me.


MCP Charts

The last update I did on MCP was Sept. 26th right as it was coming off a downside reversal.

In that post I listed the two most likely pullback areas to be $6.79 and $6.53, today we hit $6.46 and right at support which it has generally been respecting. I would recommend going back and reading the last update linked above as there's a lot of good general and specific information for MCP and general concepts.

Here are the charts now that MCP has pulled back to the area that was expected last week, but that's not what triggered this idea, it was the charts today.

 Daily Ascending Triangle base which has respected support and resistance fairly well, but this is also about our X-Over system which gave me the downside pullback targets which happened to be at support.

The intraday chart out of a bearish descending triangle.

The 3 min chart in a flat range that looks similar to a tweezer bottom reversal on the daily chart.

The 10 min chart is very clean, the trend very clear.

As is the 15 min chart.

I don't know if this will lead to a major base breakout, but it's worth trading in my opinion.

Trade Idea: MCP Long

I'd rather use MCP equity (long), but being I don't know how long we have here, I'm going with November  $6.00 Calls.

I'll post charts next...

Also 1 min charts are now turning pretty positive.

Intraday Divergences on Key

Earlier this afternoon I posted the intraday negative divergences , after that point, there was ZERO reason to be long or enter longs.

Now, after a nice rounding intraday top, we have the continuation of the earlier signal.

While I'm not trying to turn this in to an options day trading site, it's very clear and was very clear as of the afternoon highs, that one could easily put on some leveraged day trades and make at least a few bucks to take one's significant other out to dinner in an otherwise dull session.

I'm going to take a look around at some other assets to see what else can be learned, of course any buying on a pullback first needs the pullback and second needs confirmation that the pullback is being accumulated so as of right now, unless there are some very specific trades, I would say this is another day in which patience may not make you much money, but it's likely to save you money.

Gold / Silver & GDX

Yesterday I put up at least 2 posts dealing with gold and silver, this quote was from one around 10 a.m. yesterday morning...

"Overnight I couldn't get a sense of gold, the charts were foggy for futures there, Silver and Gold futures had different divergences, but both were very close to what I'd call the middle in this case, that's not in line, it's really the worst reading in 3C, the one that has no value, it doesn't tell you much one way or the other "

In another one I said I wasn't even going to put up gold/silver charts because there was no edge in them and I didn't want people looking at them and seeing things like we see animals in the clouds.

While silver has a little improvement, I still wouldn't trade it, gold I still wouldn't post.
 This is the 30 min Silver Futures chart, there's improvement, especially on today's move. I wouldn't enter a position, but it does suggest there's a positive bias or accumulation of silver here.

Before today SLV's chart was just gibberish,  this is why I didn't want to post it, it had no value, but something interesting is starting today.

This may simply be a counter reaction to the market divergences or the start of something that may lead to a trade.

SLV 10 min is largely in line, the pops out of the trend are all on leading negative divergences and all fail. There's a head fake move that "should" have (according to Technical Analysis) made a next leg lower, instead it trapped shorts and popped higher, that was about the last good information.

 GLD 5 min shows good information in to the F_O_M_C, after that, gibberish and still not much to go on.

GDX however is interesting in that a bear-flag and bull-flag both head faked technical traders as we expect and twice in a row. The recent activity from last Friday forward continues to look interesting, I continue to hold the GDX/NUGT positions.

GDX 5 min positive trend last week, but much like the broad market and then a failure below what could be a bearish descending triangle, it seems to have been accumulated.

This 15 min chart shows a bearish bear pennant (like a bear flag) and the break technical traders would expect below the pennant, but 3C remains at a leading positive divegrence, this does seem like a larger head fake than the last two failed flags and I suspect this will be a third failed flag/pennant which is the biggest of them all so a reversal here should come with a pretty hefty short squeeze so I'm sticking with GDX/NUGT longs, I might consider adding if the signals are irrefutable, I'm staying away from gold and silver for the time being.

Market Update and Tactical Use

These market updates aren't just for your information, in fact the reason I first started using the tracking portfolios was to place orders based on market updates alone to show you that the information there was actionable. By showing you trades that made money based on the update alone rather than a trade idea, I was trying to show you that you can use these market updates to trade or plan trades without any official positions being called out as each member trades in a different way, many use the market updates for that exact reason.

I think I may start a trading portfolio rather than the tracking ones, just so I can show you the usefulness of the updates as well as some concepts in risk management, trade management and patience.

For now, after having looked at the futures and the other averages, the SPY is a good proxy for the market so I wanted to give a little more in depth look at what the charts are suggesting the most likely short and longer term paths are, you have to think about how you can use them.

For today, the intraday activity suggests that we can pick up some more longs, the ones we looked at yesterday, but just didn't have enough objective data to place a lot of the trades. These are shorter term in nature as are market theory would go so I prefer some leverage, whether 2-3x leveraged ETFs or options, it doesn't make that big of a difference to me.

 SPY intraday 1 min negative suggests a pullback, this is where we'd be interested in looking at short term long positions.

The 2 min isn't as bad...

The 3 min is even weaker on the intraday negative, this suggests a pullback is likely, but it's not strong distribution so I'd use it to look for longs I like at a discount and lower risk.


 The 5 min chart since the F_O_M_C and last week's accumulation vs. more recent 3C signals

30 min positive currently, this suggests that any short term long positions are now a lot more worthwhile than they were last week.

Like the difference between the IWM 10 min (bullish short term) and IWM 15 min (bearish longer term), the SPY 4 hour is showing the same, this suggests that while short term longs can be profitable, the larger trade is to use any price strength to enter, re-enter, or add to Core Shorts for the next trend which should be a much stronger trending bear move.


Trade Entry / Update XOM / ERX... Long Energy

Yesterday I entered the 5th XOM trade since starting a core short there and the 4th since a counter trend bounce started in late August.

I like the XOM November $85 Call position entered yesterday a lot still, I also mentioned ERX for those who preferred sticking with equities/ERFs, but still getting some leverage on the position.

 I think XOM and ERX are still in a reasonable area for a long position, although yesterday was the better day for XOM calls as the momentum was on our side to discount the premium of the calls.


I fully intend on re-entering the XPM core short, just not yet. This would be the second counter trend long since late August.
 The long term view on a 5-day chart of XOM shows a bearish "Ascending Wedge", these have changed their behavior significantly over the last 3-4 years and act nothing like what Technical traders expect, however are still very easy to trade.

Technical traders expect price to break below support as the price pattern's support and resistance trendlines converge in to an apex. From there the rule of thumb is, "Wedges retrace their base", meaning somewhere around the green dashed trendline.

However we have seen time and time again this decades old price pattern (really closer to a century)  pull an initial head fake like the move below support, then another Crazy Ivan head fake above the apex before actually breaking to the downside and reaching the same target zone, usually as a minimum target. Think about how each of those head fakes primes the next move and how they can be used tactically and strategically by smart money, to understand this you must understand Technical Analysis' culture which states that, "If a price pattern doesn't do what it is 'suppossed' to, then reverse your trade in the opposite direction".

The yellow arrows are a more likely path for XOM.

 This daily chart shows where XOM "Was" a core short position, around the end of August it was covered, profits taken and a counter trend bounce long was opened and finally closed at a profit. It looks like we'll get another counter trend move higher from here, which would help that 5-day chart see a price break above the apex of the wedge.

Yesterday I entered a new XOM Call position and mentioned ERX as an alternative play in equities/ETFs.

This closer daily view shows the initial cover area for the core short late August and the initial long trade, now price has broken below support, formed a bullish reversal Doji candle yesterday on increasing volume and is still in decent position for new longs.

 The 15 min chart shows the initial core short negative divegrence in July, the BTC in August and counter trend long position and the new positive divegrence for what looks like a new counter trend move, I expect it to make a higher high.

The 10 min chart has a leading positive now as well

Here's a closer look

And the 15 min chart is leading positive too, this is enough of a divegrence for a counter trend move to the upside.

We even have a 30 min leading positive divegrence in XOM.

ERX should work as well (3x Long Energy ETF)
 ERX 60 min shows the ultimate probability of longer term direction and that is for the initial downtrend to resume at some point, but...

For now, ERX, like XOM also has a leading positive on the 10 min. chart

The 15 min chart after a quick stop run and a daily Doji reversal candle yesterday

And like XOM, the 30min is positive too.

This looks like the last decent area to enter these positions.


TLT & Market Update

A move up in TLT "should" see a move down in the market and we do have intraday (mostly 1 -2 min) negative divergences in the averages.

As I said, I expect the move in TLT to be temporary and we may be able to enter at a better price, that means I'd expect the pullback in the market to be temporary as well.


At the $3.60 fill TLT's P/L came out to +16%

TLT 1 min positive looks like an intraday upside reversal will start soon.

We have a 2 min relative positive as well so thus far I think it's only an intraday correction.

TLT 3 min is about as far as we go.

The 10 min TLT chart shows the process of trend confirmation to a negative divegrence, a break of the trend and what will probably be a gap fill before the trend resumes to the downside with my initial target being $102.ish

Closing TLT Nov. $108 Put

I think it may bounce and we'll have another opportunity to enter.

Market Update

If you watched last night's video or late Friday/Sunday's analysis, the trend was, last week saw weak accumulation through the week, but after the Friday op-ex pin was over around 2:00-2:30 positive 3C divergences picked up a lot of strength, the strongest on the week.

I thought this was odd because we were going in to a weekend Congressional session that seemed like there would be no resolution to get around a government shutdown with the Senate not even due to return until the 11th hour so even if the House had put something plausible together, the Senate would have minimal time to consider it and that was purposeful, so why the addition of risk in to the weekend when most traders reduce risk in to a weekend and uncertain events?

It seems the market had already discounted the government shutdown as a done deal, perhaps they think it will extend QE or make the debt ceiling negotiations easier as the American public will be sick to their stomachs with the government shut down, no elected official would dare anger the public again with another impasse with the debt ceiling debate over the next week or so. I really don't know, but we have had increasingly strong signals (remember I added GS calls Friday) the closer we got to this event, last night's video details additional short term strength in Leading Indicators and ESPECIALLY credit.

This is obviously one of those disconnects in the market that doesn't seem to make sense like a company with good earnings selling off. However it very well could be the simple removal of uncertainty, along the lines of, "When the missiles fly, it's time to buy"


War is hardly any more positive for the market than the shutdown, the point is, the uncertainty in the lead up to war is removed once it begins, we may be seeing a similar effect here, the uncertainty (for the moment) is removed and the market can discount, but this seems to have started Friday afternoon .

Some of the accumulation, focussed on last week starting with the 23rd (Monday)
 DIA 15 min with increased 3C positive divegrence in to Friday/Monday

The Q's have been the worst looking in underlying trade, this 5 min chart that is in line, is about as good as it gets.

 Daily SPX chart... We had the channel as we've went over before, the channel buster which is deceiving, a nice rounding bottom last week, a head fake low below support running stops/getting shorts in the market and the candlestick formation we expected (a bullish Hammer reversal yesterday on increasing volume).

The Channel Buster is deceiving as it will generally head back INTO the channel before falling in earnest, VERY similar to our IWM situation (10-15 min charts).
 
 SPY 15 min with growing accumulation in to the head fake/ stop run under support which we see 80% of the time before a reversal, maybe more.

GS that I entered Call/Long Friday

IWM w/ an uptrend and then a bullish consolidation/continuation Ascending Triangle, and as expected a head fake shake-out /stop run below the triangle's support before an upside reversal, again the head fake move seen about 80% of the time before a reversal on any time frame).

I have thought since last week that this Ascending Triangle was NOT coincidental or a natural forming price pattern, 3C shows it was built, it comes after an uptrend as it should, it is doing everything we expected from the shakeout to a move toward a breakout. This is what we have been expecting from this pattern, and this is why I keep saying I can show market expectations for the near term and what comes next with only 2 charts, the IWM 10 min and 15 min. UP & DOWN.

Last week's weaker accumulation, then the head fake move sees increased accumulation as Wall St. is able to find more supply on stops being hit at cheaper prices.

It's now, VERY much about what comes next.

First we need to make sure this will hold and breakout as well as manage positions taken up for this move.

Next a large portion of time will be devoted to core short positions if we get the breakout above the triangle or in to the SPY's channel.