Tuesday, October 21, 2014

Daily Wrap

There's not actually too much to add to what we've been looking at all day except a few interesting tidbits. As mentioned the market has been in rally mode when volume is below average and selling off above average the last several weeks like clockwork, so when the NYSE broke 13 minutes in to the day today taking out 150 symbols from AAPL to XIV you might imagine the volume and more so the volatility, this coming after a Reuters rumor on the ECB open, after the market had lost 20 ES points in overnight trade, that they'd be buying Corporate bonds, this was shot down by the Financial Times shortly after, but the futures made their move.

Interestingly, XIV, one of the symbols not working on NYSE today (inverse VIX) led the market higher, on below average volume of course. The Dow closed up 207 points despite bad earnings reactions in KO, MCD and IBM (collectively they shaved 65 points off the Dow and it still closed up over 200 points).

The NASDAQ had its best day of 2014 and best 3-day streak in almost 3 years, that's what you get with increased volatility and a positive divegrence that has been in effect since Oct. 2nd, this is why I tried to anchor expectations for this move last week BEFORE it started and I don't think we've seen anything yet.

As I said earlier, the sharp "V" bottom is like having 2/3rds a tank of gas and 1 flat tire, a stronger "W" base could and should take the market higher and today despite the broken NYSE, ECB false rumors, etc. the market rallied hard, but I suspect we do come back down a bit, maybe kick out some of the new retail short sellers who wanted in at SPX>200-day which happened today and then take the market higher, which would change sentiment after being booted out of a new short and then seeing the market rise above the level you entered, although that's speculation, it certainly would be effective in changing sentiment and that's what these moves are all about as well as profits as you know, this move has been under accumulation for most of this month,

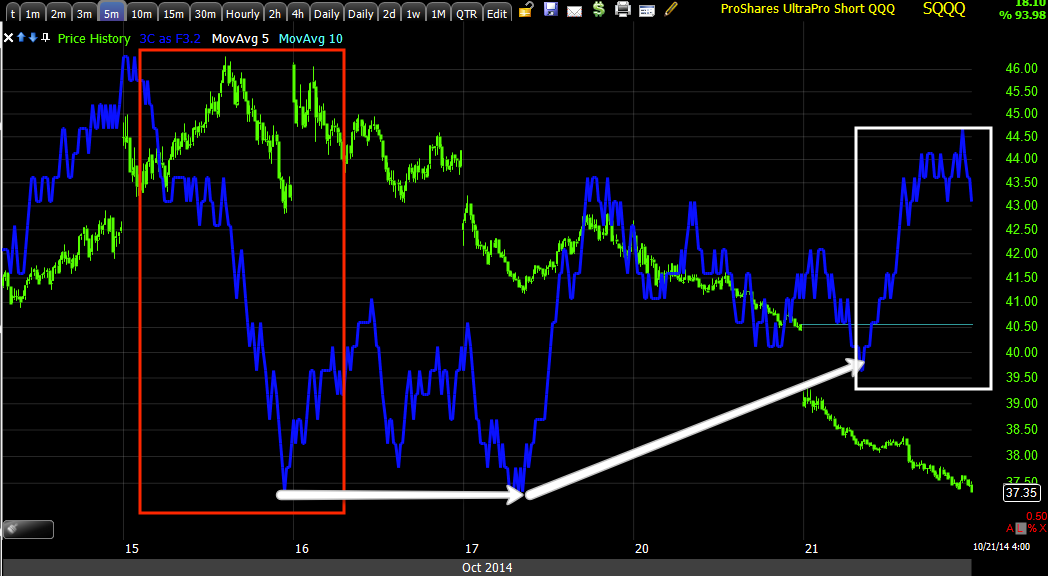
This is why I chose the SQQQ (3x short NASDAQ 100) today for a trading position...
Unlike the R2K which has a sturdier base and has been almost exclusively driven by small/mid-cap short squeeze action...

Note our Most Shorted Index massively outperforming the SPX since the "V" reversal kicked in.

 The NASDAQ/QQQ 5 min above has that "V" base I think will need some additional support to get all they can out of the accumulation put in most of this month and the 5 min charts are signaling the same.

 SQQQ 2 min looks good, it also looks like a rounding base which is appropriate for the size move preceding it, a reversal process rather than event.

And the 5 min chart here just looks better than any of the other inverse ETFs (leveraged) with additional confirmation in QID and QLd (2x long and short QQQ ETFs).

All Carry risk was in the Off position today, JPY carry and credit wasn't excited wither, you saw the near term distribution in HYG already, which we'll have to keep an eye on as to whether it will lead the market on a pullback or whether it is DONE. So far, price wise, HYG continues to lead, but with those negative divergences building, just as they built positive before it moved up, it will be coming down.

Spot Vix was briefly cut in half today from last week's intraday highs, this is the accumulation we have been following and we are really only 3 days in to it and the SPX is already up over 120 points.

The lead in Trannies (Dow Theory) worked out as the rest of the market followed the implications, however today's 3+% move looks like a short term flameout with the same or worse intraday 3C negative divergences today.

Finally like yesterday, we have a strong, even stronger 1-day overbought event with the Dow, NDX and SPX all Close Up/Volume Up, the most bullish of the 4 relationships, but also the most likely to create a next day close lower. Taken with another day of 9 of 9 S&P sectors closing green with ENERGY of all , leading at +3.04% and Utilities lagging at +0.34% with a WHOPPING 227 of 238 Morningstar Groups closing green, we are definitely short term overbought, combined with today's 3C signals and I wouldn't be surprised to see that pullback.

Just remember, the move I described ion the upside last week before it started, is even stronger than this as I envisioned it, so keep those expectations anchored and if you need it, I'll post the highest probability 4 hour and daily charts, this market will make a new lower low after this is done, we have just been too bearish with the Fear and Greed Index pegged at ZERO, extreme fear for nearly a week...Too many people on the same side of the trade.


Trade Idea (Speculative Short Term 3x ETF) SQQQ Long

I'm going to go ahead and open 1 full size trading position in SQQQ (long), I just have a strong feeling this is coming down and if I'm wrong I can either stop out or in the worst case scenario, hold for a bit and it will come roaring back.


Market Update

Sorry for the delay, I've just been checking everything carefully.

We haven't taken any action, except I know some of you have taken some management action, closing some calls at gains or lowering exposure in certain areas.

It's still a bit difficult to tell what this is,  but last week you may recall me saying, I'd rather miss the move than get in on a sub-par base that will cuase me to lose sleep", of course I don't mean literally lose sleep, but figuratively. This is one of those bases thus far which is why I've kept long exposure to a minimum at this point. 

A pullback to create a "W" base looked to be on the table, even last night as the market saw ES down 20 points before the European rumors at 3 a.m. which is what changed everything, otherwise we may be very well have been headed toward that stronger "W" base, the kind you can trust. A "V" base is  like a parabolic move or like trying to build something tall on a foundation that has a "V" shape rather than a broad, flat "W" or round base, it's really no different.


 Again, this is the SPY 60 min chart showing the last substantial base in early August and the support that the shape of the base gives compared to the very tight "V" shaped "Event" rather than reversal process. We don't see these "V" shaped bases often and there's a reason, they typically don't hold well.

One potential move is a "V" shaped downside reversal just like a parabolic move up that ends with just as sharp a parabolic move down.

Or perhaps we make more of a rounding top/pullback area as drawn in yellow. There are still a lot of possibilities based on the charts we have. Whatever happens from here, there are a few constants I think you can count on.

A "W" shaped base would be preferable and be able to do the job that the 3C charts suggest is trying to be done, this "V" shape will be much harder to support that kind of move.

 Here's the same in the QQQ...

Now, the charts...

I'm going to use the SPY as a broad example that pretty much covers all of the averages with a few small details here or there a bit different, but not much.
 Intraday the SPY 1 min looks a bit like a more rounding Igloo top, this may have changed by the time I captured, uploaded and write this, but if so, note the distribution at the chimney area as well.

 We have migration of the divergence, this is a negative SPY 2 min chart. Usually if the market is just consolidating sideways from a gap up, a 1 min divergence is enough, when a 2 min is added the probabilities of a pullback go way up short term.

 The 3 min has migration to leading negative as well as a relative negative, it almost looks like this is the area the SPY is suppose to turn back down , almost as if this were the neckline of the larger base.

And the 5 min chart shows the same thing, this is pretty serious out on a 5 min chart.

However, make no mistake, the charts are telling us, however we get there, this market is going higher so keep that in mind.

Take the SPY 15 min for example. I can show you these in every average and past 15 min so this  is VERY high probability that we see additional upside gains, the kind I tried to express last week in anchoring expectations. I DO NOT THINK THIS MOVE IS FALLING APART.

 UPRO 3X LONG SPX 5 MIN IS ALSO SHOWING THE SAME KIND OF PULLBACK DIVERGENCE AS SPY 5 MIN.

And at 10 minutes,  again make no mistake, probabilities are VERY high that we make a much higher move, it's just very short term how do we get there, I still lean to a pullback and broader, stronger base.

 While we are at it and discussing things you can count on, no matter what the upside move, no matter how powerful, we will be making a new lower low after as this 4 hour SPY chart shows, the highest probabilities,

QQQ
 At 5 min the QQQ is showing the same thing, as if we should be pulling back in the area.

Even out to 10 min, make no mistake though, after that this is very positive and we should absolutely see much higher moves, again, it's how we get there and how we want to play that.

TQQ the 3x long QQQ 5 min chart looks the same as SPY and QQQ.

And SQQ, 3x short QQQ is the mirror opposite on the 5 min chart suggesting a pop up in SQQQ and down in the broader averages, again in my view if this keeps building the way it's going, it is to build a stronger base and finish a much stronger upside move followed by a bear market lower low.

IWM
 URTY, 3x long IWM 5 min is lagging as well, suggesting the same thing, a pullback.

Even at 10 min just like the QQQ 10 min chart.

Even at 15 min,  again make no mistake, after that it is VERY strong. 

So I'm still trying to see if we are on track as we were yesterday and overnight until an unsubstantiated rumor moved the market, a rumor that was later shot down.

Until we understand the short term probabilities, I'm loathe to just throw dice in the dark.

Market Update

You've already seen the SPX/RUT charts and VIX Inversion, that longer term chart is still bullish, very much so, it has been the near term charts that have been looking like we pullback and create a base that's more stable than a sharp "V" which is typical of counter trend rallies in a bear market, but not of really strong moves that change sentiment, which is what I suspect this one is based on the size of the base over time and divergence, it's just that launching pad area is such a sharp "V", it just doesn't fit with the rest of what's there.

In any case, here's what has happened so far today and while you're looking at it, recall last night's overwhelming 1-day overbought conditions.

 SPX/RUT Ratio showing the divergence in to the base area and the recent divergence suggesting a wider "W" base on a pullback is likely.

Intraday, more specific to today, you can see the clear deterioration here, continuing from yesterday.

The SPY 1 min, my how fast things went south there, but it's still a 1 min chart.

 There's clear migration of the divergence so it's getting stronger as the 2 min chart shows

As well as the 3 min leading negative

The issue is at this point is what to do with this beyond a fade trade as the 15 min chart and some others even stronger are still VERY much positive like you see above. This is not where I'd be entering my core shorts for the next lower low leg down yet. Perhaps a wider base as I have anticipated, perhaps not, that's what we are looking for.

 QQQ 1 min the same very ugly intraday distribution, again still just a 1 min chart


migration to the 2 min chart

And to some degree, migration all the way out to 5 mins, so this could get worse as mentioned earlier if the market holds up long enough.

Again, as mentioned there are some very strong charts that have been building a strong divegrence most of this month like this QQQ 60 min so we have to keep this in mind as this really is still the dominant swing chart.

IWM 1 min

3 min

and again, a strong 15 min.

So for me, it's still time to be patient and look for the clues that tell us how this resolves. If it looks like a pullback to a wider base, we'll see that as price pulls back, the charts should start going positive, that would be a buy opportunity for a swing+ trade. This could be a sharp gap fill, it could be a lot, it's very early and so far quite extreme.

FADE TRADE-

I'll have some charts up in a moment, but as a lot of you have probably already figured out or entered, we should have at least a fade trade in SPY and QQQ, also IWM, but I prefer the first two at this point. The issue is, it may be intraday depending on how bad the divergence continues to develop and how long the averages can stay up to allow that to happen so if you are not Reg. T. compliant, just keep in mind the day trading rules.

I'll have some more charts to show you where we are now, I wouldn't say we are at a full on short, perhaps we are going to make that "W" base after all, but for now, I'd call it a fade trade.

HYG Support Giving Out

Last week we saw accumulation in HYG, High Yield Corporate Credit,  there's only one reason to accumulate HYG and that's for short term market manipulation, this was one of the ways we knew the market would be heading up. 

Right now, that support via HYG's price , which is what the Algo's cue off of is still there as it's leading the SPX... "Credit leads, stocks follow"...
 HYG leading the SPY...

However the distribution that has started in HYG is now starting to migrate to some more serious timeframes, taken with that sharp "V" base and this move looks a lot like the typical short shakeout, although we still have issues such as this is where retail wants to be short so we can move back toward the base lows ad put in a "W" that will create a strong, face ripping rally or we hobble along with the weak base support we have right now as intraday charts of the averages are seeing very sharp deterioration intraday and at this point, that's as far as those divergences can go, meaning they are as sharp as they can get without additional time to migrate to longer timeframes.

So there are still some unanswered questions here as far as short term trade goes, but more and more clues are stacking up.

This is what the rest of the HYG charts look like as the negative relative divergence on the 1`0 min above is about as far as the HYG distribution signals go so far.

 This is the HYG 5 min chart, its divergence is sharper than the 10 min as the 5 min timeframe migrates to the next longest which is the 10 min above this chart so that process is already underway.

The 2 min HYG divergence is sharp both intraday and on a multi-day basis...

And as far as intraday timing divergences, the 1 min is also not looking good, like the market averages.

As we get more data I'll get it out to you so we can make some decisions about short term trade, as far as longer term core short positions, their not an issue, I have no problem continuing to hold them,  this is not the kind of move that is going to change or rescue the market, it's the kind that will eventually lead to a lower low.

Sharp Intraday Distribution Setting In

This is exactly why I don't trust these "V" bases, why I'd much rather see a "W" base.

Since the last update, take a look at the changes in the intraday charts, pretty sharp intraday distribution.

 IWM 1 min

QQQ 1 min, VERY SHARP!

SPY 1 min.

Ideally we'd see some sideways drift and some longer timeframe migration which would make for a great short entry. Right now, I'm holding back and looking to see what this is going to do, but that is sharp distribution, how far it goes and how fast will determine if it's tradable and how.

Market Update-A Rock and a Hard Place

I've already heard at least a half dozen references to the PPT (Plunge Protection Team) at work early this morning (3 a.m.) at the European open, while the official PPT is a US entity (a real entity created by executive order), the European Central Bank "may" or may not be playing their part as well.

While I don't really have an opinion on the PPT and the overnight futures stick save as they (SPX Futures) were falling about 20 points before the European open and the Reuters piece about the ECB buying Corporate bonds that sent futures rebounding (this wouldn't be the first time Reuters did something like this), only to have the Reuters rumor shot down by the Financial Times, I do have to admit that after last week's "Maybe we should consider QE4 " and "Maybe we should hold off on ending QE3" which was essentially retracted 2 hours later by the same F_E_D president, it does smell a little fishy.

In any case, that puts the market in an interesting place...
 The market was accumulated on the way down, now the SPX is a good 100+ points off its lows and above the trendline resistance of a Broadening top as well as being above the 200-day moving average they were clearly trying so hard to hit yesterday to only fall about 2 points short.

Speaking of shorts, sentiment is still overwhelmingly bearish, a lot of retail traders have been waiting for the SPX to cross the 200-day to short it, this isn't the kind of sentiment shakeout move I had in mind, but perhaps a new round of shorts being drawn in may change a few things, that's what I'm trying to determine now.

 This larger SPY 60 min chart shows what a solid base (August) can lead to. Eventually it led to stage 3 top and stage 4 decline, but a nice rally and we have a pretty decent one going here, but the base in this case doesn't have anywhere near the stability of the early August one.

Take a look at the same 2 bases again, one is a reversal "Process", that's a stronger base capable of holding and a lot more trustworthy, you can sleep at night knowing it's not likely to suddenly shift 50 points in the morning on a gap down.

The current "V" shaped base is an "Event, not a process, that's why I suspected we'd see more of a "W" base with a pullback which would make for a very stable base that could support a face ripping rally that would easily change sentiment from bearish to bullish, this one is a bit harder to trust.

The problem is we have about 2/3rds of the tank of gas we need, but only 3 tires as opposed to the last base in August with a full tank and 4 tires. The move above, right now is a TRUE counter trend bounce and I doubt too many retail traders will fall for it, they'll be looking to short it and that's not where Wall St. wants them.

There's some early deterioration, a bit in the IWM, but not quite enough to move to a fade trade (short the averages)...

As you can see the 2 min IWM is in line still, this can change in a hurry, but that's what it is for now.

Surprisingly the QQQ is showing more weakness than I'd expect, especially given AAPL and the way it looked yesterday, this needs to be watched carefully and we have some other problems in some leading indicators and in HYG.

I think the next position will likely be a full size short and we'll have to determine whether that decline is going to see the constructive pullback the market would have been better off with as the early overnight futures were headed that way. This is kind of a hobbled market that has support, it has the gas in the tank and you can move on 3 tires I guess, it's just not trustworthy, that deep "V" reversal is one of the scariest bases out there.

So watch that 200-day and action around the SPX's trendline pointed out, keep an eye on the NYSE TICK and I'll watch on my end, the downside trade just got a lot easier to take when it's time...

A.M. Update

Good Morning...

Overnight we saw chinese GDP data that was better than expected, but still bad and all kinds of talking heads interpreting it as meaning more stimulus from China when China has been very clear about their aversion to stimulus. Other than that and Coke blowing up its earnings via GUIDANCE, really the only thing that matters with earnings, the overnight was dominated by one thing saving Index Futures from this...
 ES/SPX futures from yesterday's close until 3 a.m. when Europe opened....

And replaced it with this....


On a Reuters rumor that the ECB will be buying Corporate bonds on the secondary market , which was rejected as pure rumor or fabrication out of Reuters by FT, that's where futures have stuck since the rumor was shot down.

At least this should make a decision about any fade trade a bit easier, but one foot in front of the other, lets see what the market looks like this morning....