Friday, March 14, 2014

Daily Wrap

Despite the main event this weekend, the referendum in Crimea, the US markets seemed fairly well pinned on an op-ex Friday and managed to stay in the last day's range while European stocks have seen the biggest fall in 9 months and Russian stocks are down -22% since Feb 18 and are in a bear market, the market hates uncertainty, all markets.

Kerry failed today at last ditch diplomacy while a US drone operating in Crimea was the victim of electronic warfare and crash landed right in to Russian hands.

Meanwhile, Russia is taking the referendum seriously which is and has been a done deal as they send in or pour in more and more forces, like this picture from today... one of many
Russia is clearly ready to enforce the referendum results, but in my view the prize is Eastern Ukraine as they made threats today based on what they thought was a pro-Moscow protestor being killed, which they used as a podium for pre-emptive action when it was actually an anti-Moscow protestor, it really doesn't matter, they are just waiting for the reason to invade the East , they don't need all of this equipment to hold Crimea when Crimean rebel forces are doing it on their own.

Where's the US and Europe? Making silly threats about costs that mean nothing to Putin, anything less than an aircraft carrier battle group and amphibious assault ships gathering in the region, Putin is ignoring everything as he can, he caught the US and EU off balance and moved quickly.

In any case, this is the weekend wild card event and I don't expect much resistance from anyone against Russia.

The US markets held up well considering the weekend events, they sold off in to the afternoon following the VIX, but strangely the VIX has a strong 5 min negative suggesting it moves down and the market up, not up enough for me to take long positions beyond some very small , speculative ones and that has nothing to do with Russia.

We also found out after last month's TIC data in which China sold the second largest amount of US treasuries ever, this week we saw foreigners selling the largest amount in the F_E_D's history, $104.5 billion on the week, just who is sanctioning who?

This may be a reason for the F_E_D to halt or slow down their exit from QE, which may be why the market is holding up better than other markets or than you'd expect.

As for other indications, Yields are intermediate disconnected negatively but perfectly in line with the SPX today, the VIX futures were leading the market by the nose...

VXX intraday vs inverted SPX...

And the VXX saw some late day distribution as did the 5 min VIX futures, you'd expect the opposite going in to the weekend.

HYG (High Yield Credit) , that market manipulating lever is still on deck and in position to ramp the market even though it has seen some deterioration over the week.
HYG 10 min positive and what looks like a head fake move that has already gone through the reversal process suggesting that the market makes a move to the upside very soon, say early next week/Monday (you know I hate dates).

It may work out if Crimea is annexed peacefully as I think the market has already discounted the fact that it's not up for grabs, it's Russia's already and the US obviously has no assets other than 1 guided missile destroyer in the area. However, if the Eastern border is threatened as there's a huge Russian build up, ALL BETS ARE OFF.

THE USD/JPY FOUND SOME SUPPORT AROUND $101.20 AS DID THE OTHER CARRY TRADE PAIRS, BUT THE LEADER STILL IS AUD/JPY.
AUD/JPY VS ES  today, there was a little more Es weakness in to the close, likely last minute profit taking on the Russian situation over the weekend.

AUD has found some support as long as it is leading and the Yen ...some distribution.
 Yen intraday distribution in to the closing hours and

the larger 5 min distribution.

It seems everything is in place for the market to bounce, it may do that on relief that Crimea didn't start world war 3 no matter how bad the outcome.

However as I mentioned in positions and positioning, other than taking time sensitive and fairly high profitable positions off the table for a potential bounce, I'm not ready to take much long risk at all, in fact I added no hedges/longs to the trading portfolio, just took gains in UVXY today.

We can't forget where we are...
 SPY 60 min off the last accumulation and now distribution cycle...

AND MORE DISTURBINGLY...
 DOW 1929 TOP...

DOW RIGHT NOW...

As for the P/L on positions closed today...

You can see why I wanted to protect the gains in PCLN which expires next week with over +128%

NFLX was about protecting gains at +25.5%


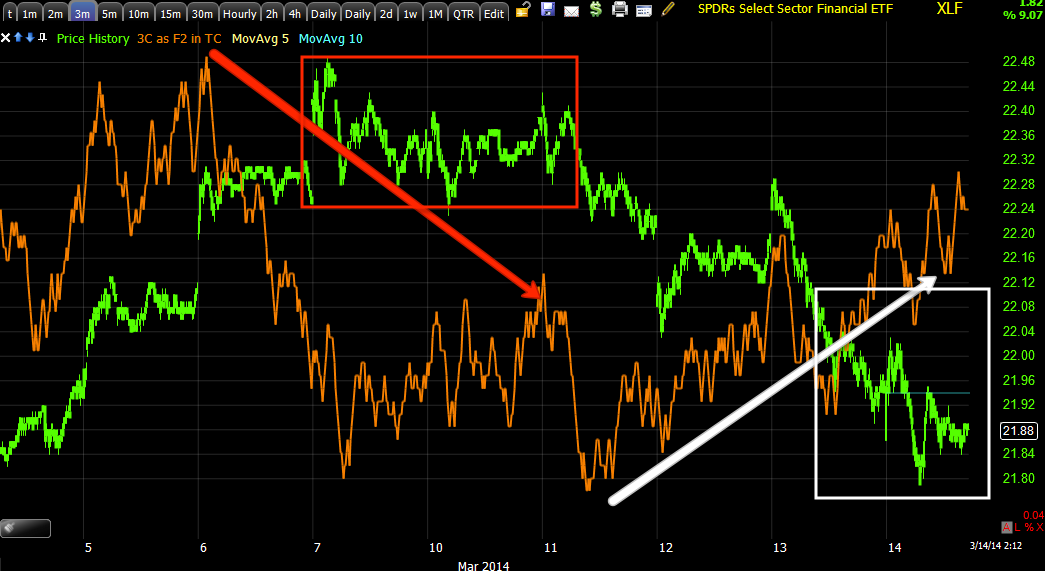
XLF at a nearly +46% gain


UVXY long equity at a nearly 13% gain


 March QQQ Puts expiring next week which were down about 90% at one point, I didn't think I'd get much better so I took the  31% loss

Overall or Options Tracking Portfolio (just tracking all ideas, not even run like a real portfolio as I'd never have so many positions diluting performance has come in with a 22.63% weekly gain ranking #7 of 720 competing portfolios, monthly at +11.89% and #30 of 1022 competing portfolios and over the lifetime at 289% and #39 of 1864 competing portfolios.


In any case I'm going to take a little day trip this weekend, the first in quite a LONG time, but I'll be monitoring events in Crimea Sunday and will have the Week ahead, but I expect we likely see a bounce and that should (as we have been looking for) give us a clear pivot signal to the downside via VXX and the signals there going positive short term on a pullback.

Have a great weekend!


Trading Portfolio Holdings

Although I entered some additional market correlated (QQQ) long calls, these are always very short term trades for me (options), as far as the core positions, that portfolio of tracking stocks is 90+% short, as far as the probably more relative trading portfolio which is run like a portfolio rather than a tracking portfolio, I have 70% of the portfolio positioned (market correlated) short to the tune of 70%. The other 30% is in non-market correlated assets like a short on natural gas and one on oil and gold, I find it VERY hard to close those equity (leveraged in many cases by 2-3x) shorts for a short term move, in fact I won't I'll sit through it if I have to, maybe put a hedge position in there, but as of now, I've left it just as it is and those positions would include:

SRTY, FAZ, SQQQ and SPXU all long (3x short the Russell 2000, 3x short Financials, 3x short the Q's and 3x short the SPY respectively), as I said, the other positions are pretty much non correlated to the market.

So to give you some idea of what I'm thinking even fairly short term (options trades for me are always the shortest term, often a day to 3 days), which would be along the lines of swing trades or a bit longer, I just can't let go of those positions considering what I'm seeing in the market.

So I hope it is clear that the VERY short term represented by a couple of QQQ call options is no where near how serious I feel about this market and how bad it looks, I don't want to close these positions that are meant to use to trade around areas like this, I just can't justify it.

DUST Long Looks Interesting

Earlier in the week I brought up DUST (3x short gold miners) as a long, but I had a reservation because support was so well defined in DUSt and resistance so well defined in GDX (gold miners), I said that according to our own concepts this is a high probability head fake move and minutes later it started that head fake move. Once started, it still needs a reversal process even though it's a good overall timing indication.

I like what I see, but once again, intraday it looks like it has some more downside before being the best entry, but I wonder if it's good enough, I haven't made up my mind, but I do like it.

60 min DUST as of the trade idea with defined support and then a head fake move, the volume hitting the stops (yellow) confirms the head fake.

 Since the head fake, a reversal process and 10 min leading positive.

And a 15 min leading positive, pretty impressive for a short term trade.

The problem is intraday doesn't look quite done, but looking at the bigger picture, I might be a little myopic on this and maybe should just consider it as a long.

Closed Trades and Some Ideas

As far as what was closed and opened today (only QQQ calls opened), here's why and you might see some longs that are VERY short term and speculative in nature because long in these assets is trading against probabilities, it can be done, but you have to understand that.

 PCLN distribution and now accumulation, not my favorite because the reversal process doesn't look complete, but a decent 5 min positive divegrence.


NFLX, I feel the same way, this only has a 3 min positive, I'm not interested, I'm more interested in shorting a bounce to fill out core short positions.

 XLF/Financials which could be played long with UYG long (2x leverage ) or FAS long (3x leverage) for a short term long, there's a decent positive and reversal process, still only 3 min though.

Last night I mentioned the XLF trade set up, it looked like this...

Because the longer term charts are in such bad shape like this, a short term bounce should be used to short financials in my view, whether puts, XLF short or FAZ long. Here's the recent post on Financials and the trade set up.

 5 min VIX futures with no confirmation, longer term they look great, short term they look like they'll come down, thus closing the UVXY trading position, you can play SVXY long as a short term play on this divergence.

I actually like SVXY for a VERY short term long short VIX futures trade as far as an equity position (long).

I "may" put that one in the trading portfolio just to balance out or hedge the shorts there.

 And of course the Q's 1 min leading even more recently today.

And the 5 min, you could play QLD as a 2x leveraged short term long trade or TQQQ 3x leveraged QQQ long.

Market Update, the 2 P.M. Tide Change

As usual on Fridays with either monthly or weekly option expiration Max Pain pins, the 2 p.m. hour is around the time that the pin is lifted as a majority of contracts are closed by then and the market starts to move differently as far as price, but it has always been the last 2 hours of 3C movement that have meant the most nessecarily pick up where it left off the next trading day, especiially over a wekend, but 3C signals almost always pick up where they left off even over a weekend, so that tends to be the important thing for us to watch.

AS YOU KNOW, I DON'T ENDORSE CHASING PRICE, we usually make position changes in directional changes at pivot points, often buying in to the lows and/or selling/short selling in to the highs as long as 3C agrees. So today I've been doing a lot of house cleaning and adding a few positions, but mostly protecting gains in time sensitive assets like options that expereince time decay. I think you'll notice that I have not entered many longs, in fact thus far just added to the short term QQQ call position so that should tell you something about what I'm expecting moving forward very near term and it should also tell you that the fact I'm NOT entering more longs or in greater size is a reflection of where I think the probabilities stand and how much risk there is in entering longs with the market so damaged. I may enter a few more or clean up a few positions depending on what 3C says, but most positions will be dealt with now rather than chasing price once it's too late and taking on way too much risk.

The SPY looks like this which is what was expected this week and very specifically yesterday from the signals and Leading indicators as well as the carry trades.
 That "W"-ish pattern or consolidation with 33C positive divergences tells me to expect some near term upside, however it's not so strong that I'm willing to take on much long exposure.

The charts in all of the averages have continued what they started yesterday, here's another SPY chart that could be a proxy for any of the market averages.

You can see the accumulation at the lows of this small, tight range.

I think we are very near and as such I'll probably continue looking at existing positions that are time sensitive in an attempt to protect gains and in select circumstances, maybe enter some short term long positions to take advantage of what looks like a clear stage 1 / accumulation base, although please keep in mind its size, it's not that big, but as always, WALL STREET NEVER SETS UP A CYCLE FOR NO REASON, THERE'S SOME REASON IT'S THERE.  I think part of it is the same as last Friday, the VIX futures need to drop to be accumulated short term as the long term looks fantastic and that should be the specific primary trend pivot with the market making a significant downside move.

A bounce here (if you are not playing it long) should be used to enter shorts or close longs in to price strength/3C weakness.

TO BE CLEAR, this is the best looking base we've had all week as they have been very weak and showing more distribution than anything, however it's really best used as a tactical entry for shorts on a move higher, IT IS NOT A CONCERN FOR ME IN ANY WAY FOR EXISTING SHORT POSITIONS, MANY OF WHICH ARE ALREADY AT DECENT GAINS.


Closing UVXY Long From the Trading Portfolio

The bottom line here is that I have been expecting all week a move lower in VXX and UVXY allowing them to accumulate short term and using that as a timing signal for the market. It is a VERY hard decision to make to close a VXX or UVXY (equity) long as the charts are so strong on significant timeframes and with the referendum this weekend, I imagine traders will reach for protection in to the close which would send VXX / UVXY higher, but I'm following the 3C signals and I need to open up room for dry powder as well as my expectations for the asset.

The signals aren't horrible in either VXX or UVXY, it's more the 5 min VIX Futures themselves that are warning short term while their longer term charts are also outstanding so I'll set price alerts for a pullback in the asset and re-enter long at lower prices which is a better entry and lower risk as well as allowing me to take some gains off the table.

QQQ Update

First I want to reiterate that the primary trend in 3C is very bearish, I want my positions largely aligned meaning short so about 80% of the portfolio is in line with underlying flow, the other 20% can be split between hedges, select longs or cash in my view, but in no way are any of the added call/long positions leaning toward a net long position.

I also don't see anything remarkably bullish like the Jan 27th through Feb. 6th positive divergences that led to the February rally/short squeeze, we don't have divergences in timeframes that long (the best we have now are weak 5 min vs strong 30 min in Feb and the best we have is about a day of accumulation vs a week or more in February). That being said, we are in a more volatile market and nothing moves in a straight line so if I had a small portfolio and transaction costs were a factor, I'd probably sit on my shorts and puts and not worry about hedge longs, if I had the time, the inclination, the ability to be nimble and wanted to cut closer to the bone, then some of these longs make sense to add some extra gains to your portfolio, big picture though it's a passing moment that is not of any real significance.

QQQ Charts...
 Longer term I've had some members mention a megaphone top, this is what I call a "Right Angle Broadening Top", however all H&S tops start as right angle broadening tops and later may morph in to a H&S top as a lower reaction high is made that completes a right shoulder.

There's a huge difference between the two tops as far as volume analysis, a H&S needs very specific volume confirmation to confirm lest you be fooled as many traders were in 2010 with what looked like a H&S top, but was missing volume confirmation. 

A Broadening top has erratic volume and needs no confirmation, it also tends to move either down from here and break the neckline (the volatility shakeout is a bridge we'll cross when we get there, but the same concept with a BA top as a H&S ) and often they will touch the lower support, make another run toward a new high or the upper resistance trendline and fail about half way there, then break through the lower support line (and once again pull a volatility shakeout). The H&S would be more common, but I've seen plenty of Broadening tops.


 As for the 2013/2014 trend and my Trend Channel, it gave a break or stop put at the red arrow, there was no other stop out in the preceding trend, it started right around the same time the carry trades were being entered around November of 2012.

As I have often explained with the Trend Channel, it will never take you out at the top, but it removes arbitrary stops or profit taking and allows you to catch the meat of the trend or the 80% easy money while tops and bottoms are very volatile and it's a coin toss, but after the initial stop out there is typically a volatility episode and a higher move can be seen, but in retrospect most of the time you are best off taking the initial stop out as the following top volatility is more opportunity cost and very dangerous for a rather small return vs the safety of the trend.

 The 2-day 3C chart shows distribution in to the 2007 top area and then massive accumulation around the March 2009 lows, this is about the time the F_E_D added to QE 1 which was late 2008 and was MBS purchases only, early in 2009 they added Treasury purchases and we got the Bernanke Put as primary dealers were being given risk free capital to put to work in higher yielding assets (stocks) as the F_E_D monetized the debt via the primary dealers.

The distribution cycles correspond with the end of QE programs and the 2013/2014 leading negative signals are the worst on record for the NDX just like the Dow is worse than the 1929 Dow right now.

The 4 hour chart also shows significant distribution, this is where "Relative Analysis" is helpful, seeing where price and 3C were at one point (A) vs the present (B), you can see we are in much worse shape now, that's the underlying distribution trend.

 The 60 min chart shows the accumulation area we knew would lead to a head fake/bear trap and a strong short squeeze rally from the Jan 27 to Feb 5/6th period as seen to the left, the distribution area is in a clear stage 3 top.

Here we see it again on a 5 min trend.

To really show you the change in character ("Changes in character lead to changes in trend"), the rally was from about 2/5 lows to 2/18 which was 8 trading days, about a trading week and a half and gained +6.57%, recently from the 2/18 period to present the Q's have LOST -1.14% over a period of 18 trading days, or nearly 4 trading weeks, that''s a MAJOR change in character and consistent with a stage 3 top moving to stage 4 decline.

 However the options trades in the Q's right now are based on short term charts, the equity shorts are based on longer term charts. This 1 min shows the accumulation from yesterday and a head fake move with a leading positive divegrence, it's only a 1 min chart, but unlike the rest of the week, this is the first time we have seen any positive migration among the timeframes.

For example the 2 min chart showing the divegrence has gained strength.

Or this leading 3 min, still not that strong and more likely a shorter term bounce at best, but enough for a hitch-hiking trade or to hedge some shorts, or I'd have no problem just sitting through it.

This is also the first time in a week we have seen any averages see a 5 min positive, this is why I increased the hedge capabilities with the Q's, it still isn't a large base and remember it's like gas in the car, if you only have a little it can only take you so far.


Correction-QQQ April $90

I said QQQ March $88 and adding to with April $88, it's actually 90, I confused the call with the $88 put.

Adding to the QQQ $88 Call / Hedge Position

Yesterday just before the close I tried to fill out the QQQ call / hedge position that was originally opened earlier this week with an IWM call position as well, they were both 1/3rd the size of a normal options position (position sizing) as they were only intended to hedge gains in the puts, many I closed this morning, I'll address that specifically in a bit so there's no confusion as my outlook hasn't changed much. As the week wore on I added a bit more to the hedge / call positions, yesterday I intended to bring the QQQ March $88 call to full size, but didn't get the position off in time.

I'm going to fill out that position, but as I normally do, I'm going to use about 2-3x more expiration time than I think I need which has served me well as I'll show you for our Options Tracking Portfolio Rank and Returns which is not at all the same as a trading portfolio as I'm tracking every idea put out and I'd never take so many trades at once because of over-diversification, still it's doing well.

Instead of filling out the QQQ call position (March $88) with next week's expiration which I'm okay with for the type of position it is, I'm going to allocate the resources that would be used to bring that to a full size position to April Monthly expiration instead so there will be March and April QQQ $88 calls, but as far as position sizing, the two combined will be the size of a single position.

I have considered doing the same with the IWM calls, but I'm not seeing the same strength in 3C signals there, if I do later then I may add to the IWM position. Keep in mind that even with adding to these positions the options tracking portfolio is still net short by quite a large margin, so these calls are acting more as hedges than outright longs or you might call them "Hitch-hiking positions".

I'll get QQQ charts up next, I have a lot of charts to get up, but right now it's more important for me to be tracking the market and making any adjustments based on new information coming in, but I will get a full QQQ update out as well as the positions closed earlier (P&L as well as charts).


More House Cleaning-Closing QQQ March $88 Put at a small loss

This was at a much larger loss, I feel with the decision to open some QQQ calls for the very short term (next week expiration), there's no point in holding the QQQ puts any longer.

These are option positions that I almost always use for very short term trades, this doesn't change the net portfolio positioning which is 80%+ short, but these are in the longer term core equity shorts or trading positions (equity).


Also Taking NFLX April $440 Puts off the table

This is a smaller gain and there's plenty of time left on the contract, but why sit through draw down when I can re-enter them at a better price when probabilities are increasing of a bounce.

Also Taking XLF April $22 Puts off the table

I do have significant equity short (including FAZ) exposure to financials, this is at a double digit gain, but it again looks to be losing some downside momentum and a lateral base/consolidation looks more probable, I'd rather re-enter them at a better price or just sit with the longer term equity Financial shorts.

Again, I'll have charts up soon.

Taking PCLN March $1350 Puts Off the Table

I'll follow up, but there's good downside momentum, a decent chance for a base and bounce and I already have the longer term core equity short in place, besides that there's a triple digit gain on options expiring next week.

Market Update

There are no big surprises in the market this morning, 1 min intraday steering curentsa are in line with an Inverse H&S being formed as well as a typical Friday Op-ex pin (even the weeklies). There is a bid in VIX futures that appears to be more retail than institutional this morning or it may be smaller positions, but I feel it's definitely protection on the Crimean referendum Sunday, however I can't imagine the market hasn't already discounted the Russian annexation of the peninsula, it's the Eastern Ukraine border that is and always has been the real threat and this is why Kiev decided not to split their forces and defend Crimea in the south and rather concentrated them along the vast eastern border with Russia, so there is some obvious nervousness over what is really a fait accompli.

 SPY 1 min with a 1 min steering divegrence intraday which could be a max pain op-ex pin as the market almost always hovers near Thursday's close until most contracts are closed around 2 p.m. and then we see some real movement, as always the price movement after 2 is virtually meaningless, I expect profit taking in front of Sunday's referendum, but as we have seen the 3C signals the last 2 hours are important for understanding the next week as Monday's charts pick up where Friday left off (3C not price).


SPY 2 min is leading positive, very impressive for what has been the 3C laggard all week.


SPY 2min we can see the inverse H&S taking shape, this afternoon it could be complete.


IWM 1min with the same positives from yesterday afternoon and steering divergence this morning to knock price down a bit which is normal for a "W" bottom and an op-ex pin (Friday).


IWM 2 min the same as above

IWM 3 min virtually the same as above.

I will say some of the 5 min charts yesterday were positive which is the first time this week, but they have for the most part fallen to "in line".


IWM 5 min with the exception of the IWM 5 min leading positive.

QQQ 2 min, the 1 min is in line, this is more of a rectangle consolidation thus far.

QQQ 5 min and there's a slight 5 min, nothing to worry about as of now.

As for VIX futures and short term futures...
 VXX 1 min shows the bid in VXX, but no 3C confirmation even on a 1 min chart.

The 5 min is still in line from earlier in the week, but the VIX move looks sort of parabolic and I don't trust those moves to hold

VIX 1 min futures with a negative divegrence, I see they are coming down intraday now...

And the 5 min shows the larger trend, distribution on this move up so I'm happy with what we have, it's just a bit slow going like the entire week has been