Wednesday, January 22, 2014

Daily Wrap

I'm going to try to keep this short and not pretend there's more going on than there is.

As far as the earlier post about Peter Worden and changes in character in the market, I had a couple of questions about what that means.

I'd say until about 3-4 months ago (and this was an exponential process so a year ago it was even stronger), there were two market characterizations, "Risk on" or "Risk off", there was nothing in the middle.

If you wanted to play a bounce or a decline, it didn't matter if you used the SPY (options, leveraged ETFS, etc), DIA, IWM or QQQ... heck you could use Financials or Tech, EVERYTHING MOVED THE SAME WITH VERY SLIGHT DIFFERENCES. The only question was whether the market was in a risk on or risk off phase. I recall (because of the way I had risk management parameters set so no one position could be more than 20%) I'd pick the IWM, SPY, QQQ and XLF and they moved the same. THIS WAS A CLEAR EFFECT OF QE.

Now, the markets are dispersed, look at today for example, the NDX was up +.28%, the R2K +.46%, the SPX +0.06% and the Dow down- .24%, that's quite a bit of dispersion, nearly 3/4's of a percent and today wasn't a big mover like some other days, this would not have been seen a year ago and again, it's directly related to QE.

Market Breadth has been a longer one stretching through almost all of 2013 with the percentage of stocks above different moving averages almost twice what they are now. That's a change in character.

Who remembers the VIX's never ending bottom, it moved to 6.5 year lows and never seemed like it would find a bottom than spent 6 weeks holding its ground when it should have been moving lower, that's a change in character. The Carry crosses were in clear uptrends since November of 2012, now we have broken those uptrends, that's a change in character and the Yen itself if definitely seeing a change in character. There are plenty more. These are small things generally, but they are changes for a reason.

As for tonight, the JPY Carry Crosses I highlighted in the last post with odd, deep leading negative 1 min divergences that popped up suddenly re still there in the AUD/JPY and EUR/JPY, not the USD/JPY, however the 1 and 5 min Yen charts are seeing their positive divergences incrreease so I'd like to see USD/JPY stay under $104.91 where some technical buying could take place as it changes the short term trend.

As for today, there's no Dominant P/V relationship which is not surprising given the dispersion in the major averages.
 Remember the SPX daily chart and the bear flag with what appears to be a Crazy Ivan shakeout? Now we have a bull flag, there's only 2 candles separating a bear flag from a bull flag, it's just an observation, I'm not saying or thinking it means anything until I see clear signals.

The Dow came out of a bearish Descending Triangle and put in a potential Crazy Ivan shakeout, it has a little range forming at resistance of the last week.

Sentiment is a bit unique today in that it has a clearer picture and a more bearish one as a leading indicator.
 sentiment vs the SPX is clearly negative today as it has been more inline lately.

 SPOT VIX (vs SPX inverted) is showing an outperformance today that's pretty clear.

Spot VIX also looks like it's quickly moving toward another Bollinger Band Squeeze, although the last one never really fulfilled the upside it should have shown.

 As posted later today, there's a real change in character in HYG, 3C was showing it and now it's appearing in price, here it is vs the SPX and we haven't seen this kind of underperformance in HYG is a while.

HY Credit as well (longer term view) also showing that same deterioration at the May 22nd Key Reversal day.

And finally (and this is probably the biggest story of the day)...
High Yield Credit still wants NOTHING to do with any risk on posture , however Investment Grade credit (flight to quality or safety) which was down yesterday is up today as traders have movesd apparently from risk to safety, I suspect it was down yesterday as they were entering it at better prices, I unfortunately don't have IG credit on my system to look at 3C.

What I'm saying about the last week or so (beyond carry crosses and the Yen), Credit has become the story and that's interesting.

Other than that, I'm still waiting for the clear signals that give us a sharp edge, VXX / UVXY, 5 min Index futures, carry trades trending down again, leading divergences like we saw today in the Q's and IWM which were quite spectacular.

All of these things can develop in a matter of hours so we need to be patient, be on our toes, you know when the moment comes we may have 7 -10 positions whipped out in an hour.


Something Brewing in Currencies?

I'm just doing my rounds and noticed the JPY pairs are undergoing some recent changes.


Look to the far right
 AUD/JPY (green arrow is 9:30 am EDT)

EUR/JPY

USD/JPY

It's not Euro weakness
EUR/USD

There does seem to be some $USD weakness or at least in the $USDX in 3C signal, but that doesn't explain the other two as the AUD and EUR are in line. The Yen has some activity in the 1 min chart that would seem to explain it, but this may be coming from a more important place.

The 30 min Yen chart which has been strong since the first day of the year, it remains so, no damage at all.

By the way, ES was pegged to USD/JPY today (AUD/JPY yesterday).
Yen above is a different story, I'll check on it later.

The Death of HYG Credit

We've already seen High Yield Credit and even investment grade credit take the plunge and credit has historically been one of the best leading indicators because that's where the smartest money is to be found, thus the mantra, "Credit leads and equities follow".

However the very liquid HYG (High Yield Corporate Credit) is one of 3 assets ties to market manipulation via arbitrage and algorithmic trading. 

You've no doubt heard of the SPY Arbitrage which is a way to move the market and create artificial demand, the three assets that are tied to an Arbitrage model are VXX. If VIX short term futures move down, computers (which do most of the trading these days) look at that as a lack of fear and money rotating from protection to risk assets and takes that as a buy signal. TLT (20+ year Bond Fund) is the second, it reacts in similar fashion to VXX because traditionally bonds have been a "Flight to Safety" trade, so if TLT drops the computers see that as money coming out of the safe harbor of bonds and rotating to risk assets (stocks or HY Credit) and Finally HYG (High Yield Corporate Credit).

Before the 2007 2008 2009 housing bubble and subsequent bank failures, Institutional money regularly used High Yield Credit as a risk asset or Investment Grade Credit as a flight to safety. The same way you and I borrow shares from our broker when we sell short and return them when we buy to cover, Institutional money went to banks and borrowed credit, but they'd diversify a basket of different credit products to create a position. After the banking crisis, banks moved quickly to scrub their balance sheets clean of credit and it became very difficult for Institutional investors to borrow credit in the size they needed as well as the diversification they needed to create a basket, then came the rise of products like HYG which is a very liquid, diversified High Yield Corp. Credit derivative that trades like a stock and instead of creating baskets, HYG was used instead. Thus, when computers see HYG moving up they assume  institutional money is bullish and the algos buy risk assets which is synonymous with stocks or futures, thus it became fairly easy to manipulate the market by creating the illusion risk was on (by VXX and / or TLT falling and HYG rising) or risk off (with TLT and VXX rising and HYG falling).

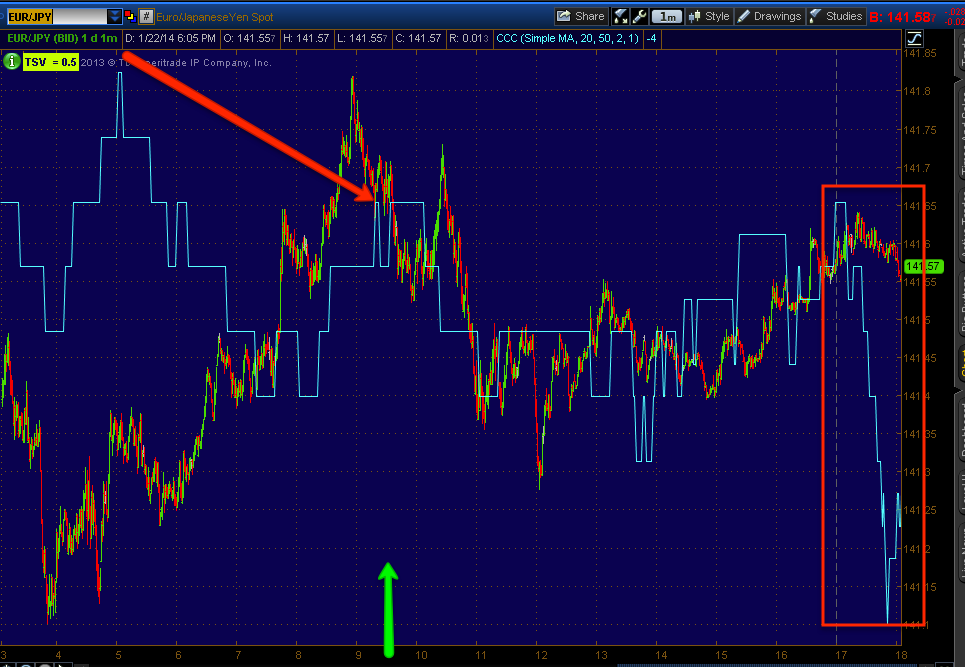
Something happened to HYG around May 22nd when we had that Key 1-day reversal that I said and still believe marked a significant change in the tone of the market and when we have the benefit of enough hindsight, I think 5/22/2013 will be understood for what it was, in any case, although this is not a fair job at scaling HYG vs the SPY, you can see Credit faltered on large volume at 5/22 and never quite recovered.
 HYG (green) vs SPY (red) and 5/22 at the red arrows, HYG credit crashed and never recovered.

On a $100 scale from the far left, HYG was moving up, then came 5/22 and it fell below $95 (on a $100 scale) and still has not recouped even the initial scale much less the highs.

However HYG has been used to some effect to manipulate the market in the absence of real buyers as can be seen in breadth charts in which 2013 sees the Percentage of NYSE Stocks Above their 200-day moving average over at 82% of all NYSE stocks at January 2013 to a low 44% in June and far from recovered even though the SPX has gained significantly since then to a current percentage of only 56%.

As for the 3C charts for HYG, this is why I was trying to open Put positions in HYG today, but they didn't go through.

 With significant divergences they'll almost always start on short term charts like this and then if strong enough, migrate out to longer term (the longer term chart, the stronger the signal) and then when they near the end of the distribution or accumulation cycle, the short term charts will once again go divergent as a timing marker for the actual turn in the major divegrence, that entire process is now nearly complete in HYG which is significant not only from an institutional risk perspective, although they really stopped taking real risk (looking for gains) toward the end of May, but even more so right now from a manipulation standpoint. To move HYG some kind of buying has to take place, even if it's not serious amounts, it would seem even the smaller buying used to manipulate assets is now considered too big of a risk and it's unlikely HYG will be effective in the near future for manipulation of the market or creating false risk appetite signals.

This is the intraday 1 min trend turning negative.

The 2 min intraday trend is solidly negative

As is the 3 min intraday trend in a large leading negative divegrence, in other words, in the red box we are seeing heavier than normal distribution.

I thought we'd see an intraday bounce today based on a flat trading range in HYG today and a positive 3 min intraday divergence, this wouldn't be a big bounce, but maybe a "Bang the close" type move, but it seems as the day went on that divergence failed.

The much more serious intermediate charts like 10 min show distribution in the same area as the intraday trend charts.

This 30 min chart doesn't have the detail of shorter charts, but makes the trends very clear and again, strong distribution as we have a leading negative divegrence (thus my wanting to open a Put position here as I feel the equity short alone doesn't have enough beta).

 And here is a cycle on the 60 min chart from stage 4 decline at the far left to stage 1 accumulation, stage 2 mark-up, stage 3 distribution that is leading negative and HYG is starting to roll in to stage 4 decline.

The Trend Channel (60 min) shows HYG maintaining the Trend, there's one close call that almost stopped out at the yellow arrow, but from the red arrow forward, about 8 bars, the Trend Channel is broken and has issued a stop out for this HYG trend. The natural progression from stage 3 distribution which starts while the asset is still moving up is to a flat or rounding-type top as it rolls in to decline or stage 4 which in Dow Theory on a Primary trend basis would be called a bear market.

In any case, while certain assets are still fuzzy, choppy and not giving great confirmation (which rarely lasts more than a day or two), HYG is giving a very clear signal and for this market that has survived on gimmicks like carry trades, Arbitrage and Weighted Index component buying like moving the Q's via AAPL buying AAPL or Carl ICaahn Tweets like today as AAPL represents somewhere around 20% of the NASDAQ 100's weight, this is one significant trick in their book that looks like will no longer be effective at the least, looking with a different perspective, you might even say that the minimal long commitments here are being abandoned as they are more afraid of getting caught long HYG.


UNG / DGAZ

UNG /  DGAZ looked like the perfect pullback (UNG) trade off a H&S volatility shakeout, however these recent polar vortices have been causing some havoc, even though UNG is my long term trade of choice (long) and I still keep the core position in place for trend trades.

UNG has had good signals, and the H&S top/break/volatility shakeout is such a common set up, it looked like DGAZ would be a very reasonable pullback trade (UNG pullback).


Over the weekend as the next set of these cold fronts were forecasted you can see Natural Gas Futures were accumulated as futures opened Sunday night for the new week, being the US was closed Monday, that created a decent gap up Tuesday.

The DGAZ position is causing too much drawdown for the trading portfolio, it's at 4% portfolio loss which is double what it should be.

My thinking as of now is that the weather is being discounted as UNG is up, tomorrow morning is the EIA Natural Gas report comes out, the best scenario would be a sell the news reaction as it seems the weather is already discounted. So I'll give the position until tomorrow to make that decision.


Going to fill out MCP Trading Equity long

The 2, 3 and 5 min charts are starting to see a vertical positive divegrence, no point in wasting any more time.

MCP Long (Equity) Follow Up

Truth be told, I'm probably being very myopic about this second half of the MCP position, I just figure if it comes to you then it's pretty hard to say no, if it doesn't, there's always another bus around the corner. I suppose that's somewhat subjective as far as upside expectations go or portfolio components and diversification.

Here's what we have...
 On a daily chart the last two days (today incl.) look like a bullish Harami reversal to the upside, today's daily volume is a bit lower than I'd like for that kind of a candlestick formation. One of the confirmation candles for a Bullish  Harami would be a Bullish Engulfing candle, for that we'd NEED a gap down tomorrow morning so it can engulf today's candle, that could be the move I was hoping to see today.

 I have the Trend Channel set REALLY tight, you can see to the left where the short/buy to cover signal would be and the current long and stop just below, the stop is on a closing basis, not intraday. This channel is WAY TOO tight for a reasonable trade, but I used it just because MCP's character in this area has fit well. If MCP were to drop below this Channel it wouldn't bother me, I'm just looking at it more from an entry perspective.

The more I look at the Harami set up, the more I'm biased toward just taking action on MCP.

 The 30 min chart looks great, I think the fractal "X" bottoms may be influencing my expectations (always try to be honest with yourself), we have a big one that formed the most recent base, after the pullback a smaller or mid size fractal of the same and today I suppose I was looking for the same with a move to yesterday's lows. Note today's 30 min chart is leading positive intraday (far right white box).


Intraday the 1 min chart isn't giving me a lot of reason to expect that pullback. The yellow arrow denotes a Tweezer candlestick bottom I just thought I'd point out.

The 2 min chart doesn't give me much reason to look for a pullback, in fact it has been growing stronger all day.

Only this 3 min chart has reason to expect a pullback, but since it has pulled back from the highs this morning, it's been leading positive.

This is a toss up, it depends on how bad you want it and where, I think it's fine where it is, you might get a little better entry, but overall, this is a great stock in my view and I'd want at least some exposure to it.

MCP Feb/ March $5 Calls

Yesterday I tried to get this order through and no dice so I'm going to try again right now, it's the same as yesterday, just the premium is a bit higher.

I'll show you MCP intraday as far as the equity side (long) goes as I'd like to fill out MCP (trading position) from the current half size position to a full size.

Market Update

It looks like HYG wants to try to bounce intraday, VXX isn't giving any clear signal, but with the pullback in TLT we saw coming yesterday, that may be enough to at least improve the SPY Arb. If so, that's where I'd like to look at a possible SRTY trading position.

HYG's bigger picture here is obviously not pretty and it has started to turn to the downside, but to the far right , that's a 3 min intraday leading divergence as it is down on the day, also note the flat price range through today so I trust that divergence, still no fill on HYG Puts, but if I could take another whack at them, it would be on a bounce (intraday) from this signal.

As mentioned, the 2nd of the 3 arbitrage assets, TLT has been showing signs of a pullback (commented on last night and yesterday)...
And there it is, it's not a bad signal, actually if you are interested in TLT long as I am, it's actually a blessing, but on an intraday basis, TLT down and HYG up is a risk on signal as far as the algos will read it.

We can see TLT isn't a serious downside signal and HYG isn't a serious upside signal, so it would be ideal if it did cause IWM to move up to use as a SRTY (3x short IWM) entry to get the best price and least risk.

VXX is the 3rd of the 3 arbitrage assets, it's not giving a decent signal here.

We'll see what comes of it and decide if and when we get to that bridge.

Market Update

There are still some signals I'm looking for, I consider this area to be kind of messy and almost untradable short term, but as far as trading positions set up, the only one I kind of wish I had that I don't is SRTY (3x short IWM/Russell 2000), the 3x short QQQ, SPY, XLF, etc are there.

Here are a few of the signals right now, they are intraday so more set up for day trading, but there are some extremes building in that have larger implications. First it seems the AAPL Bellwether was effective with the Q's when there wasn't the normal confirmation channels I'd usually use.

Take a look at what we have, I do like SRTY (long) here, but I'm pretty full. If I get a couple more confirmation signals like VIX futures, maybe some more damage in credit, 5 min negatives in Index futures, etc... I may just go for it.

 SPY intraday, a lot like yesterday, early distribution to afternoon lows and a bounce from there, now that's fading.

 QQQ 1 min intraday, but more interesting...

An EXTREME leading negative 2 min QQQ, watch the same in IWM below.

IWM 2 min intraday, no confirmation just as it was on the open...

 But back out on the same chart, the same extreme leading negative signal, this is the kind of signal that is hard to ignore. I'd just like some more confirmation in other assets classes.

And this very sudden bout of strong distribution on the IWM 3 min intraday, since I see the IWM is starting to make a U-turn.

Be ready for some quick positions if a few of those confirmation assets show up as quickly as these signals have.

IOC Trading Long Follow Up

IOC saw some draw down as a trading long, I don't recall how much, but it was more than I'd like to see. Right now it's down just over 1%, but it looks like it has done a LOT of work in creating a solid base from which to bounce from, I'm not sure I want to call it a rally.

 This is the daily chart, I didn't like IOC long as a knife catching play or even as a gap fill, I liked it because it had solid signals and I held it through the draw down because those signals remained solid.

On an hourly chart, talk about fractal, we have a larger inverse H&S bottom and the head fake move we first saw actually turned out to be the head of the larger pattern (no puns intended there). It's sort of a complex H&S with 2 shoulders on each side.

The top red trendline should probably be moved up to the $55 level as there's candlestick resistance there and it's a whole number/psychological magnet. I'd say stage 2 mark up is just north of $55.


The 4 hour chart shows heavy distribution just before the gap down and strong accumulation at the head fake/ inverse H&S bottom or head and it has stayed leading positive since on such a strong timeframe.

 The 30 min chart too shows where the real accumulation picked up, at the bottom of the base/head.

The 15 min chart shows the same thing, lots of accumulation of that low and we are still leading positive at the neckline which means to me, this is likely going to see a nice upside move thus I'm glad to have stuck with it and it's not in a bad area all things considered as a new trading position, not a trending position.


Thus far all of the recent upside has been confirmed or the signals have been accurate, this is the intraday 1 min

And the 5 min perfectly in line except 1 distribution point which was part of forming a shoulder.

If you are in IOC, I'd set some alerts above $55 for a break out to stage 2. If you are interested in IOC, this is still a decent level. Based on the price pattern alone, the move should hit at least $66, but I could see $72 before it ran in to some heavier overhead resistance.

AAPL Follow Up

This is not so much about AAPL (despite the Icahn tweet/pump today) as it is signals in the market because there are a lot of assets stuck in place that I'd like to see moving, take the Yen for example, but that may be starting to change.

In any case a little under an hour ago I posted I thought AAPL was coming down intraday and it would likely bring the Q's which look a bit parabolic any way down with it as it has so much weight there.

Thus far AAPL has come down... Now it looks like not only will the Q's come down, but the IWM too, if you are a day trader, you might be interested.

 AAPL's negative intraday divergence from earlier now sending AAPL lower on intraday distribution, Icahn selling in to his own tweet?

The Q's have a similar signal so it wouldn't be any surprise, especially with price a bit too vertical intraday.

This 3 min IWM leading negative just popped out of nowhere and it's pretty intense for that fast.

There aren't a lot of solid conventional / confirmable signals, at least there weren't this morning, sort of like yesterday. That may be changing.

Quick MCP Equity Update

Still no fill on Calls yesterday for MCP, nor HYG puts.

However the position I was hoping to fill out was an MCP trading position (Equity) however yesterday it just seemed too narrow, too much like a "V" if it were to take off on the upside from there so the half long MCP trading position has remained as such.

This is what I'm looking for with MCP to consider adding that other half and I think there's a good chance we get it so you may want to set some price alerts if you are interested.
A return near yesterday's lows forming a "W" like pattern. If or once we get down there, then it's a matter of confirming the signal again and obviously watching for a small run under the white trendline as a timing marker, but at least that would give us a more proportionate reversal process on this section of the pullback.