Friday, October 26, 2012

AAPL Not in a Place to Scare Shorts

In fact it's in a place shorts would be likely to pile on, I'll show you. There's also an interesting candle that looks like it will hold in to the close.

 There was some volume as AAPL crossed the $600 level as well as the intraday support level, most likely new or short term shorts covering.

 It's at the resistance of the triangle that shorts are divided from happy to scared, right below the resistance area they are happy as it appears resistance was tested and failed offering a better short entry, this is very old school Technical Analysis, as you saw with AMZN today, these levels are largely shaken out by moving price through the level and getting shorts to cover.

 I'm not sure if this daily closing candle holds up, but if it does, it's a reversal hammer on volume which makes it a high probability reversal signal.

 The short term 1 min chart shows a negative divergence at resistance in AAPL, this may be retail shorts, it may be for show to gain their confidence on a failed test.

 The 3 min chart looks nearly the mirror opposite of price today, that is a divergence and a positive one for AAPL as the 3 min chart saw the highest move at the lowest move in AAPL, there was plenty of volume/supply to accumulate at very favorable prices if you are running a shakeout move to the upside.

The 5 min chart is similar in its divergence.

There are several different ways this could play out Monday, perhaps  early weakness locking in more shorts, perhaps a gap up through resistance causing a short covering move off the open. All I can tell you is the probabilities with these positive divergences at break down/head fake areas are very high for an upside reversal.

Leading Indicators

Through all of this volatility, chop, intraday and day to day emotion a few things seem to be standing as fact: the range we were looking for early this week developed; several head fake moves that we would expect before a reversal in the averages and some key stocks took place; despite horrible earnings and really bad after hours reactions, the 3C signals that were strong on stocks like AMZN were vindicated so hopefully we'll see the rest of them move as they are hinting they will.

Stepping back from the day to day and intraday, the leading indicators for this week have all held up as did the longer term 3C charts.


 FCT as a leading indicator vs the SPX (all comparisons are to the SPX in green) is leading positive during this week's range.

 Yields are leading positive at this week's range area.

 The $AUD is also leading positive at this week's range or what might be considered the pivot.

 The Euro is also leading positive

 HYG Credit is the same

 As is junk credit.


In to the EOD today the defensive sectors are falling off, Discretionary, Tech and the momentum packed Basic Materials sector are all moving in to rotation.

Market Update

Here's both the short term charts for the averages and the longer term which essentially are about the size needed for the shakeout move we are looking for to complete this transition.

 DIA 1 min is still in line

 DIA 15 min has a longer relative positive divergence from the 10th/11th and a leading positive through this week with another move higher today

 IWM 1 min intraday negative which could also cause a consolidation.

 IWM 30 min leading positive.

 QQQ 1 min negative

 QQQ 30 min relative and leading positive this week

 SPY 1 min negative intraday

 It hasn't reached the 2 min chart so it looks like it's just an intraday signal.


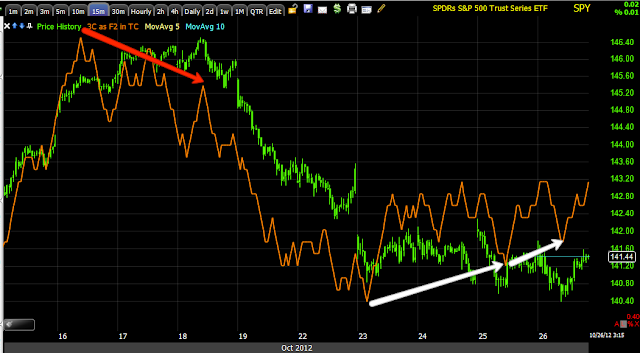
 SPY 15 min leading positive, the 30 min is positive as well.


Futures Update

The short term futures seem to confirm what I saw in the averages, the longer term futures seem to confirm the move up from this range. Here are several different timeframes between the two futures (SPX and NASDAQ / ES and NQ)

 ES 1 min is showing a negative divergence on an intraday basis, this isn't an important signal for the strategic view, it's just important for those that are looking to execute tactical positioning today.

 ES 15 min in the range this week from a relative positive divergence to a leading positive divergence, not only is this a significant timeframe, but the transition from a weaker relative divergence to a stronger leading divergence is a good sign that underlying activity is picking up and ready to move.

 NQ 1 min intraday shows 2 nearly equal price highs, the second slightly lower than the first, but 3C is leading positive higher at the second, it's only a small relative negative divergence that is a signal for intraday trade/reversal.

 NQ 5 min from a relative positive yesterday to a leading positive today.


NQ 60 min with last week's negative, the range this week with increasing higher 3C highs as price makes lower lows and what I'd call a leading positive divergence now. This is also a significant timeframe.

Signs of intraday pullback

We have some signals of a puullback or a loss of upside momentum from here. I don't see any very serious yet, but I want to continue to look.

I would guess any upside surprises will take place Monday as shorts still see this area as fertile ground to enter.


AMZN follow up

In yesterday's "AMZN Analysis" I posted this chart with the following commentary...

" On a daily chart I'm thinking that AMZN will pull a similar volatility shakeout as it did in early October, there just weren't that many shorts on a small decline like that to see any real upside shakeout volatility, we have it now with a larger top that HAS broken."

And today...
Today AMZN is doing exactly what I said I'd expect it to do, it's shaking out shorts with a volatility move, just look at volume today.

Thus far I don't see any negative divergences so I think it will go further, the market always surprises you in what you expect and how extreme it can be beyond your expectations.

Congrats to those who were able to get in to AMZN long positions/calls and hold through the after hours volatility. As I mentioned in talking about earnings, I didn't say, "We'll see toninght", I said, "We'll see tomorrow", smart money isn't making big moves in the thin, illiquid after hours or pre-market trade.

AAPL Update

These are the charts, remember I don't expect a long move in AAPL, just a shakeout. Yesterday I posted an idea of what I was looking for in AMZN on the upside and today it's a good way there.

 1 min intraday

 2 min leading to nearly a new high from these low is impressive.

 3 min trend is already leading positive, the added new leading high today just adds to it.

 5 min making a new leading positive high today

 A wider look at the 5 min

And the 5 min trend, also in leading positive position with a new leading high today

Added AAPL Nov. $610 Spec. Call position

I didn't want to as it breaks a rule, but I think the opportunity is just to great here, I'd rather it had been on a pullback though.

AMZN and 3C

If AMZN doesn't convince you 3C is showing you what no one else is seeing, I don't know what will.

Yesterday before the close I posted, "If I had Time-AMZN Calls"

As you know, placing trades is my last priority, the first is to my members, but after AMZN didn't do very good in earnings yesterday and was down as much as -12+%, by the end of AH, it was down maybe a bit over 1%.

Today AMZN is up over +5.5%

How is it possible that this could randomly happen, bad earnings, down over 12%, comes back and the next day the calls I mentioned yesterday should be up pretty nicely on a +5.5% gain today?

Here are the AMZN charts that prompted me to post that I'd buy AMZN calls yesterday before earnings came out. This is also why we wait for regular hours as the signals in 3C are fulfilled in regular hours.

 AMZN 2 min positive leading divergence

 3 min with a huge leading positive 3C divergence

 5 min with an extraordinary 3C leading positive divergence.

 10 min chart even was positive

Even the 15 min chart!

That's why, can that possibly be coincidence?


AAPL Update

AAPL may be offering a chance if you are interested in the spec long calls.
 1 min intraday pullback

The rest of the leading divergences have added to their leading position.

 2 min

 3 min

 5 min close up


5 min zoomed out

Some Important ranges

FXE/Euro breaking above the triangle

 AAPL above the psych level of $600

 DIA cleanly in the range.

 IWM back in the range


 QQQ back in the range

SPY back in the range