Thursday, September 25, 2014

Daily Wrap

I just have to say, I LOVE all of the reasons put forth as to why the market declined today from Russia shutting off Europe's gas, to the F_E_D's Fischer making the same comments he's made dozens of times before to what is probably more realistic judging by what we saw in to the close yesterday, a major sell program in at least 200 stocks, some moderators at TOS apparently say it was thousands of stocks, but I don't find breadth as appalling as that, even though it's bad today. The bigger point is breadth has been so bad this market has been a hollow shell for a long time and it just needed someone to give it a good knock to see how bad it would crack.

Our forecast for this week was for weakness Monday with accumulation starting for a short term move, by Wednesday morning I had said in the A.M. Update, "It's today or nothing" and yesterday the SPX made the largest 1-day gain in seven weeks. However the forecast for this week called for the dominant theme to be "DOWN", even as yesterday in the EOD post we had called for weakness today starting in the a.m. as 3C signals pick up the next day where they left off.

Today's losses were the stiffest in 8 weeks, volatility is clearly increasing which is something we see at transition areas between the 4 stages of a stock's cycle. We expected to be hitting stage 4 and I believe we are in stage 4 (DELINE).

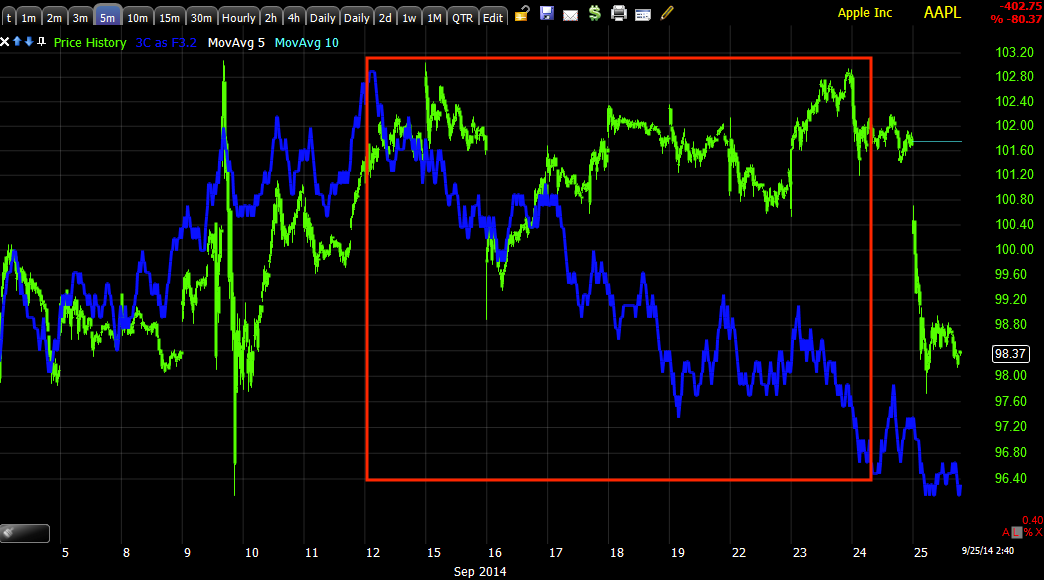
 I showed you in AAPL today the increasing ATR in a flat range in AAPL Follow Up / Position Management,  but the same increasing ATR is seen in numerous places as the VIX had the 4th biggest 1-day gain of the year to 16. The Dow Industrials have seen 4 consecutive days of triple digit moves...

The ATR which had been creeping at an embarrassingly low range with +0.10% moves being celebrated by retail as the market gained ground (clearly an unhealthy trend) is now increasing substantially. Check the trends and change in character for yourself. The DJIA...
The ATR swelled on an early decline in the year and then diminished as the market put in most of its gains for the year, this is the same as an increasing market on decreasing volume, a RED FLAg. However, the last two minor declines have seen the 4-day ATR increase substantially, a clear change in the market's character.

Word is that Treasuries and gold saw safe haven flows today and while that may be the case, this is not anything we haven't predicted in advance, in gold's case, GLD up +.29% today, I believe this is the base we have seen hints of in both GLD and GDX over the last week.

 GLD's downtrend is turning conspicuously sideways, basing while the 3C charts are showing a strong divegrence forming...

 In this context, I'm not sure I'd call today's gold move a flight to safety on a +.298% gain, but it's right in the range for base formation with some of today's moves in the $USDX easily responsible for the moves intraday in gold.

I don't think gold is there quite yet, but I think it and GDX (gold miners) will be soon as we have expected for months now on a pullback.

As for Treasuries today, especially the long end, everything that has happened is right in line with the 3C charts, of course their forward looking accumulation and distribution is based on something the market knows so I wouldn't say they didn't see safe haven flows, I'd just say, this market is set up and controlled a lot further in advance than CNBC would have you believe as they need you to tune in every day to understand why the market did what it did, that can't be taught in 30 second sound bites. Remember what CNBC does, sell advertisements.

 We predicted a pullback in TLT on 8/28, a pullback not a reversal and it did pullback and recently we called the bottom of that pullback and an advance. Just days ago we called for a short term downside correction which we saw yesterday so its ending today would not have been surprising no matter what the market did.

TLT's short term downside correction and continued advance (2 min chart).

As for REAL Ugliness, take a look at the S&P sectors which I showed on a longer term basis last night...

Today 9 of 9 were down, but looking at the longer term trend in these sectors ...

On a 1 day basis 9 of 9 are red, on a 5 day basis, 9 of 9 are red, on a 10-day basis, 9 of 9 are red and on a 21 day basis, 8 of 9 are red. This should tell you a lot about what's really going on in the market as the averages have barely moved compared to breadth, but just like any leading indicator, the market will move and in this case it is shaping up to be catastrophic which is what I've expected for years in calling this moment, "One of the greatest opportunities anyone alive has ever seen in the market " so long as you figure out the new dynamics first and aren't afraid to blaze a trail rather than follow the comfort of the herd.

Similarly, of the 238 Morningstar Industry and sub-industry groups I track, 223 of 238 were red today, on a 5-day basis, 232 of 238 are red, on a 10-day basis 218 of 238 are red and on a 21-day basis, 204 of 238 are red.

Suddenly it's not so hard to believe that nearly 50% of the NASDAQ Composite's stocks are in a bear market and 40+% of the Russell 2000's are in a bear market.

Speaking of...The Russell 2000 is now down -4.4% on the year and -9% since the July highs. The SPX, Dow 20 transports and NDX all broke their 50-day moving average today and all averages have now lost all of last week's knee-jerk F_O_M_C gains, another consistent concept proving itself.

I was a bit surprised breadth didn't look worse today, that's not to say it didn't look bad. Two of the worst were the "Percentage of All NYSE Stocks Trading ABOVE Their 40-Day Moving Average"  and the "Percentage of All NYSE Stocks Trading ABOVE Their 200-Day Moving Average"...
 "Percentage of All NYSE Stocks Trading ABOVE Their 40-Day Moving Average" nearly hitting a new low for the year with today's losses clear if you look close, currently standing at a paltry 21.5% and...


"Percentage of All NYSE Stocks Trading ABOVE Their 200-Day Moving Average". One of the easier ways I use to tech trend classification without going in to complete Dow theory was to use the 200-day as a primary trend, the 50 day as an Intermediate trend and the 22 day as a sub-intermediate trend, they are actually very close to down theory. According to this little annotated Dow Theory, the NYSE has more than half of its stocks in a primary downtrend also commonly called a bear market.

The Advance/Decline Lines were pretty bad as well, the NASDAQ Composite the Worst...
The Composite's A/D line vs the Composite now at a new low for all of 2014 and then some (Advance/Decline Line) and significantly dislocated from the Composite's price itself.

Most other breadth indicators had minimal moves today which was surprising.

As you saw in the late day Market Updates, it looks like the market is putting together a small corrective bounce, maybe to retrace part of today's decline, maybe more, maybe op-ex related, but any price strength at this point, in my view, should be for cleaning up long positions and getting your shorts in order. Even in a full-fledged bear market, we see about as many up days as down, the down days are just bigger.

Finally, the Dominant Price Volume Relationship tonight was Close Down/Volume Up, 19 Dow stocks, 79 of the NDX-100, 1125 of the R2K and 248 of the SPX. This relationship is typically associated with a 1-day oversold condition and the market "usually" closes green the next day, based on late day signals in 3C and leading indicators, I'd say it's definitely possible, however we are closer and closer every day to the fear factor when all funds try to fit out the same small door all at once like AAPL 2012 resulting in a 45% loss in 8 months. Keep that in mind moving forward....


Market Update Charts

A good portion of what I believe to be evidence for a bounce, although I wouldn't go very far in describing it as a bounce, more like noise within a broader developing downtrend, is primarily in Leading Indicators, in fact the 3C indications were just secondary confirmation.

 This is the new SPX/RUT Ratio Indicator I'm using in Leading Indicators. First I want to show you the bigger picture because it's the most important and how the indicator has responded ioin both calling a bottom/base at the August cycle's base (8/1-8/8) and then how it called the head fake move and how it is leading price severely lower like one of our other mainstays, HY Credit.

 However on a very short term, while new lows were confirmed this morning, since then a positive divergence has been building in the indicator, we saw it in an earlier post.

 Again, bigger picture HYG vs SPX through the August cycle, not only leading the bottom by a week, also leading the lateral stage 3 top , leading the stage 4 decline, even leading the head fake move from last week that created the "Chimney", but most of all, leading the market lower and significantly, beyond what you see here (I have this scaled for the August cycle, the bigger picture is far worse).

 However intraday , while HYG has done what we expected in leading the market lower this morning, it has also let up on the pressure by moving sideways giving the market some chance without the downside pressure.

HY Credit doesn't appear to be leading anything to the upside, it's the fact it hasn't made a lower low since yesterday , it's a sort of passive leading, without having to take on any of the long risk.

 As for the August cycle and bigger picture, HY Credit led to the downside in late July (SPX-4%/RUT-8%) and then led with a positive divegrence at stage 1 (8/1-8/8) and bigger picture called a false move or head fake move at last week's chimney we had been expecting. Again the point is the bigger picture is where the juice is. Our last major position entry was at the 8/1-8/8 base (longs or cutting back shorts which have since been added back). This is the next major positioning area since the first week of August for the next major trend which has been thoroughly described for a while as, "DOWN".

 Interestingly out leading Professional sentiment indicators came alive this afternoon, they have been spot on and are leading positiver for a short term move.

 This is the second one we use as confirmation, it too shows the same short term bullish and I mean short term.

 Again, the same Leading Indicator on the big picture chart has the same leading negative in to late July and at stage 3 of the August cycle, leading lower like so many other indicators and 3C.

 Yields have been working recently as a short term leading indicator as we have typically used them, they led the market higher, lower and now have a small leading positive a bit higher.

The SPY 2 min has a positive divgerence through it which looks pretty impressive, but remember the timeframe of 2 min.

The 3 min is seeing migration and confirming, but again remember the timeframe.

And the SPY 5 min, this is migration of a divergence started today.

QQQ 1 min

QQQ 5 min also suggest near term upside,  unless a bigger base is being built, but I doubt it based on leading indicators.

And IWM 3 min is leading intraday.

As I said earlier, this could be for a number of reasons, we have one reason to use short term price strength.

Quick Market Update

Whether it is op-ex related or finish filling the large sell order that began today on a downbeat as expected yesterday in to the afternoon, or the copy-cat orders as hedge funds on Wall Street herd together just as much, if not more than retail... from my perspective, the market is going to try to mount a bounce from these areas. I'm putting the charts together, I'll have them out next.

This really is nothing but good for us unless you're already totally filled out and ready for the next major pivot, the last was on 8/11 and the set-up time was 8/1-8/8.

AAPL Follow Up / Position Management

Yesterday we entered a half size AAPL Core short position, Trade Idea/Trade Set-up (longer term-intermediate trend trade) AAPL

Looking at AAPL today, down -3.33%I have the same feeling as yesterday which was not the stellar entry as far as a head fake move, but the deterioration on more serious longer term charts and longer term signals or rather larger, highest probability signals, is getting so bad, I don't think there's a lot of time to get the AAPL short position ready.

I would not enter AAPL short today as it's down over 3% and we don't want to chase anything, but let the trade come to us.

So far for today, here's what I see and my plan for the very near term to fill out this short position.

 The link above from yesterday contains more of the charts I'm talking about as well as a link to another update with even more charts so I don't want to repost too many in 2-days.

The Trend Channel has given a stop out signal and just as important, the ATRover a weekly period has nearly doubled in a price range that is chopping sideways, increased volatility, but no price gains. We want to see higher ATRs on an uptrend, but in a lateral trend, it wreaks of distribution and topping.

The 15 min chart which has been key to recent interest and entries looks worse today than yesterday which is confirmation of the price decline rather than a divergence of buying the dip.

The 5 min chart has been calling for exactly this kind of move and it too is confirming the downside as being authentic trouble.


I don't see much that suggests AAPL should head higher except for the gap which have a high probability of being filled and the increasing volume on the day.

"If" volume increases noticeably more and the closing print is up near the red arrow, we'll have a short term reversal candlestick and the higher volume will make that a high probability reversal and the gap in the orange area would be filled. If we don't have at least a bottom wick between 1.5 and 2 times longer than the real body The open to close in the red block, the probabilities of this being a near term reversal candle are low.

I'd set alerts in the gap area for AAPL and I'd likely be happy filling the position out in that area, although something higher would be nice, I just don't see how AAPL is going to get there from here as of now.

NFLX Short Set-Up

It has been a week or so since I last covered NFLX, I think this Sept. 4th post is the most useful reference, NFLX Looking Very Ugly Here. Since, NFLX is down nearly 6%. I have already filled out a longer term core short position in NFLX so all updates are for your purposes regarding entry or trade management, in other words I likely won't issue any new "Trade Ideas" that are action events I take in placing them in the tracking portfolio at that moment.

The white arrow is Sept. 4th's update, even the trendline is from Sept. 4th, we were looking for an entry above that trendline, a head fake or failed breakout which we got at the red arrow, this is why I always advise to set price alerts.

 Since Sept. 4th and the next entry, NFLX has trended lower in lower highs/lower lows.

Big picture, I'd take NFLX anywhere in the area, I actually have the position that was phased in to averaged in this area, however this is one of several stocks that looked like it could bounce a little higher than it is right now, not necessarily a new high, but a better entry.


 Here's the daily 3C chart, a lot of strong distribution in NFLX and a price pattern that I believe is similar to a broadening top.

 The 4 hour chart confirms the weakness, this is the kind of chart I don't ignore which is one reason NFLX has been a long term short set up favorite.

 The 2 hour chart also confirms the distribution from the last rounding bottom/accumulation creating a higher high. The 609 min chart and others also confirm, but I think we have enough strategic confirmation to call this a nice longer term short position, now it's the tactical entry.

 The 10 min chart is one of the longest timeframes that suggests NFLX could bounce although some market cooperation would go a long way in helping it do that.

 This 3 min chart which has a positive divegrence this week just like the main averages did since Monday, still suggests some near term upside, that's what I want to short in to for a new or add to position.

The 1 min chart for today shows there wasn't that much damage done and probabilities still point to a higher move so if you like it, I'd set price alerts,  just remember, longer term anywhere in the area is a great entry so anything better than where we are today is an even better entry short NFLX.

For now the daily Trend Channel is rtracking the Swings, that would suggest a bounce would likely hold up around the $460 area so you know where to set alerts to, although with the divergence it could move a bit higher.

This in my view is either a short here and now or you can wait to see if it comes to you in which case, if it doesn't, no harm no foul, you just move on to the next opportunity or the third possibility is phasing in to the short with a partial position i the area and add to it on any subsequent moves higher so long as your risk management reflects that plan.

I do love NFLX as a long term short position though.

Market Update

Hopefully the developments taking place now will make my day a bit easier as far as positioning which I want to do in to price strength, although bigger picture we are still in a great overall area for short sales in many assets, especially SPY/QQQ/DIA and Financial related shorts.

As we already know, yesterday's late day divergences suggested weakness this morning, our forecast for this week suggested about a 1-day bounce in which the SPX saw the best daily gain in 7 weeks yesterday, this (in our forecast for this week last Friday) was to be followed by the Dominant Theme for the week, "DOWN".

Whether we get this bit of help or not, there are always opportunities, this just opens up more opportunities.

This is what I see thus far after what is being reported as 200 to several thousand stocks sold this morning on a massive sell program. The danger here for the market (not for those of us already largely short) is that fear breeds fear and a massive sell order can create the AAPL effect, that time in 2012 when all hedge funds stampeded for the exits at once. This is why I said yesterday morning, "The market needs to bounce today", if it had not, the probability that we were reaching that kind of mass institutional panic would have sky-rocketed. No matter  how smart smart money, they are still restrained by the size of positions and how quickly things can turn on them.

As all longer term analysis has shown, we are clearly transitioning to the next stage, 4 decline.

 Our custom SPX/RUT Ratio is showing its first positive divegrence I believe of the week, although on a short term timeframe, it's along the lines of what short term charts are starting to show.

Such as the DIA 1 and 2 min inrrtraday positive divegrence

 QQQ intraday positive divergence.


 SPY intraday positive divegrence

 Whether this week's SPY 5 min positive divegrence can hold up or not at this point remains to be seen, it will depend on how strong, long and fast the intraday charts develop, however I would not count on this as anything more than very short term as has been the forecast since Friday for this week.

The TICK which took a beating at -1500 and worse for a god part of the morning is trending higher, although in a very wide range still hitting -1000 and yet to break to +1000, however the trend has changed.

And the same TICK trend is visible on our custom indicator showing yesterday;'s late afternoon deterioration and this morning's as well as the upticks taking place.


Higher prices simply make for better entries, however nothing has changed about the major component of the forecast which was confirmed by breadth not moving at all last night on the best 1-day SPX gain in 7 weeks. This market is ready to pivot to the downside and just as we wanted to enter long/piggy back trades in early August before the trend up, this is likely our last chance to enter shorts (in size-again, there's always an opportunity somewhere), before the stage 4 decline that HYG is leading sets in.


Market Update

This morning is actually quite interesting. Last Friday's forecast was for Monday weakness and a positive divegrence in to that and a short term bounce to follow, but the main theme on the week was DOWN.

This is interesting because the divegrence as you saw yesterday, last night and this morning, did form, it wasn't very large, but enough to get the strongest SPX move in 7 weeks underway yesterday which we could see as of yesterday afternoon, was going to see some weakness thins morning.
Yesterday's continuing positive sending price higher in to a negative shorter term divegrence on an intraday 1 min chart through the last couple of hours of yesterday and this morning's activity.

Word on the street is that a large institutional investor dumped over 200-stocks this morning on a massive sell-order. My gut feeling is that order was given to the market makers and specialists who'd be executing it as early as yesterday afternoon and they were selling in to higher prices, thus the shorter term negative divegrence in to the last 2 hours of yesterday and they likely forced the rest through this morning, however, this is almost exactly what last Friday's forecast was and even last night in the Daily Wrap I had said whatever yesterday's move was actually for, it wasn't to correct the massive breadth deterioration as there was no movement or improvement in breadth.

 In any case, that still leaves us where we are and how we want to proceed which also depends largely on how the market and underlying trade develops.

The SPX broke it's 50-day on this morning's dump, my gut feeling would be they'd want to encourage retail to buy the dip and send the SPX back above the 50-day...
SPX daily breaking the 50-day.

As for the other averages this morning...
 IWM 1 min

QQQ 1 min

DIA 2 min...

They look like they want to bounce higher, although I'd normally expect a sideways process before that could happen, in this case I might make an exception.

I figure if there's an institution out there that big dumping that much at once, they likely have more to go and their action is going to create a reaction among other institutional / hedge funds.

TICK is "trying" to improve, but it saw a massive all out dump at -1500 or worse through almost the entire morning, it's struggling just to get above zero.
The TICK trend deteriorating yesterday afternoon with 3C and this morning's wreckage, most of that is sub -1500.

I think the bottom line, no matter what happens from here is the same as forecasted last week for this week, the major theme is weakness and to that end, although I'll be watching any new positive intraday divergences try to develop or develop, I don't think we can let this throw us off the path of action for this week and that's still looking for the best candidate and getting positioned for the next major swing...DOWN.