Thursday, September 19, 2013

Daily Wrap & Video

*At the bottom of the post there's a video.

So today the biggest surprise for most would be the lack of follow through.

Early today we identified a range, I suggested 3 likely scenarios with the most likely being a bull flag and the market formed that bull flag a few hours later and I explained why a bull flag and what I thought would happen. We didn't see if complete today and tomorrow is a monthly op-ex Friday so I'm unsure how that will effect the market, but there is a continued divergence moving toward that breakout move I suspected we'd see if a bull flag formed as it did.

Toward the end of the day it was more than clear that even thought the market was trying to make the breakout move exactly as was posted before the bull flag even formed, it was struggling significantly.

The question I still have and the issue that I believe influences the market the most going forward, thus making this Non-Taper event a non-event regarding the bulk of our analysis an expectations is the same as yesterday:

What is the F_E_D so afraid of?” and if the F_E_D is afraid of it, the market should be terrified of it, because the F_E_D lost something yesterday when they put the taper on the back burner and that's namely trust. I have heard from so many of you and received email links to articles and they all come down the same line as this which was put out by Credit Agricole today,

"(The) market is in a state of shock" after the Fed's decision to postpone the taper, adding that "Fed credibility and its communication strategy are in tatters."

In other words, the F_E_D lost the market's trust which it will really need when it comes to the date in which rates start to rise. They also look to be flying be the seat of their pants and many major Wall St. players may be asking, what's to stop them from doing something similar on rate guidance? How can we trust their word?

Bernie pointed out that he never said there would be a Sept. Taper, but lets be honest, in June half the members saw QE3 ending before 2013 ends and it's a 6 month process, “Several members” wanted to start at the June meeting.

It's similar to the time the F_O_M_C minutes came out and they were very hawkish (meaning unfriendly to QE) and the market responded poorly, Bernie used a speech engagement later that day to say that the F_E_D will not be stepping back from “Policy accommodation” anytime soon. I commented that day that he was using, “Plausible Deniability” and being purposefully ambiguous to let the market interpret that any way it wanted to and it took it as to mean that they would not be as hawkish on QE as the minutes from the previous meeting that were released earlier that day had made clearly stated. Later Bernanke came out and said that when he said that, he meant “When they raise interest rates because keeping interest rates low was policy accommodation, so exactly what I said that day was 100% correct, Bernie was purposefully ambiguous by using the term “Policy accommodation” and given the market hated what the minutes said, the market took what he said and interpreted it the way it wanted to, thus Bernie was using “Plausible Deniability”, it's an old political trick, to give people the impression you are doing one thing and then being able to say, “But I never said that, you inferred that, I just said...”

Here are a few excerpts from Phoenix Capital, I don't agree with their conclusions, but I think a lot of what they say is right on and is what I said yesterday, my notes will be in red.

The Fed failed to announce a Taper yesterday of any kind.


It is positively outrageous, but it does inform us of many things. First and foremost, the Fed has made it clear that it cannot be hawkish is any way.(I believe this statement is their own bias, the June meeting minutes showed clearly the FED could be hawkish with several members wanting to end QE at the June meeting and half the members seeing it completed by the end of 2013, I don't think the issue has anything to do with what they can or can't do as far as hawkish/dovish as they admit in the next sentence, I think it has to do with something VERY dangerous on the horizon) We had just two months of hinting at tapering QE from the Fed.

So for all the talk of taper and shifting to a more hawkish tone, the Fed’s actions speak louder than words: the Fed is totally and completely incapable of being hawkish at this time. (Again I think they are terrified by something and if they don't communicate it to the market soon, the market will start discounting the uncertainty with sharp sell-offs, as things stand, nothing makes sense to anyone, let a nervous market come to its own conclusions about what is scaring the FED and it may be worse than the reality)


Secondly, the Fed knows that the US economy is a total disaster. (As I said yesterday in the context of QE being completely ineffective) If tapering even $10-15 billion per month from $85 billion month QE programs would damage the economy, then we’re all up you know what creek without a paddle.(Again, exactly as I said yesterday with a much lower taper target of $3 bn in treasuries and $6 billion in MBS, this would have kept the market's trust, likely have no bad effects and serve as a test balloon and serve as a statement that they will proceed moderately and thoughtfully).

Put it this way… here we are, five years after 2008, and the Fed is stating point blank that the economy would absolutely collapse if it spent any less than $85 billion per month. This admission has proven just how long ago we crossed the Rubicon. We’re already in the End Game. Period.(As you know, I've been saying virtually the same, “We are not close to the big picture, we are in the big picture” and this is based on charts, not the F_E_D or my view point).

In plain terms, the Fed has proven beyond even a hint of a doubt that it is simply flying by the seat of its pants, with no clear game plan or eventual outcome in mind. The Fed is simply going to keep doing what it’s done for five years until something breaks.(Again I think this is just their personal filter, I have said for over a year after listening to former FED governor, Kevin Warsh, that “Entering monetary policy is simple, it's exiting it that is very difficult” so perhaps there's some of that and I think when the FED talked about weighing the cost and benefits, the “costs” they were talking about were not balance sheet expansion, they were exiting policy and the costs are so high that this is a large part of the reason they were looking for an exit).


That something will be the entire financial system. We will have a crisis that is substantially worse than 2008. It is coming. In fact it is now coming much sooner than it would have had the Fed announced a taper yesterday.”(Agreed, but this isn't a recent revelation; I did a 5 part video in 2007 before Lehman that essentially said that at some point we'll have to take our medicine and when we do, I could easily see the Dow at 5000)”

So again, the F_E_D really lost something and from the number of articles I've seen since yesterday from many of you, it's clear that almost all of Wall St. feels the same way as Credit Agricole. For the purpose of analysis and not just conversation, the first question I asked yesterday and the one I imagine the market will be reflecting very shortly is, “What is so bad that they'd lose that kind of credibility when the taper was a small amount, almost meaningless”? That alone may be more damaging to the market than just coming out and saying what it is, you leave the imagination to its own devices and you can get some pretty spooky stuff.

OK, so you know that yesterday I closed Gold and Gold miners because I felt that yesterday's momentum would likely not see follow through today which was objectively based on the charts, I even considered the IWM short, but decided it would be best to see futures overnight, which were as I expected, horrible. Then I wanted to see regular hours, now futures look like this which started yesterday at 3 p.m. on a 1 min chart, by last night they were clear on 5 min charts and today after regular hours...

 We went from really clean 5 min negative divergences last night to clear 15 min negative divergences this morning like this R2K Futures chart...


 To very strong and fast developing 30 min negative divergences as seen above is SPX futures and below in NASDAQ futures.


 NQ 30 min


All of the Index Futures have negative 60 min charts, but they were already negative which would mean that distribution started as soon as prices started moving up.

To understand this you have to differentiate between how we trade with a single order to fill our position to the way they do, they have large orders that would be crushed if they put the entire order out at once, predatory HFTs would target them, other Wall St. firms would try to corner them, it's an art to get in and out undetected and they need, Demand and volume and this is one of the big reasons head fake moves are so common, they serve a purpose, it's not just so "Evil Wall St. can get your money".

I told you last night that among assets seeing distribution, much to Bill Gross's disappointment after his victory lap yesterday (PIMCO), 10 year $UST retraced 1/3 of their gain and 30 year's retraced 50% of their gain and thus there went some of Bill's profits.

The 10 and 30 year at the 60 min timeframe don't look that different, the 10 year UST futures retraced about 33% of yesterday's gains and the divergence clear on a 5 min chart last night is now clear on a 60 min chart after having been perfectly in line with the uptrend.

It may be a little premature to use a 60 min chart here, but you can at least see migration in the $USDX as it fell hard on no taper and is seeing accumulation as well as price gains.
$USDX 60 min

In addition, the AUD and Euro that gained on yesterday's no taper, both have  continued, 30 min negative divergences as well, the Yen is about in line so these also saw larger negative divergences.

As far as sentiment, they were split, HIO was leading the SPY which for the short term move I expected to start today and we saw plenty of signs, that would make sense and FCT was in line with the market so I think the assumption I had made about a bull flag and there's only 1 reason to have a bull flag (remember we started the morning with a rectangle) and that reason would be for the upside breakout I said I thought the market would go for as a part of multiple timeframes doing different things, but all moving toward the same goal, which I'll try to show you what I mean.

As you saw earlier, yields in the magnetic  5 year dropped below the SPX so again as I said today, that will be exerting downward market pressure, as well as accumulation in the $USD and a move higher.

Both GLD and SLV look like they are closing in on a strong short signal, both are kind of in a range so the same market head fake higher above today's range, would likely benefit them as shorts as well.
 GLD 5 min, the range is getting noticeable, but the probabilities now are leaning strongly toward a short position.


SLV on a 3 min isn't quite as far developed, but I think it will get there.

So as far as the NUGT position and how I described it in this post....and in particular, this chart...
I would say the charts above make the red line scenario more likely, in fact a probability, so NUGT can still be sold at additional gains, maybe even strong ones, but I do think the probabilities are that it will have to be sold as I feel 3C will follow the red line example.

As far as VIX Futures today, the months of October and November were in the green column almost all day and closed that way, yet the VXX was red, can you guess why? Remember what I said about today's expected process or at least the start of it which I'll try to clarify more, if we need the SPY arbitrage to push the market up because there was no follow through at all today, then the VXX needs to be down relative to HYG, but that doesn't stop protection from being bid up in the Oct. and Nov. futures.

Other features of the day included High Yield Credit underperforming the market again, HYG saw distribution on 3C which is something new since the start of the accumulation phase. Crude did exactly as expected, which was a move higher in to a chop zone as it was up (USO) +2.49% yesterday and down -1.55% today.

Perhaps the most surprising element to the day was a complete lack of follow through, strength usually begets strength, orders rack up overnight and we get follow through, but we didn't today with all the majors closing red except for the NDX closing up 1/5th of a percent.

This is not to say we won't get another move higher, I don't think it will be anything substantial or sustainable, if you read my market analysis today, it would bee (unless charts change which I doubt), exactly what I described today and we saw all of that start, the rectangle turn in to a bull flag, the intraday accumulation of the averages for the move higher I was forecasting, but again, this in my view is just part of a larger process and not a bullish trend forming.

Most of the averages looked like this by the close...
 We went from the rectangle in white which isn't as bullish as a bull flag, to the parallelogram you see that forms the bull flag that I thought would happen and happen for one reason which would need accumulation on intraday charts as you see at the white arrow and even got extra help from the SPY Arbitrage as I showed you.


The more important chart, 5 min is clearly negative and any upside (I know this sounds counter-intuitive), will simply help the downside move.

And there's the SPY arbitrage painstakingly maintained all day to help the market, where would we have closed without this and short term cycle support?

If it's the move I think, I don't really care how strong it is because there were certain stocks on the short list today that need a stronger market move to get in to prime position. There are others that are in position and anything else is a bonus.

So these stocks will be on the radar and closely watched.

Tomorrow is a monthly Options Expiration that will likely be pinned, I'd think that may interfere with the market cycle, but if accumulation was started in intraday charts as you saw on the SPY above, it's either to make the move tomorrow or to perhaps keep building and trying to go for it Monday / early next week. I still have more charts to collect and se how they develop, but they have been moving in a clear direction so I really don't think the Non-Taper Event was as helpful of an event as most people think and I do think it is highly likely that Wednesday was the Knee-Jerk move we often see, which means it's a short term anomaly that should be reversed soon and where we go from there, well I think we still have to stick with highest probabilities and I think the question of "What the F_E_D was scared of?" will start causing more and more worry among market participants unless they already know and that's the reason we have charts like this which is where the probabilities are.
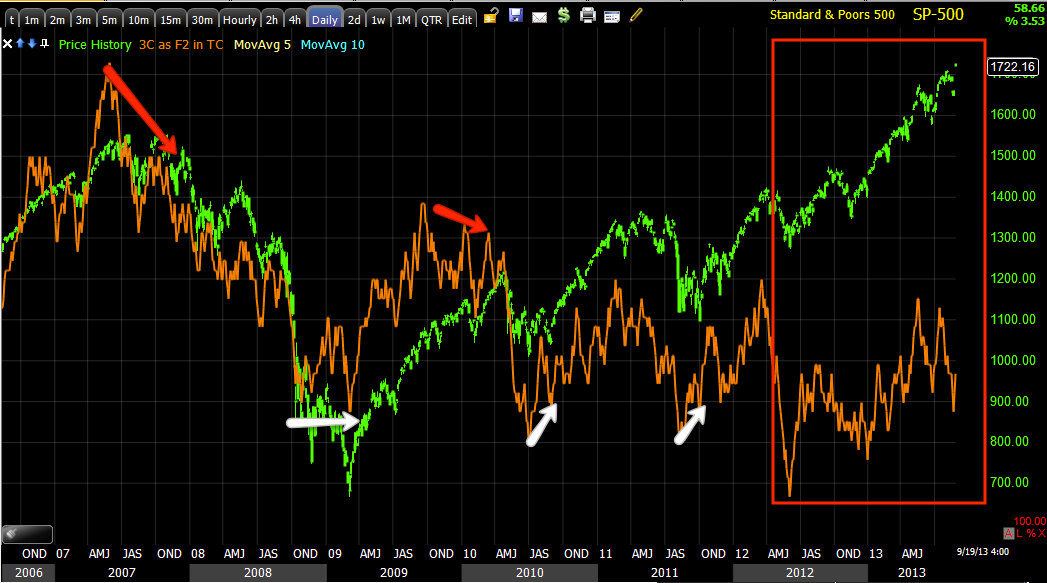
SPX since the 2007 top, a virtual house of cards made of liquidity that has to be yanked.

In this video I'll try to just briefly explain what I suspect as far as multiple timeframe analysis, but reading and understanding my two articles, "Understanding the head fake move", I think is essential to understand why these moves are necessary, why they are seen so often and how we can predict them and know what they mean.


Sticking With NUGT Long for Now

This is just based on the 15 min chart's strength at this point.

Trade: IWM Oct $108 Puts

I don't feel really great about the timing, but I see the market is really struggling even with the SPY Arb. HYG is fading and that kills the Arb.

Tomorrow is Op-Ex pin day so who knows what comes of that, but I feel safe with IWM Oct $108 Puts here.

Trade Ideas : Alerts

we're struggling a little to get this breakout move that I've been talking about most of the day, going. We had a reversal from the downward drift as expected, but it's really the breakout move that makes the set-ups work great, they can still work good, but I'd prefer great. Right now it's just watching the signals and seeing if I think the market can make it higher, my initial impression is it can make the breakout I talked about and in all honesty there's no reason for them to push the market higher (and they are pushing it, just look at the SPY Arbitrage), unless it serves a purpose and it doesn't serve a purpose unless it breaks out to a new high, even if just a fraction of a percent, it just needs to trigget the limit orders sitting above resistance and the BTCs up there as well.

I've been looking at some assets, I'm not going to say this is the exact area I'd take them, but put it this way, this is where I set alerts so when or if price hits the area, I can quickly look and see if there's a trade set up there.

The short positions include:

XLF>$21
AMZN IN THIS AREA OR ANY HIGHER AS MENTIONED EARLIER
GS> $170
GOOG> $910/$915, $930, $950 (it looks like a big range, but in percentage terms, it's not that big at all).
IBM. $195 / $200
XOM> $90/$92
NFLX>$310/$314.50
JPM >$54-$55
PCLN> $1,000

For some longs, especially if you are using long equity ETFs rather than options,
MCP<$6.80
ERY>$25.50
TLT<$102/$100

As far as shorter term or option positions or maintaining positions, I'll put those out as they develop. There are a lot more, but there are a few to chew on, you'll see why I chose those areas.

GDX / NUGT Update

NUGT is becoming a more pressing matter, GDX calls were closed yesterday, perfect timing because today instead of being worth +30%, they'd likely be a third of that if we were lucky.

NUGT was left open because even though it is a 3x leveraged long (GDX), it's also an equity/ETF so Theta is not a concern, it was added to the initial GDX position for that very reason, the calls to capture initial momentum and the equity long to capture the longer term trend that I find options are often poorly suited to using them in a straight buy/sell manner.

Gold isn't the issue now, but since its current correlation is TAPER OFF rather than RISK OFF as it was last week, any move lower in the market is likely to take the PM complex lower and if you recall, both GLD and SLV in my view are each in counter trend bounces and they should head lower to form a larger base before they are a real upside threat.

GDX moves awfully tightly correlated to gold, thus our NUGT long which was at something like +30% earlier is now +20%, I don't want to lose that. So here are the charts and the plan moving forward.

3C CONCEPT... I have said this numerous times, now I'll show you as I often do when I remember. 

Wherever a 3C divergence first starts (and in this case GDX/NUGT were accumulated in to lower prices as most accumulation occurs), it doesn't matter that the averaged position would be lower than the upper prices where the divergence first started, price almost always far exceeds the level where the 3c divergence FIRST started.

 The left side of the arrow is not part of the divergence, it's the relative point to compare, the right side of the arrow is where the divergence first started and I drew a white trendline around the price area as well as highlighted the dates as you see a leading 15 min divergence, price has already exceeded the highest price the accumulators paid so the position for them is green no matter what.

This chart is also the reason I picked up NUGT, although I don't expect a month long uptrend, I expected more than just the initial pop and NUGT is meant to collect on that.

GDX 1 min looks a lot like ES 1 min or SPY 1 min doesn't it. so it appears GDX/NUGT will break higher from today's bull flag, this is where things get sticky and details important.

 The stronger 5 min chart is already showing significant damage, it won't take long for the 15 min to start to see damage.

I expect price (green) to shoot above the bull flag and the only way this move makes sense is to surpass yesterday's highs (in all assets/market averages), otherwise we don't have a breakout and we don't have buyers which is the reason for the move.

If 3C confirms the move (yellow line), then I'd hold NUGT, but if 3C doesn't confirm (red line), I'd sell NUGT in to the higher prices that should be coming and do it quickly.

Knee Jerk End-game?

It's looking more and more like that and a knee-jerk that lasts about 2 days is fairly normal, just like everything else there's a reversal process as multiple timeframes have to work together in and out of alignment to get to the reversal part of the process. I know that sounds confusing, but I'll put out a video and show you how a longer term negative is really the road map, but intraday positives and head fake breakouts are the gas and brake pedals that allow the logistics of the trip.

I'm still open to confirming, bullish signals in which case a number of positions would have to be re-arranged, but so far (since 3 p.m. yesterday, all overnight and thus far all today), that's not the case.

Here are a few samples of what's going on.

First the most important reading thus far for futures (SPX) would be the longer term charts since yesterday like this 15 min.

 The most important chart for near term trade going forward are these longer Index futures like the SPX/ES, which was negative last night, but I wanted to see regular hours data, it has grown worse.

In the very short term, to move a knee jerk move to the downside, there needs to be some help, I'll simply state the concept  as this, "From failed moves, come fast reversals", so the yellow arrow represents the breakout that would have to first happen since there's a bull flag already setting it up, then the failure of the move creates a small bull trap that snowballs downside momentum, this is why "Failed moves" create "Fast reversals" as more and more traders are at a loss and selling, there's more supply which takes out more of the bid stacks until there are few left and at much lower discounts.

The 1 min ES chart shows the positive divergence that can get that yellow arrow breakout seen on the chart above, but the market isn't doing this alone.

Note how the SPY looks similar, even though it hasn't had as much time (the overnight session).
 2 min positive intraday

 5 min negative continuing deeper

And the 30 min chart with a larger breakout, probable head fake or to be "failed move" that creates downside momentum on a larger scale, see how the different timeframes work together although they may look different.

As I said, the intraday positive is not from the market itself, obviously the lack of follow through today on the upside shows a problem with demand or it is being overwhelmed by larger distribution so once again the SPY Arbitrage is being called out to help intraday.

SPY Arbitrage model

However the 3 assets that move the Arb. are HYG (HY Credit), VXX (Volatility Futures) and TLT (20+ year Treasuries). For the arb to work, HYG must go up and VXX/TLT must go down or some version of relative performance that creates the same effect.

 The problem here is HYG Credit that has been supporting the market is now seeing steady and strong distribution as seen above. This means it may hang in there long enough for the SPY Arb to move the market, but I don't think it will stay up here much longer, that would be institutional risk off.

 I said earlier in the week that the longer term VXX chart looks outstanding (positive), but until the local 15 min goes positive, I don't feel very comfortable with it, this is the 15 min positive, it kills two birds with one stone because it can be accumulated at discounted prices and price alone being low helps the SPY arbitrage, everything works together.

As far as the last asset, TLT (20+ year treasuries), it's hard to get a read on, but it does look significantly better than the benchmark 10-year that is leading negative after popping yesterday to the upside, I mentioned the decline in 3C here last night so this is interesting. I think TLT could support all of this, but the interesting longer term effect here is how and why long term treasuries are looking so much better than the 10-year benchmark.

10 Year T' Futures on a 15 min chart have seen a worse negative divergence since yesterday's pop higher. This itself suggests the market move higher is a knee jerk reaction, however different length trends, like 1 min will behave differently, although they all seem to be working toward the same end and that is sending this knee-jerk move (I think probabilities are high it is such), lower.

I mentioned the $USD which was destroyed yesterday was seeing overnight accumulation as the currencies that gained saw distribution, this 5 min chart shows this has continued, again, not good for the market move from yesterday moving forward.

 Yields are a leading indicator, they act like a magnet for the SPX (green) and look how they led while the SPX was being accumulated in August, then went negative and now leading negative, they are going to be putting pressure on the market to the downside.

This is the intraday.

HY Credit is not as bad as I expected, but it is not confirming either, it hasn't made a higher high for the entire month on yesterday's move so watching this as well as HYG in the near term will tell us more about the market's longer term prospects.


Market is Flagging

I mentioned this earlier as 1 of 3 probabilities and as far as the IWM short trade potential, this is the best outcome.

Technicians take a bull flag as a consolidation/continuation pattern so that break out I need to short the IWM is more likely as the flag is clear now.

volume is perfect for a flag, so now it's just a matter of the flag pattern being bought, a breakout above resistance and 3C confirming worsening negatives in the IWM, this gives a VERY high probability short trade opening for the IWM or any other average, but so far the IWM is my favorite.

FSLR follow up & Sept. $38 Calls P/L

As I just posted, with Theta breathing down my neck, I'm glad to get out of FSLR with the small loss a day before expiration, however I'm very interested in re-entering FSLR, I think though it's prudent to wait for a correction and look for a new entry at a lower cost basis with clear and confirmed signs of accumulation in to the pullback.

First the position closed at an acceptable loss.


At a cost of $2.76 and a fill of $2.32, the P/L for the FSLR Calls is -15.94%, which is about 1% of portfolio so it's well within the risk management standards.

 The Trend Channel recently turned up, the stop here would be around $37.75, I put a pullback range at the white box. One reason I suspect a move toward $37.75 is the price range in yellow, FSLR isn't a 100k volume / $2 stock, they'll be watching it and a head fake move below the yellow range would be a probability.

On the other hand the X-Over Screen shows a new long in FSLR and typically the first pullback is to the 10-day moving average (yellow), so this is why the range is as wide as it is.

These are previous (Custom Demark influenced indicator) buy/sell signals and note the pinching of the Bollinger Bands in the past and now, so I think FSLR is very close to a pullback and move higher, alerts need to be set as to not miss the opportunity.

3C is negative so far to 5 mins, that's not huge so I think the pullback range is within reason.

URRE, FSLR & MCP Update

Currently I have open positions in FSLR Sept. $38 calls that expire tomorrow, I'll be closing those after this post at a loss, but not too bad.

URRE  have as  along equity position and MCP is a long favorite that I'd like to re-enter.

Here's the update for today, the common thread is that they all look poor on intraday charts, they all have exceptional longer term charts and bases, so I like them a lot, just tactically and especially with options, I need to move in and out.

I don't need more than two charts for each because there's consistiency in the short term charts and the long term so they are good representations. MCP probably looks to be one of the better performers today and I'm sure I'll exit FSLR and probably not at the optimum inttraday position, but with Theta on my heels and more important things to do, the few percent difference it "might" make is unimportant. What is important is even these strong stocks (longs we like), look poor today intraday, so think about the poor stocks or shorts we like looking much the same.

 FSLR 3 min doesn't look horrible, I chose it just because it shows accumulation at a rounding area which is what we want to see, but intraday it's not holding up well so I'll look for a pullback to re-establish a new position there in the coming days/weeks.

 This long term 2 hour chart (with huge signals because of the timeframe ) shows exactly why I'd re-enter FSLR on a pullback, I like all of them a lot for longer term longs and there aren't that many out there with these kinds of charts in the long end.

FSLR 2 min intraday leading negative, why take any more risks with losing more on the calls?

FSLR 60 min positive , this is why I'll be back at lower prices and solid intraday signals.

MCP intraday 3 min, so even the healthy stocks are seeing distribution intraday making yesterday look a lot more like the knee kjerk move we expect to be the highest probability on a F_E_D announcement, this doesn't have any bearing on trade a couple of weeks out, the signals either stay the same, get worse or improve and we move positions, but near term this is what I'm looking at.

Last night I didn't say the 2012 QE3 announcement's knee-kjerk move was going to lead to a primary bear market, just that it's often the wrong initial reaction.

MCP on a powerful daily chart, this stock has a lot more upside in my view, I just want to enter at more reasonable levels on a pullback that is accumulated (confirmation).

I'll be closing Sept. FSLR Calls.

Quick Update

There's some intraday positive divergences in the market, I saw them while I was writing the last post and was glad to see them. For instance, ES.
ES 1 min intraday positive divergence.

In addition, NQ is positive, the SPY, the DIA and almost the QQQ.

Why am I glad to see it?

This is the reason if you recall the earlier IWM trade set up I'd like to see and...

The IWM alone wasn't going to do it as it has no positive.


The Philly F_E_D Again begs the question, "What is the F_E_D so afraid of?"

There's zero doubt that this morning's 10 a.m. Philly F_E_D Regional Manufacturing Survey was in the hands of the F_O_M_C Board well before it was released today, the Philly F_E_D doesn't really fit well with the F_O_M_C's very odd stance yesterday that shocked the market as they F_E_D itself had led the public (through it's "most transparent F_E_D ever") that QE Tapering was all but a done deal, their are so many strange parts to this story I can't say, "The strangest", but I can say the language of "Over the coming months" as if no QE Taper will be considered for at least a few months as Goldman has rewritten their forecast today to say they now expect (instead of the September taper), a December taper announcement that will take 6 months longer than anticipated for the tapering of QE3 to end (according to Goldman's revised forecast) September of next year!

Looking at the Philly F_E_D Survey this morning, something doesn't add up if the F_E_D is basing their forward estimates and guidance on data, which as you know I suspect (irregardless of the data because of the ineffectiveness of QE on the economy), the F_E_D is indeed worried about something larger and quite worried at that.

This morning's 10 a.m. release was a barn burner.
Released On 9/19/2013 10:00:00 AM For Sep, 2013
PriorConsensusConsensus RangeActual
General Business Conditions Index - Level9.3 10.0 6.0  to 16.6 22.3 


General Business Activity rocketed higher from 9.3 to more than double at 22.3 at CONSENSUS of (GET THIS!) TEN!!!

Shipments and New Orders printed at 21.2 (New orders were 5.3 previously!)

Backlog Orders printed at a very rare positive 4.3

With all of the new orders, backlogs and shipments, the workweek went from -2.6 to +12.2!

Demand for Employment is up to 10.3 from previous of 3.5

The Six Month Outlook sky-rocketted higher from 38.9 to 58.2 WHICH IS A 10-YEAR HIGH AND JUST SHORT OF RECORD HIGHS.

THE QUESTION REMAINS, "WHAT IS THE F_E_D SO AFRAID OF?"

Considering Larry Summers (Hawk) who was a shoe in was sacked 5 days before he was to be announced as the new candidate for chairman, it suddenly takes on a different light. Is it rising rates, low inflation (unless you eat or drive), the political Budget/Debt fight or something else?

MY POINT IS, WHATEVER IT IS, IT'S LIKELY GOING TO FRIGHTEN THE MARKET MORE THAN THE F_E_D.

AMZN Follow Up

AMZN has been one of my favorite "potential" set ups and it has set up. I don't dispute the chance that it's breakout move could be stronger, I just don't feel it's a significant risk and of little draw down if it occurred, I look at it as more of a delay than a real risk considering the charts.
 On the daily chart, this is the FRP concept laid out and the reason for the expected "strong" upside move out of the accumulation range from August, this was laid out back then before accumulation was even finished as it was obvious with so many charts like AMZN, so close to a very useful (logistically) set up for Wall St. considering their trade size.

 This is the hourly chart, you can see volume picked up on a break above resistance, this is the point of the head fake breakout,, Wall St. can't put on a short the size they would normally trade without there being shares available to short in to without dropping the market, therefore they need demand from retail and the easiest way to get it is to push a breakout that retail will chase, that gives them their demand/volume that they need to sell short in to.

 The 4 hour long term 3C chart from accumulation on a head fake break below support that started the uptrend, that's the same concept as now except in reverse (for buying rather than selling/selling short). And look at 3C now, a large leading negative right where it should be telling us what the highest probability is as far as what Wall St. is doing in AMZN.


 Mid term charts are in a good position like this 15 min as well.

And now we have the move up seeing distribution along with most other market averages and stocks.

Note the head fake move below support where there was accumulation to hitch-hike (short term trade) AMZN long, the more of these I see, considering the $11 gain in gold at 1:57, the more I suspect someone knew about the F_E_D's decision yesterday.

If you like the position and maybe it's new to you, you might enter in phases as I have done, I think here would be a nice area to start a position and any further upside would only be better as long as the charts stay negative and they appear they will.

However, I DO NOT condone dollar cost averaging to wean out of a losing trade, phasing in to a trade is a plan that is established before you enter the first share and it must be part of your risk management before you enter the first share, it's a strategy, not a bad habit.