Friday, May 3, 2013

It Just Doesn't Stop-Right Through the Close

I'm pointing this out because we've had some tough decisions to make this week and in many cases, we've had very little time to make them so I want you to see what I've been looking at so you can add these tools and concepts to your own tool box so if you are in a pinch, you don't just make an emotional or arbitrary decision.

Wednesday was crazy, we had already picked up short positions, Puts and some longs that go up if the market goes down, so when Wednesday came along, we had a bunch of great positions.

Here was the problem with Wednesday, we had all of these great positions and most were at impressive gains especially because we had only had them for a day or two in most cases.

Looking at the daily SPX chart and looking at this week to the right, on Tuesday we had a "Hanging Man" downside reversal candlestick, the next day we had a move down of almost 1% in the SPX and a VERY impressive -2.45% in the Russell 2000. Keep in mind that our shorts and Puts in most cases were at significant profits and this was looking a whole lot like 2 weeks before on a Friday/Monday and the market headed lower over the next few days, it really felt like the market was heading lower the next day, but what did we do? We closed ALL of our Index Puts, most everything that would make money with the market going down like UVXY and we took some significant profits off the table, but also took the ability to make even more away should Thursday be another down day.

When we closed all 7 of those trades, this is what it looked like... (click the link). Our P/L for those trades:  +42%, +59.5%, +36.8%, +86%, -7.2%, +1%, +1.4%,  and +7.2%. 

We  even opened two new trades, Long Calls in GOOG and IWM and the next day (Thursday), we had to make a fast decision and we closed those two 1-day positions that were held less than 4.5 hours total, we made +53% and +73%.

Thursday was REALLY tough because we had some VERY negative signals showing strong distribution so normally we'd have entered some puts, but I looked at all of these very small inconsistencies in the market (I called them red flags) and decided we better not take any short positions, in fact none at all, lets just stay flat until we have a high probability trade in front of us. There were so many small red flags (any one by itself would have made no difference, but altogether and I had a pretty long post showing you all of them last night, "Daily Red Flag Wrap" (click the link of the post to view).

Good thing we held off, because today was the next day and had we opened shorts or more likely leveraged PUTS, we'd be in some trouble today. However today presented its own difficult decisions, we had plenty of distribution signals as I believe we were seeing distribution just as I posted earlier in the day from a post of what to expect from earlier in the week, it went like this...

"Here's my rationale: Ever since this move to the upside got started there was one thing I wanted from it, that was to short in to demand and higher prices, that is the same reason Wall Street set up this move, but even with a new SPX high, they have not been able to do what these moves are designed to do (and this is not Jonny-come-lately speaking-I told you the EXACT same thing before the move up even started). I told you the purpose of this move is just like a countertrend rally, it is to be strong, impressive, to change sentiment from understandably bearish to bullish, that is what is needed to get retail to buy so institutional money and us as well, can sell short, initiate new shorts or fill out partial positions. The riding the move higher or lower here and there is just extra money off good signals, but if I had to act in accordance with my main mission statement, it would be to wait for the market to put in a strong enough performance that retail turns bullish and starts buying on increasing volume, then I'd be looking for my opportunities to sell short in to that and all of this for the primary move expected DOWN!"

and...

"You will know when they have succeeded when you yourself emotionally are full of doubt and emotions almost or do get the better of your decision making process above objective data, then you know they have achieved what they set out to do."

All of that was from this post trying to set expectations so you knew what we were looking for, here's the original post.

And guess what? That's exactly what we got today, even the signals were as expected, but again we had to make another VERY difficult decision, was this the moment we were looking for or were we close, but no dice just yet?

All day I've updated you with the information and showed you the concepts, how the market is manipulated, how currencies play their part and credit and treasuries, volatility, yields, all of it.

I even said I thought they might send the market a bit lower, dragging in shorts and then throw the levers of manipulation so that actually happened and here's what it looked like in to the close.

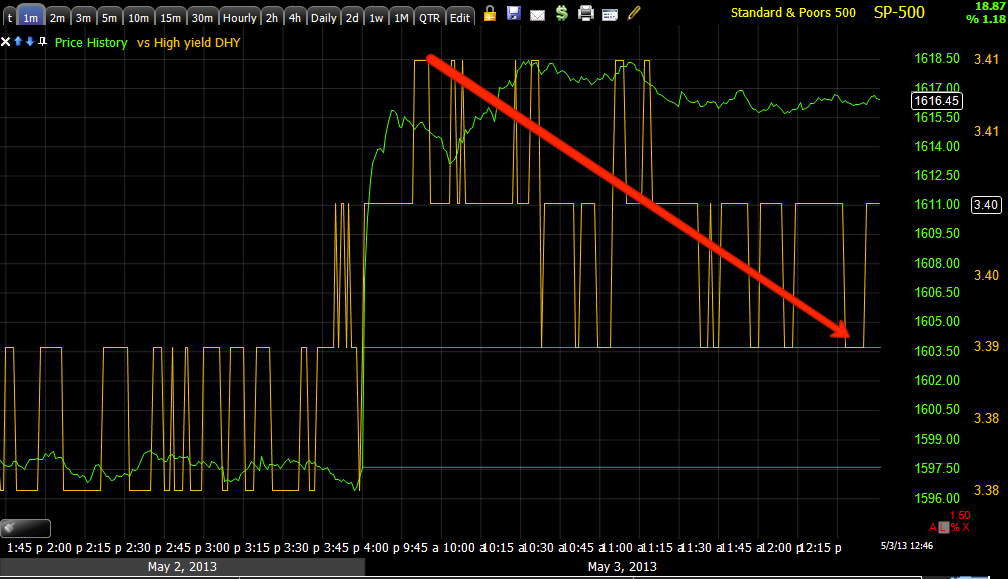
First the SPY Arbitrage telling us whether 1 or any of the 3 assets used to manipulate the SPY was being used, guess what?
Just as the SPY made a move higher and then lower toward the close, they had to halt that move (you probably remember why I thought they would, I had predicted it a couple hours earlier.

And...
We can see at the closing minutes, they flipped the levers of manipulation with the green spike and did the same earlier to lift the market just before the close as predicted.

How did they do it? Well there are only 3 assets...
 This is the 3C chart for HYG - High Yield Corporate credit, one of the three assets used for manipulation of the SPY according to the Capital Context SPY Arbitrage model. Note the HEAVY leading negative distribution in HYG today, that was giving the market trouble holding highs all day as HYG slid lower, but wait...

This is a 5 min chart of HYG today, notice the very last 5 min bar, after low volume all afternoon, that last 5 min bar saw volume jump and HYG gained a VERY MARKET SUPPORTIVE 0.10% in 1 5 min bar. Just for some perspective...

 The asset used to support the SPY with moves like that only closed up by 0.17% and 0.10% of that was the last bar of the day alone!!!

I drew in a potential closing candle for Monday, you know what we need to see for this to happen and for us to back up the truck and load it full of positions. In this case, as I said earlier in my "Thinking Like A Crook" segment, I said, "If it were me, I'd be looking to close the SPX over $1600 (that was said earlier in the week as well as yesterday) and do it on Friday so the entire weekend it will be plastered all over the news and the entire reason for this move will have come to pass as retail places their limit orders and heads off to their 9-5, that was mentioned earlier in the week and I copy and pasted it above. Just as a reminder of why all of this is necessary...

"I told you the purpose of this move is just like a countertrend rally, it is to be strong, impressive, to change sentiment from understandably bearish to bullish, that is what is needed to get retail to buy so institutional money and us as well, can sell short, initiate new shorts or fill out partial positions. "

While I can't be sure, one plausible theory is that retail places those limit orders and heads off to their 9-5, market makers mark those orders way up in pre-market, really making retail pay for doing something as dumb as placing their orders with market makers and specialists who know exactly where you'll buy and where you'll sell, making it really easy to take your money. That would give us the big gap up represented by the red candle on the chart above, if the things that we need to happen, continue to happen, we can enter our positions and a big bearish engulfing candle like that will have sealed the bull trap created above $1600.

After all, as I said, to do this right and get retail to buy...

"You will know when they have succeeded when you yourself emotionally are full of doubt and emotions almost or do get the better of your decision making process above objective data, then you know they have achieved what they set out to do."

I think we made good decisions this week, based on objective data, not fear, not hype, we didn't chase and we had a lot of great money making trades. I think we stay the course, every one of you knows EXACTLY what we are looking for and when we see that, we load up the truck.

Until then, have a FANTASTIC WEEKEND, YOU ALL EARNED IT.

I will have a special post out for you this weekend.

GOOG and MARKET Update

This is by far one of my favorite shorts, if you have seen one of the longer GOOG Analysis posts, you know why. Take a look at this...

 On a daily chart, GOOG is not only putting in a double top, but since the market uses technical analysis against traders (unbelievable that retail traders think that just because Technical Analysis is new and exciting to them, that  Wall St. doesn't understand what these guys are thinking when they can see every order they place on limit with their broker and they have been using the same T.A. for over a CENTURY!) GOOG is also putting in a shakeout move and a head fake move at the same time.

Technical Analysis has taught for nearly a century that a double top should see the second top (now) fall short of making a new high, in fact it should fall short of moving to the first top. However Wall Street is well aware of this and this is now what Double tops (and the same concept in reverse for Double Bottoms) now look like. They run pause with a bearish candle like yesterday's long upper wick indicating resistance, it seems the double top is doing exactly what the text books say it should do, shorts enter, then today we have what is known in Technical Analysis as a Breakout and to a new high, all shorts cover, longs buy and GOOG moves higher. This is the head fake, this is the great timing and I want to short GOOG so badly right here and now, but here's why I wait...

First this is a daily chart, it's one of the most powerful 3C charts you'll see, divergences here are HUGE sums of money. GOOG was in trouble all the way back at the October top, the first part of the double top "B" saw a higher price than point "A", but look how 3C is lower, this is the first clue we have a top forming. The second top at "C" makes a higher high, but look where 3C is compared to "B" or even "A", this is an enormous Leading Negative divergence on a daily chart, you can't ask for a stronger signal.

 Well, actually you could, a 3 day chart is even stronger, I drew in various divergences, because this is a 3 day chart and on a daily timeframe, even a tiny arrow is a huge divergence. Again what do we have at points "A", "B" and "C"? The exact same signals as the 1 day chart and a leading negative divergence.

Why am I not shorting GOOG RIGHT NOW?

You see this chart? It is a 2 min intraday chart, this is like a splinter in the lion's paw compared to the charts above, but it's great for tactical timing, it shows the end of day GOOG is getting support with a small, but effective enough on a 1-day basis (Monday), leading positive divergence. GOOG is not tactically in the perfect spot. This tiny spec of a chart is what holds me back.

VXX all of the sudden at the end of day is moving up, why? It's moving up not because of manipulation, it's moving up because of fear, real demand for protection in bidding up the VIX Futures, but look at what follows next...


Now, since the market started to head lower in to the closing hour, look at what has happened, HYG the asset/Lever that has been causing trouble for the manipulators all day is being pushed higher, in effect supporting the SPY/SPY Arbitrage, but they didn't spend money pushing it up all day, they waited until shorts were already in position and then bought some and let the shorts' covering do the rest because they won't want to hold a short over the weekend if it looks any better than they expected, only if it looks worse, that's how easy that is, it's exactly what I explained in an earlier post.

And what's this? It's exactly what I feared would happen at the end of the day if we took on shorts...
ES (SPX Futures) have been in a negative divergence all day, it's real alright, it's real distribution in to higher prices and short selling, but it's being maintained by gimmicks like the one above.

And what happened? As price moved down and traders maybe went short to fade this very strong 2-day move up, all of the sudden HYG is pulled as a manipulation lever and even ES is accumulated at the white arrow and prices actually start to rise. We'll have to see if they cause shorts to cover.

As for SPY momentum, take a look...
SPY on our intraday momentum screen, the momentum indicator with price goes positive, RSI goes positive, MACD has a long positive divergence and goes positive and RSI has 2 positive divergences below <20 and="" heads="" p="" then="" to="" up="">

AAPL, AMZN, NFLX

All of these are "Core" short positions and I'd be well within reason to start building out those positions right now, we closed NFLX puts yesterday at a small loss, it could have been much more significant earlier today and even now.

I think NFLX is still a fantastic short, I don't think we are there, there's a range in place after the gap up, I expect a head fake move there.

AAPL is in a primary bear market, but it is seeing a counter trend bounce and in a bear market, a counter trend bounce is probably the most powerful rally you'll every see, for the same reasons as this one, BECAUSE AFTER ALL THOSE 300 POINTS DOWN, IT NEEDS TO BE VERY IMPRESSIVE TO GET RETAIL FEELING THE GREED BUG AND BUYING. I don't think AAPL is there yet.

AMZN was a call, we closed it today, I don't think we would have received a better gain than what we did when we closed it. This ultimately is a short position I want, but again, not here, not yet.

All of these Bellwether stocks looking like they are not ready yet, is more small pieces we have to use to solve the puzzle.


All should be on your short list though

Futures Update-VERY HARD DECISIONS

Yesterday I had a VERY HARD decision and decided that, yes we should expect to see distribution in to the move higher, I explained the concept myself, how can I disagree with my own concept. The diffrence here and now is what I told you to expect at this time in the market, increased volatility, not only the % moves, but even the day to day moves, I showed you last night how we had the biggest move down all year Wednesday and the second biggest move up all year and over the two days we travelled less that 0.003%, all of that volatility and now move from Tuesday's close. Two days of insane volatility up falls in to the saem category, the other thing I said was, "Increasingly Unpredictable"  and higher ATR (daily Range) moves.

Yesterday I decided not to fall for it, not to enter short, be patient because there were too many very small signs, no one big one that I could point to, but hundreds of small ones.

Today is an even harder decision because we are where I expected us to go, but thinking like a Crook, unless what happened to AAPL happens now, it would be a waste not to get the weekend warriors placing their limit orders for Monday morning.

Do you know how hard it is to standby with signals like this?
 I'd short ES every time with a leading negative signal like this, but other indications don't add up.

 NASDAQ Futures (NQ)  even shows some accumulation just as they turn price down to pull in shorts.

This TF (Russell 2000) signal is insane, I'd ALWAYS short this, but even it has some relative positives as price starts to roll over.

I'm not looking to play intraday moves, to get short and then have the market run up in the last 5 minutes of trade, I'm looking for the larger trend signals and set ups, other indications say we are not yet at the High Probability Trades we look for.

However these two days have been some of the most difficult decisions ever and I'd expect that considering where we are in the market cycle and what's on the line.

Unless the other indications or red flags change, I don't care what the market does, even if it runs down to under $1600, until those other indications are in line, I expect there to be a lot of traps.

Leading Indicators Quick Update

HY Credit (HYG) is moving close to unchanged on the day, this is the negative divergence I want to see between the SPX and HYG, but it also seems to be pulling the SPX, we need the SPX to hold in place and HYG to drop.

Both Risk Sentiment Indicators are way off, major risk off sentiment today in both.

TLT is being USED VERY HARD as a lever to hold the SPX, take a look at the decline there, they are monkey hammering TLT to try to force the arbitrage Algos to bid up the SPX. VXX is also being used to some extent to counter the drop in HYG which in my view is REAL selling.

There is at least some evidence of currency tampering to support the market, the Euro is obvious with a 5 min positive divergence in the single currency futures, even though the AUD is seeing intraday distribution (profit taking on the move up), the longer 5 min chart in futures is positive, I do believe they intend to support the market with both the Euro and Aussie. It also appears not only in price, but on the 5 min $USDX chart that they are throwing some money in to knocking the $USD down (market positive). The Yen, I told you yesterday it was in a bear pennant (like a bear flag), it confirmed the flag for traders and moved lower (market positive), the 5 min chart shows another bear pennant has formed, traders will trust it because of the last move, but I suspect this breaks to the upside, maybe a crazy Ivan  shakeout first though (downside shake and then upside break), this doesn't make sense though with the other currencies, however the positive is also out to 15 min so this appears to be a longer term move being put together and not immediate support giving even higher probabilities to a Crazy Ivan shakeout (first it breaks below the bear pennant and then makes a very strong move higher which is market negative-but by that time the market should be negative).

Yields intraday are supportive, there's better relative performance recently than the SPX, so that's partly from the TLT manipulation as a lever, but it is short term supportive (again, thinking like a crook, you want this two day big move and break above $1600 all over the news this weekend-there's no reason to break that and it appears they are trying to support it, but it's a cheap, short term media manipulation trick to get retail in. We already know experienced traders are scared of this move, the move has done what it was suppose to).

High Yield Credit (not HYG) is moving lower, it has less liquidity so it can't be sold fast like HYG if need be, they need to start exiting now for a move that takes the market down next week and they are.

Commodities are also hanging in there despite some $USD intraday strength.

The negative divergences seen in the averages and the Index Futures are VERY convincing, I'm sure there's strong distribution in to this price move, there may even be an intraday move down, but just like yesterday I'm not convinced this is the time to swing for the fences and back up the truck.

This is subject to change should the data change.

Even if we see lower intraday prices in the averages or futures, I'm not convinced at all yet, we are moving in the right direction, but sending the market lower here and driving Shorts who want to fade this move in to the market would only serve as propellant should futures open higher Sunday night or Monday morning. New shorts wouldn't be enough to make a big difference, but intraday they'd be enough for and that's all they need right now.

This does not effect our Late May Puts.


CONTEXT / SPY ARB

The CONTEXT Model for ES (SPX Futures) is +4 ES points in the green, meaning global risk assets are suggesting ES is trading at a slight discount right now, not exactly what I want to short in to with the Index anyway. SPY Arbitrage (remember they are 30+ mins delayed) is near fair value, small corrections above and below, seemingly to hold the SPY somewhere in this level.

Has anyone checked what SPY Max-Pain by Dollar Value is Today? Op-Ex Pin? I doubt it, but who knows.

Let me know if you have that information

TICK Looks Horrible-SPY/ IWM/ QQQ/ DIA

The negative divergences are there, the NYSE intraday TICK chart looks horrible, it's hard not to add to the SPY/IWM puts in place, but thinking like a Crook? I'm going to jump to leading indicators quickly for any sign of a tie-breaker here, but I'd want at least the partial put position in place that we already started in SPY / IWM

URRE (Long) Position Management

For those long in URRE (this is another I think has good long term potential like UNG that is just getting ready to come out of a base), probabilities are high for a corrective pullback here, it's healthy, it's normal, you may or may not want to trade around it, I would rather just hold.

For those who may be interested in having some long term long positions, URRE's long term charts look fantastic, a pullback with verified accumulation in to the pullback (perhaps by next week
0, would be a gift of an entry.

For others, it would be a great "Add-To" area if you have room in your risk management.

Partial Long Position in SCO (2X Leveraged Ultrashort Crude)

I'm going with the ETF, 50% position size (long which gives you short exposure to crude oil).
This is likely a quick trade to fill the gap, but we'll let the market tell us that.

New Positions

I'm going to be throwing out some new positions, when I say speculative size for an Equity long or short, I generally mean half of my maximum position size which is 15% of portfolio (before margin), so Speculative size is often 5% to 7.5% and I ALWAYS (well I don't have time, but I've done it long enough I can guesstimate), but you SHOULD ALWAYS BE APPLYING RISK MANAGEMENT PRINCIPLES. I use the 2% rule which can allow a position to be as large as your entire portfolio, in that case I default back to maximum position size. It can also mean the position size is 7.5% which would be half of a full position FOR ME (BUT I HAVE A HIGH RISK TOLERANCE), never violate position sizes, so if risk management says maximum position size is 5% of portfolio, then 5% it is, not 15% because you are then adding 300% more risk.

For Options, they are generally risk managed through different options trading strategies, I don't have time to model the best strategy, strike and expiration on a position that may have 2 or more different buy/sell/call/puts to it, I use simple buy and sell of calls and puts, you'll have to deal with risk management, all of your premium paid upfront is your maximum loss. I typically keep these around 5% of portfolio value, but that's very high in my view for a straight buy/sell.

I prefer wider stops on new positions than taking more shares-give it a chance to work.

I often prefer to enter a position in stages, between 2 and 3, so when I say "Partial Position", that's what I'm doing, but you MUST know your risk management on the intended full size position before you enter, NEVER DOLLAR COST AVERAGE unless that was part of your risk management BEFORE you entered the trade.

PERFECT TIMING ON AMD-Look at it Now!

More than half of today's gain gone.

I'll show you the 3C charts that tipped me off after market

AMD P/L

Here's the P/L for AMD, I decided to include 2 charts, if I'm not pointing out the concepts for you to put in your tool box, then I'm not doing what I set out to do with Wolf on Wall Street, Keep you from being a sheep and instead a wolf in sheep's clothing and giving you the tools and concepts , like teaching a man to fish rather than giving a man a fish (or woman-Rosanne :)


I think we sold AMD at the perfect spot intraday, it seems to be slipping now. At the fill of $3.77 the gain on the straight long equity (NO LEVERAGE -which is actually what I prefer believe it or not) is +50.8%, not bad.

AMD has more to offer, while it's true that most stocks follow the market (90%), there are always those that buck the trend (UNG I think and probably AMD). For now though I think AMD has made its move, it's time to pullback and if it does with accumulation, we'll be buyers so long as the trade comes to us-no chasing!

 On a daily, "A" represents Stage 4 of the market cycle, Decline and at "B" it is capped off by "Capitulation", however most people think that is the final low so longs buy capitulation and there's one more low to shake them out at "C". "D" is a strong accumulation area, you can tell by the flat price range and low volume, Wall Street never wants to tip its hand unless its to their advantage.

People get so upset about this no matter how many times I explain it, I've written two articles that are linked on the member's site, "Understanding the Head-Fake Move", but still they get upset. At "E" we have a break below support with 3C accumulation, it;'s a shakeout/head fake move and one of the best timing elements we have as this is one of the last things to happen at least 80% of the time before a reversal, kind of like the market today!!! Shorts pile in typically and price moves back up, shorts are squeezed and the move starts and we have the stage 1 base behind us and move to stage 2 mark-up at "F" as resistance of the base is broken on heavy volume with good follow through.. The move is too parabolic for me, I think it has to come down.

Here's a closer look, "A" is the head-fake move-this is why you NEVER put your stop at such an obvious place and this is the best time to buy-best price/lowest risk and great timing. "B" is the start of the short squeeze and "C" is a stage 2 breakout to mark up or what we call the bull market trend.

Closing Out the AMD Long Equity Position

I still love AMD, but it's losing 3C support, seeing a lot of profit taking and momentum indicators are failing. You might consider partial profits, I'm taking all.

I still like AMD longer term, perhaps we'll re-enter after a pullback.

Charts after hours.

What's Going On

Remember my "Think Like A Crook" (i.e. Wall Street) that I have been posting lately, it's what you have to do.

The negative divergences are real, they are showing distribution, profit taking , short selling, all the things that this move was set up to allow large positioned Institutional money to do. However, there's always the chance of the "AAPL Episode" where some big fund decides, "He who sells first, sells best" and dumps in size on the market, that sent AAPL down about 40% and over 300 points in several months as discussed in further detail last night, so the gatekeepers are having to pull levers.

We use the SPY Arbitrage from Capital Context to get a broad idea and then confirm and narrow it down with out Leading Indicators layout. Here's the definition of the actual construction of the SPY Arbitrage model right from Capital Context...

" Capital Context has created the ‘SPY Arb’ model which identifies a tradable relationship between the stock market (SPY) and its value implied from interest rates (TLT), credit risk (HYG), and volatility (VXX). "

The model, although 30+ mins delayed...
 As you can see from the Histogram of the model vs. the SPY, the levers of intraday manipulation (HYG, VXX and TLT) are being pilled because of the distribution which is naturally pressuring the market, but other things are as well and if my "Think like a crook" view is right, they need to defend from a bad downside move.

The Euro should move with the SPX, it is falling off, I mentioned it in the futures update, this is causing negative market pressure and from what I see now, it doesn't look like this is going to get better as the positive Euro divergence can't hold.

 The move up in the $USD is market negative-actually almost all risk assets, again, there are divergences here, but nothing I'd bet on.

High Yield Credit, as expected is first mover because of liquidity issues (it has very little) and is negative, this isn't good for the market overall as credit tends to lead and equities follow, here's a good example with the same asset vs. the SPX.

 HY Credit leading positive in white sends the SPX higher, HY Credit starting to lead negative, this is what we need to see really head south.


In addition, one of the actual levers itself and a VERY liquid way to trade HY Credit (HYG) was market negative in red-compare the timeframe to the SPY Arb. chart, you can see they are pulling on this lever to the far right. They are trying to hold the market up/send it higher if possible.

 Here another lever, TLT breaks lower while the SPX DID NOT make a new high, that's the lever being pulled.

Volatility is going the other way in the white box to the left-check the time vs. SPY arb, protection is bid and outsized vs. the SPX move to the left, to the right VXX is a bit suppressed so I think even it is being used.

This is about getting the timing right and being in the right spot.

Keep AMD on your Radar

I'll try to update this long position we are in, it's up 11% today and 43% on the week, it may be time to take some partial profits.

I'll try to get charts out soon

Futures

Last night's post linked in the last post went through all of the reasons why we were patient and waited on the market, there are many.

Right now we are seeing much of what we have been looking for, everything? No, but the market is moving EXTREMELY fast.

Here are the Equity Index Futures.

You already know what the more important 5 min charts look like, but I will remind you with ES (SPX Futures).

 ES 1 min, the point here is the leading negative intraday divergence in the SPX futures (E-mini).

As promised, a re-post of the ES 5 min chart, this is a much heavier underlying flow of funds.
 If you are brand new to 3C, this won't make sense, if you have been around, you know what this means. There's a couple of posts linked near the top right of the member's site called, "Understanding 3C".

 The NQ (NDX futures), interesting isn't it how there was accumulation all night in the overnight session, not just here, but ES and TF too.

Are any of you surprised that I called this NFP print yesterday? Probably not, but in a normal functioning market you should be amazed, in this manipulated market, any of you who have witnessed a few weeks of what we see every day could easily have called it after that F_O_M_C policy statement.

TF (R2K futures) leading negative intraday.

Also it looks like the Dollar might be seeing some intraday distribution which would send it lower and the Euro some intraday accumulation which would send it higher, that should give the EUR/USD  an intraday positive divergence, which it hasn't yet, perhaps they are too new, but both are market positives, except for the position of EUR/USD which we'll see what happens.

The Yen is important, it is more or less in line, but the $AUD has a leading negative intraday, this is a market negative, the point being, different currencies are moving in slightly different directions signal wise, I think many are too young, but besides finding the right trades, I need to confirm we are at the right spot in the market.

I have a lot of respect for those signals, but "Thinking like a crook", what would you do if you were pulling the levers?

I would want to make sure to close the SPX ABOVE $1600, I don't know if it matters where in the daily range, just above. This gives the media all weekend to appeal to retail's greed, remember why this move is there, to appeal to retails's greed. The move is designed to overcome their fear and get them buying in the market, that is the only way smart money can sell/sell short, they need demand, they need higher prices otherwise the entire exercise is for nothing.

I  think the leading indicators need to fall more. 

So I think we close > $1600, but I'll stay alert, we are seeing selling in to demand via these negative divergences, but what's the use in doing all of this and not letting it even hit the news for retail that works 9-5? I do think there will be certain stocks that are probably in good position and we'll be watching for those.


Quick Update and IMPORTANT REMINDER

I knew this would get some of us, this is why I try to set expectations in advance, but expecting it and living through it are two different things, like they say, "Every boxer has a fight plan until the first punch is thrown".

Going back to my most recent commentary on the subject from yesterday actually, "Market Update and Determination"

In the second paragraph just as I finished saying, "I do think it is likely we close above SPX $1600."-that was the last sentence of the first paragraph, the important part came as another reminder of what is going on in the market, here's the paragraph linked above to the original post.

"Here's my rationale: Ever since this move to the upside got started there was one thing I wanted from it, that was to short in to demand and higher prices, that is the same reason Wall Street set up this move, but even with a new SPX high, they have not been able to do what these moves are designed to do (and this is not Jonny-come-lately speaking-I told you the EXACT same thing before the move up even started). I told you the purpose of this move is just like a countertrend rally, it is to be strong, impressive, to change sentiment from understandably bearish to bullish, that is what is needed to get retail to buy so institutional money and us as well, can sell short, initiate new shorts or fill out partial positions. The riding the move higher or lower here and there is just extra money off good signals, but if I had to act in accordance with my main mission statement, it would be to wait for the market to put in a strong enough performance that retail turns bullish and starts buying on increasing volume, then I'd be looking for my opportunities to sell short in to that and all of this for the primary move expected DOWN!"

Then after I go on to explain why I didn't like shorting yesterday's strength, I said this and highlighted it in red, right after talking about a strong additional +3% move from yesterday's close, this is important...

"You will know when they have succeeded when you yourself emotionally are full of doubt and emotions almost or do get the better of your decision making process above objective data, then you know they have achieved what they set out to do."

Check the post yourself, it's right here.

As to the SPY, unfortunately the market is moving faster than I can update charts, the most averages have not confirmed this move at all and I see several things, red flags if you will, that I do like as far as starting to enter short positions, although I  want to leave room.

Here are a few charts.

 This is the move above $1600, this is a perfect bull trap/head fake, this is the move that creates what I talked about weeks ago and ever since then...Again, because it's worth hearing over and over...

"You will know when they have succeeded when you yourself emotionally are full of doubt and emotions almost or do get the better of your decision making process above objective data, then you know they have achieved what they set out to do."

 As for intraday charts, that's bad enough, but if you put the same 1 min chart in to perspective...

You get this, ZERO confirmation, why would that be?

Here's a hint...

"there was one thing I wanted from it, that was to short in to demand and higher prices, that is the same reason Wall Street set up this move, but even with a new SPX high, they have not been able to do what these moves are designed to do (and this is not Jonny-come-lately speaking-I told you the EXACT same thing before the move up even started). I told you the purpose of this move is just like a countertrend rally, it is to be strong, impressive, to change sentiment from understandably bearish to bullish, that is what is needed to get retail to buy so institutional money and us as well, can sell short, initiate new shorts or fill out partial positions."

 SPY 2 min, this was 1 of many of the divergences yesterday that was so close to drawing us in, but did not, patience pays. Today, even worse. Remember, short selling is read as selling/distribution too because that is what it is, selling.

3 min chart, the thing with these early timeframes is they aren't strong money flows, but they are fast and if they can't confirm the move by heading up to a new high, then something is wrong with the move.

The 5 min negative yesterday almost lured us in, but there were too many small red flags we listened to, today's move is even lower, again, you know why.

I see ES, NQ and TF all negative as well, HYG is moving lower, currencies are negative, there are too many things to list.

I'll keep bringing you as much as I can.

PUTS:

IWM PUTS, expiration 5/24/2013, strike $97

SPY PUTS, expiration May 24, 2013, strike $165

I think the monthly (May 18th is fine as well)

Intraday charts look horrible. Entering Partial SPY and IWM Put Position.

They'll be at least May 18th expiration, maybe longer, in the money and I'll leave room to add.

I'll let you know what I chose ASAP

AMZN P/L / Rank / AMZN Charts

The P/L wasn't what I wanted, but my main mission is bigger than AMZN and it's becoming a distraction that needs to much baby sitting with short term charts going negative.


At the fill of $9.65, the AMZN Calls made +7.8%

Our Options Tracking Portfolio is now ranked number 1 for the month so we have obviously been making some good decisions at the right time because it sure isn't due to huge "Swinging for the fences" position sizes. For the week we are ranked #9, but we haven't been very active this week with new positions yet.


For weekly, our rank of #9 is out of 876 competing portfolios.

For our monthly our rank of #1 is out of 617 competing portfolios and this is not a model portfolio, just a tracking one to follow all positions taken.

As for AMZN charts...

 The 2 min has no confirmation, that seems like a pullback and I don't want to be in AMZN calls for a pullback

Same with the 5 min chart.

 The 15 min looks like there's plenty more to go, maybe we take a new position in AMZN after a pullback, maybe this chart crumbles.


The long term 60 min shows AMZN is not in any special place, heavy distribution sent it lower, as far as money flows out here, it's simply in line.

Closing AMZN Call

Short term doesn't look good, longer term does, but it's just a distraction and too much opportunity cost.

Euro Negative divergence/ USD positive

This should have some negative effect on the market.

Leading Indicators

***Note, email response will be slow today, I think this will be a fast moving market, therefore my first priority is to all members, meaning must keep an eye on the market before I can get to emails, but I will try to respond and eventually I will.

As for Leading Indicators, it may seem early to look at them, but when a market is moving fast with this kind of volatility, things move very fast.

For instance, I'm pretty sure we aren't going to see any significant reversal before High Yield Credit diverges negatively with the market, I already mentioned HY Credit, the less liquid type making such a move this early...
 HY Credit has lived up to our name for it as a Leading Indicator, it led the market late Wednesday, it was one of the warning signals not to short this market on yesterday's volatility and ...

A closer look today, we see it is the first mover, this is because it is much less liquid than HYG Credit.

As for High Yield Corp. Credit (HYG) which is one of the levers that are being pulled early to give this move the extra emotional punch as you can see by the early SPY Arbitrage...

The levers have been pulled a couple of times, I know which one.

Back to HYG...
 Interesting that it was leading late toward yesterday's close, but it seems a bit flat today after the initial move up.

In fact I captured this about 10 minutes later and it is continuing to deteriorate, this will have to be negative vs the SPX I believe before any kind of move down in the market comes, but what a bull trap this sets.

Risk sentiment is actually fading via our two asset/indications, FCT and HIO.

As to others...
 Commodities are in line with the SPX, but actually a bit weak vs. their correlation with the $USD.

 I'd think commodities would be more vertical with the dollar down like this.

Long term Yields are exactly where we want them, this is the largest divergence between Yields and the SPX I've ever seen, it's not good for the market when that cracking sound comes, but intraday...

 They are mostly in line, fading a little, they are worth watching.

As for the lever used in the Spy Arb chart, there's no question... TLT
 Doesn't that move down in TLT vs the SPX look a little extreme? That's our lever.

VXX (VIX Futures) is actually holding up better as it should have made a lower low, but I suspect protection is being bid in VIX Futures.

 If we look at VIX Futures longer term, note where the SPX is now vs the past (yellow), remember VXX should trade roughly mirror opposite, but it hasn't made those lower lows, why? Protection being bid and where is it bid the most? Right at the orange area. Interesting huh? How many of you trade VIX futures?