Wednesday, November 20, 2013

Daily Wrap

It's 3D, 3 consecutive days down, while this isn't normally a big deal, the markets have been far from normal.


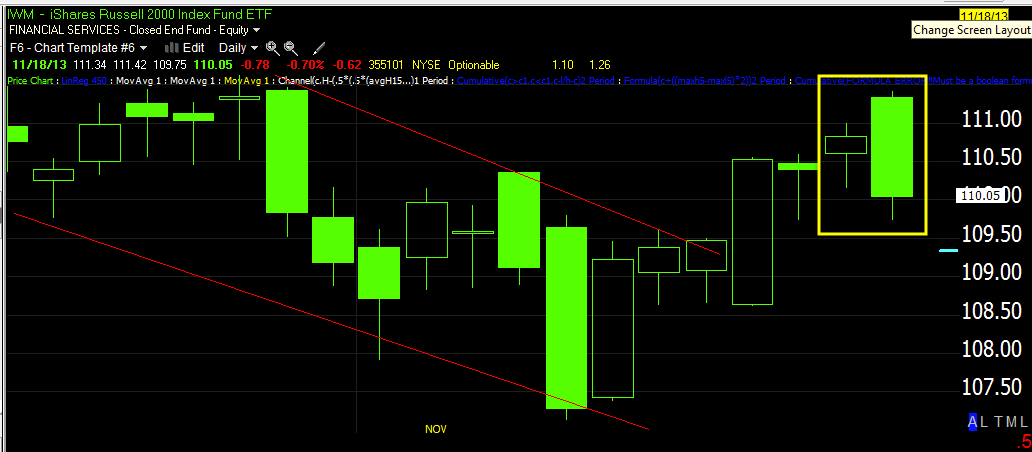
The key area though is still the head fake and that's where downside momentum will pick up as the 10/9 cycle enters stage 4 decline.
We have the Igloo w/ Chimney now, all we need is a break under former resistance, that's where the stops are piled up and that's why we see "Failed moves turn in to fast reversals".

The headline event of the day of course were the F_O_M_C minutes, more hawkish than typical and showing the F_E_D's fear in the wide open, I'm sure you remember me asking day after day, "What is the F_E_D so afraid of?" Today's minutes made it clear, it's this...
This is a weekly chart of the 10-year treasury futures, note the white box (May/June) when "Taper talk" was at a peak, the benchmark 10-year that sets rates for nearly everything plunged and yields popped 1%.

No matter what the F_E_D says, the market just won't believe them when it comes to, "Tapering QE doesn't mean raising rates", but the market feels that it means, "Raising rates is a lot closer". I'm sure the F_E_D is REALLY regretting the guidance that rates would rise about 6 months after QE was wound down, the market won't let it go. It seems the F_E_D is less worried about unwinding a nearly $4 trillion balance sheet, an unprecedented feat never tried before and more concerned with bond vigilantes driving up interest well before the F_E_D is ready and how do you lower rates when they've been near zero since 2008? The F_E_D lost control of this one and it seems they just can't strike a balance to find a way out.

Here's the 10 and 30 year T futures today, I'm sure you can tell when 2 p.m. was.

 10 year

30 year.

Gold was artificially slammed this morning when someone sold a truckload of contracts all at the same time taking out most of the bid stack and sending gold limit down and halted...I see no reason for this unless someone is accumulating at lower prices, the base area I talked about is a bit lower.
This afternoon the minutes slammed gold a second time and they were halted again as they went limit down.


Would I be a buyer or add-to with gold right now? No, not until the signals are there and there's some reversal process in place, however Gold miners are a bit more interesting which is why I split the 1 position between both assets.
It's likely GDX would need some more work before it would be a new position or add to, but it could be done tomorrow and I think gold would have to coming along by that point.

I think the $USD rounds out the QE sensitive assets...
Look at that spike in the $USD today vs the timeframe below.

There's no arguing that the market took the minutes as Taper on/QE off, sooner than later, but remember F_E_D based events almost always cause an initial knee jerk reaction (up or down).

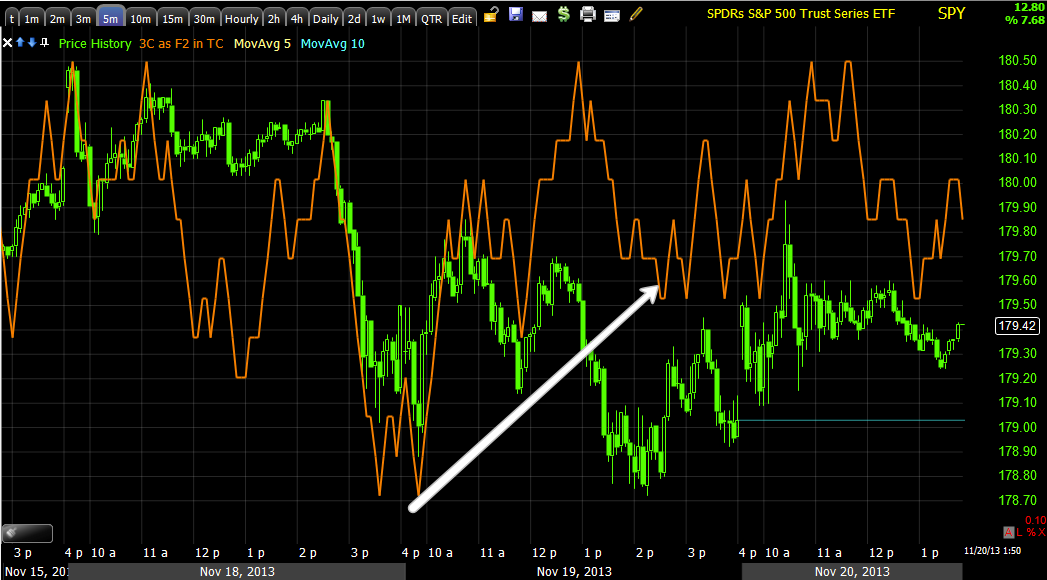
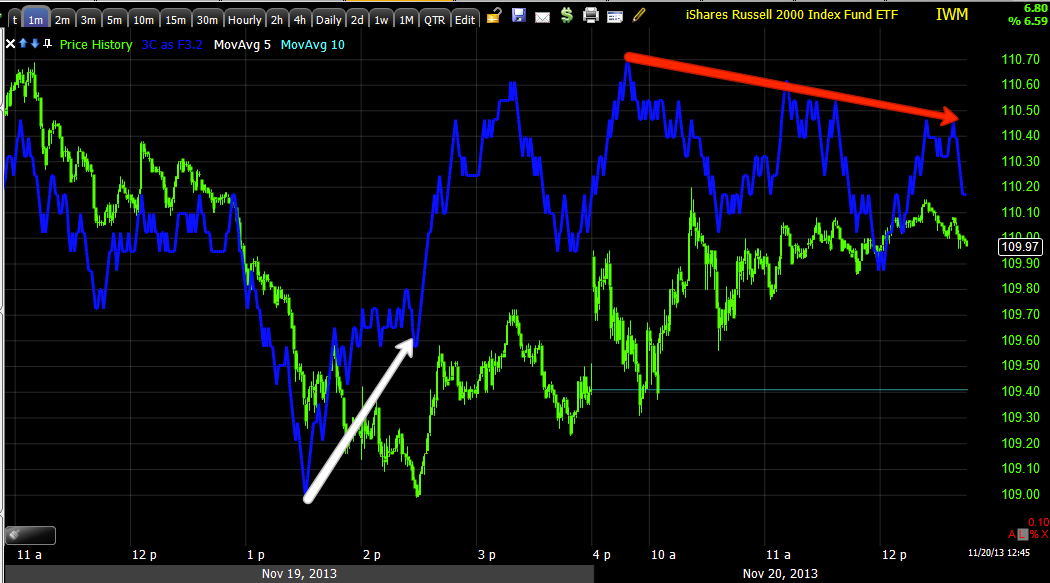
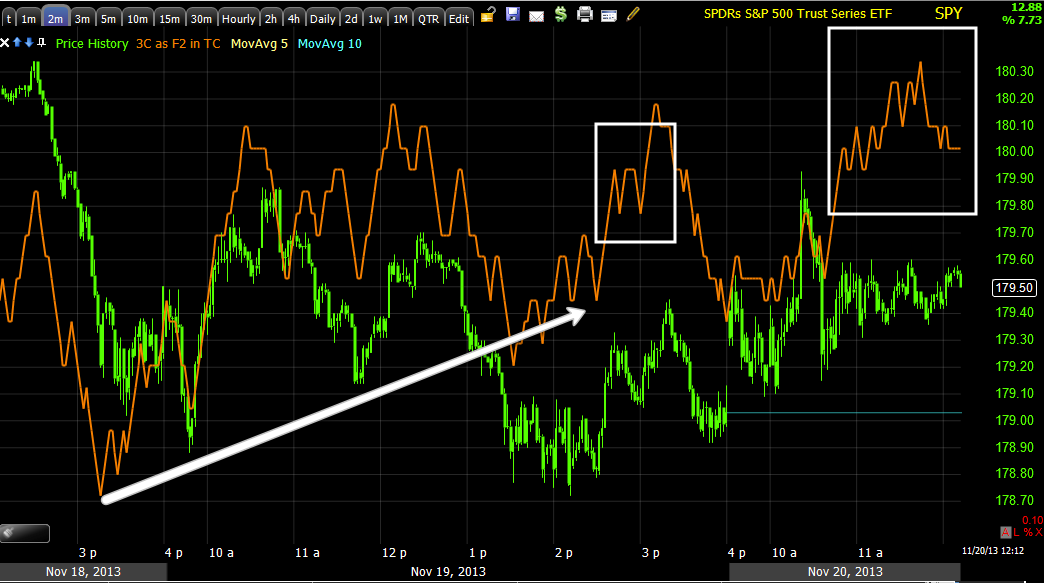
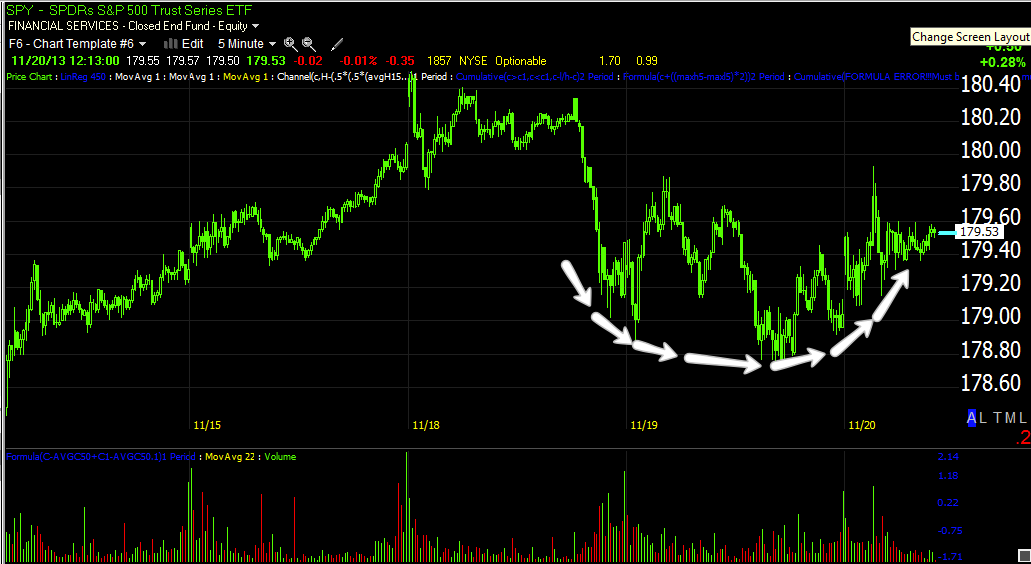
I showed late in the day how the averages suddenly started to improve, they have some work, but perhaps some late night Yen slam or EUR/JPY carry lifts the market, who knows, it has happened recently and it has failed even more recently.

Even if they get the pair moving after I showed you a negative divegrence as the pair hit a 4-yeear high that sent prices to the lows of the week almost immediately, there's no telling if ES could even be budged because as with many other short term manipulation assets, the EUR/JPY didn't do anything for the market on what should have been a late day ramp.
EUR/JPY candlesticks and ES (purple), the ramp in the carry pair did nothing for ES. The USD/JPY was even worse as you might imagine after the $USD made that explosive move off the minutes.

I was thinking, "For sure today we will see a Dominant Price/Volume Relationship of Close Down/Volume up which is a 1-day oversold condition", but no, it was co-dominant between volume up and down with an edge to down which essentially in this analysis means the market can still go down without any real oversold pressures.

There are some 5 min positives in the Index futures, NQ (NASDAQ futures) look the best, and we saw late day improvement in the averages as I posted.
NQ 5 min

Don't get me wrong, I see massive destruction in the charts, but a bounce would be a gift for certain assets like PCLN which I mentioned tonight, a near perfect entry although not an easy entry. As a member sent me today from another site similar to ours (as it reminded him of what we do)...

"I feel terrible when I follow your advice," Darrin told me yesterday… 

I'd just gotten off the stage in Singapore after giving a speech at the S&A Alliance conference, when I was approached by a friendly-looking subscriber – Darrin. 

But Darrin didn't start off friendly… Darrin came right up to me and told me how terrible he feels every time he buys something I recommend… 
It turns out, he meant that as a compliment… I had made him a lot of money. He told me… 

Steve, when I bought your euro trade years ago, I couldn't believe I actually went through with it. It felt wrong in every way. I didn't know why I was even following your advice. But then I ended up making REAL money on it.

Over years of following my advice, Darrin came to a conclusion… "Hold your nose and buy" works. "

Sometimes that's what you have to do, hold your nose and jump in, BUT YOU ALWAYS HAVE TO HAVE OBJECTIVE DATA THAT SUGGESTS IT'S A HIGH PROBABILITY/LOW RISK POSITION AND ONE LIKE PCLN WOULD BE, BUT STILL DIFFICULT TO SELL SHORT NEAR ITS HIGHS.

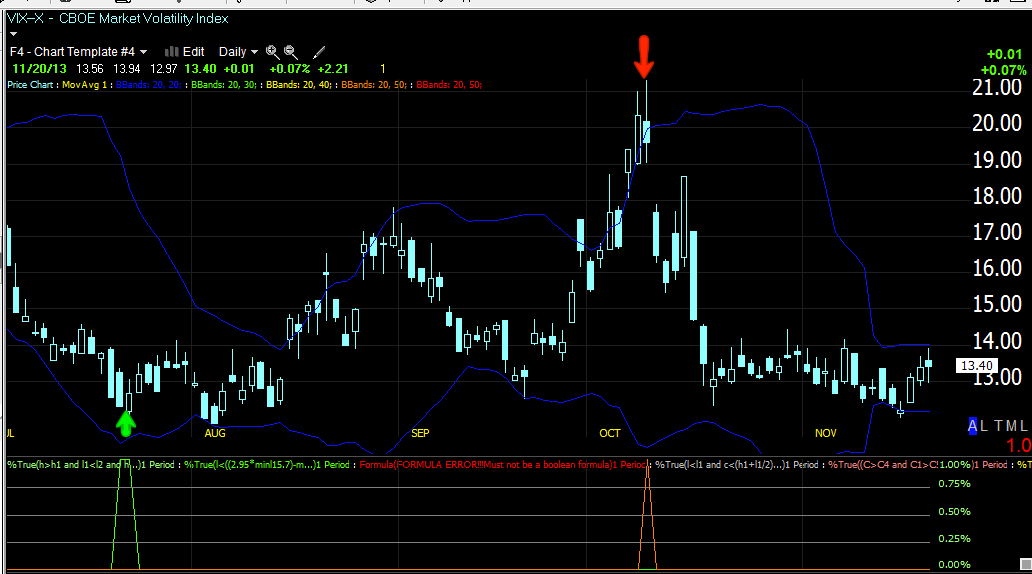
As you can see, we are still no where near that highly directional move the VIX is portraying, so all of this recent downside is really just kind of noise, there's a directional move coming that will move the VIX and the market in the opposite direction, I think the evidence is overwhelming as to which way it breaks.
Spot VIX Bollinger Band Squeeze.

I'm glad I sold the VXX calls early for a small loss and didn't double down on the mistake by following the VX positive divergence, it was too small as I knew so it didn't amount to much, the size of a base's footprint really matters.
VXX intraday, I closed some calls and took about a 8% loss, but much better than what it would have been after 2 pm.

HYG has a little 3C support, but it will really need to build, somehow I doubt support will come from there, more likely the NY F_E_D's open market's desk.

Leading Indicators showed that HYG and Junk Credit followed the SPX nearly tick for tick, High Yield wasn't far off either. It's worth noting that credit has not been buying the equity exuberance for quite some time, probably about the same time 3C went extreme negative and market breadth fell apart.

Both sentiment indicators were also down so it's not looking great for tomorrow except the few divergences in 3C that have formed or are forming.

I noticed VIX futures saw a lot more downside early on before the minutes (complacency) and then later were still significantly underperforming-there are some logistical reasons for this, but it will be interesting if its because someone knows that the move today, at least for the very short term was in fact a knee jerk as they almost always are.

Finally I want to mention that the liquidity situation in China is getting really bad as the PBoC has skipped out on at least 4 reverse repos and has drained money from the system. Interbank liquidity is scarce and causing problems for small banks. For those who don't recall or weren't around, it was a freeze in interbank liquidity in the US that caused the market to crumble and firms like Lehman, etc. to go under, although this was for a different reason, no one trusted the counter party to conduct overnight lending because no one knew who had what exposure to subprime, still a liquidity crunch is a crunch and China is feeling it.

Tomorrow I'll feature FXI, it's looking pretty bad which would make FXP look pretty good as a long.


Right now futures are pretty quiet, maybe something will pop when no one's looking in the middle of the night. The only thing of some interest is the Nikkei 225 futures, perhaps they finally decided whether the bad news was bad or good?
A leading positive divergence earlier in the /NKD lifted it so this will be interesting as a potential leading indicator for futures.

If anything pops up while my eyes are still open I'll be sure to let you know.

PCLN Core Short / Trading Short on Open?

PCLN has done EVERYTHING we've wanted to see, EVERYTHING, this is what you call a, "Trade that comes to you"...

So when do you enter or add to? I think a good case can be made for tomorrow morning, I'll show you why.

First we'll need some cooperation from the market overnight or in to the open because I doubt PCLN does it itself, when I update and look at internals I'lll be able to better asses the situation, but I'm thinking the Dominant Price/Volume relationship among the averages will not be Close Down/Volume Down , which has led to the kind of market action we have seen the last several days, but to a 1-day oversold at Close Down/Volume up. This is not the averages themselves so you can't answer that question, it is all of the component stocks that make up each of the averages, we are looking for a majority of stocks all in the same price/volume relationship (of 4) and to be dominant in all of the major averages, I think we get it tonight which would lead to a 1-day oversold status.

 The $1145 level was the area we were looking for a breakout above, this is based on market behavior alone, the head fake move, the positive 3C divergences to push that move were just a bonus confirming the probability of our expectations.

I don't see enough 3C support in PCLN alone for it to make the move I'd like to see so hopefully the market will do it for PCLN.

 This 2 min chart shows beyond a doubt that the expected head fake / false breakout >$1145 was in fact a false breakout as there's nothing byt pure distribution as you can see.

 Other charts have already been established as negative

60 min definitive negative change in character.

Here's where we get the set up.
Today's candle is first,  a breakout above the $1145 level which is what we wanted yesterday, it's the reason that I said I thought PCLN would be a good 1-day call option yesterday.

The Doji Star that has gapped up is a bearish Doji Evening Start reversal candle and the increased volume makes this candle about 2x more reliable.

Now, the perfect confirmation candle for PCLN would need a gap up in the morning and a close lower just like we predicted on Friday for Monday's action and just as it happened. The actual pair would look like this...
The second to last candle would be today in the IWM above and the last candle would be tomorrow for PCLN, this would be the bearish engulfing/confirmation candle.

If I saw a gap up in PCLN in the morning, I'd almost add or initiate new positions (short) right then and there as the probabilities would be very high that this would be the result.

I'll of course try to verify any such move if it happens, but that's the perfect set up and PCLN has just been doing EVERYTHING we've been looking for.


Dust Settling Charts

Here are the charts mentioned in the last post, they aren't mind-blowing, but remember that 3C signals nearly always pick up the next day where they left off at the close.
 DIA 1

DIA 2

IWM 1

IWM 2

QQQ 1

QQQ 2

SPY 1

HYG 1

TLT 1

And while gold hasn't moved yet, miners are seeing a very sudden, very strong move. I wouldn't jump in bases on this alone, but it may be a flag to pay attention to

THE DUST IS CLEARING

As I suspected, the dust is starting to settle and some intraday positives that mean something unlike earlier ones, are now forming.

I'll have charts up shortly, but it does look like an initial knee jerk even though I fully expect the 10/9 cycle that has already topped with a head fake move, will resolve with a stage 4 decline and we go from there.


Knee Jerk...

The difficult thing about today is the fact is we see these knee jerk reactions so often when it comes to F_E_D events that it's hard to say this isn't a knee-jerk reaction, however at the same time, the 3-day head fake move that saw the transition from stage to stage 4 decline start Monday is exactly what we expected from the 10/9 cycle, so this move, if a knee jerk is in line with what we expected from the 4 stages of the cycle, the 4th stage "Decline".

The assets that will likely show something first will be QE assets, the $USD is one and may be starting to show something. The market can do a whole range of things so a knee jerk and a stage 4 decline can both exist with a slight difference in timing/trend.
Interesting that there was a positive divegrence in the $USD just before the minutes! The negative isn't so much what I'm looking at because it's only 1 min, it's the change in character of the price trend.

Waiting for the DUST to Clear

There are a lot of mixed signals, apparent attempts to put together some accumulation of the knee jerk lows, but in other places (the longer charts where heavy institutional activity takes place), there's also some very large distribution.

I'm looking for something that has an edge, something that stands out, right now it's knee-jerk-ish although it seems the market has every right to move down on those minutes.

However, they often will try to get a bounce to sell short or sell in to, smart money doesn't chase the market.

For instance when QE3 was announced, the market went down for several months, but then they accumulated the November 16th lows and it has been up since, the point is, it seems they are doing one thing when they are actually doing another.

WOW, As I Suspected, The F_E_D Changes the Yard Stick Again

This time, even more arbitrary.

For the first two QE and Twist programs, the F_E_D gave a date when they'd start and a date when they'd end. The first hint I had back in 2012 that the F_E_D was looking to exit accommodative policy LONG BEFORE they ever hinted at it was when they changed the yardstick in which guidance was measured from a definitive and unambiguous calendar date which the market could depend on to "Data Dependent" and we all know how easily data is manipulated, right now there's an investigation in to manipulation of unemployment rates before the 2012 election.

Now the F_E_D says...

Re: When QE Ends...

"They generally expected that the data would prove consistent with the Committee’s outlook for ongoing improvement in labor market conditions and would thus warrant trimming the pace of purchases in coming months. However, participants also considered scenarios under which it might, at some stage, be appropriate to begin to wind down the program before an unambiguous further improvement in the outlook was apparent."

First we ALL know that the only way the unemployment rate actually moves down is because of the historic number of people dropping out of the labor force, it's a facade. In addition, they are considering winding down BEFORE the improvement that is easily manipulated even without the massive outflow of workers from the labor force participation rate.

THIS IS THE NEW YARD STICK, IT IS 100% AMBIGUOUS WITH NO CONDITIONS AT ALL! THE MARKET IS GOING TO HATE THIS!

"As an alternative, some participants mentioned that it might be preferable to adopt an even simpler plan and announce a total size of remaining purchases or a timetable for winding down the program. A calendar-based step-down would run counter to the data-dependent, state-contingent nature of the current asset purchase program, but it would be easier to communicate and might help the public separate the Committee’s purchase program from its policy for the federal funds rate and the overall stance of policy."

TWO THINGS, FIRST CHARLES EVANS TWEET YESTERDAY...

This was yesterday, it barely moved the market and some wondered if it was tongue in cheek, if it was out of context, or if it was a floater to test a policy idea that was clearly discussed as seen in the minutes, "A total size of remaining purchases". This tweet is essentially exactly that, although dates and amounts are obviously somewhat fictional.

SECOND...

"A calendar-based step-down would run counter to the data-dependent, state-contingent nature of the current asset purchase program, but it would be easier to communicate and might help the public separate the Committee’s purchase program from its policy for the federal funds rate and the overall stance of policy.""

This confirms exactly what we talked about this week, the last time QE Taper was serious in May/June, the 10 year rate popped 1%, the F_E_D is very afraid that the early guidance of quite a while ago that "Rates would rise about 6 months after QE ends" is still with investors and this is what smart money is most concerned about, RATE HIKES.

This confirms the F_E_D is very concerned and trying to separate a QE Taper from Rate Hike expectations, which are accommodative policy as well.

The minutes seem to confirm they will end treasury purchases BEFORE MBS, remember QE1 started in 2008 with MBS purchases, but had absolutely NO EFFECT and the market dropped lower until the F_E_D added Treasury Purchases to QE1, that was the 2009 bottom and the market went up, so the market WILL NOT like Treasuries being tapered first, it might as well be all of QE at the same time as traders don't care about MBS.

" For example, most participants thought that a reduction by the Board of Governors in the interest rate paid on excess reserves could be worth considering at some stage, although the benefits of such a step were generally seen as likely to be small except possibly as a signal of policy intentions."

This shows their fear as they consider a useless program just to reinforce guidance and convince investors they won't raise rates before they say, but the market will do that for them as it did in May and that's what they fear, the F_E_D ACTUALLY LOSES CONTROL OF POLICY AT THAT POINT AND THE MARKET SETS RATES!!!

MY READ...The F_E_D would end QE right now and the thing I wondered about a while ago, "WHAT IS THE F_E_D SO AFRAID OF"  is now clear, it's not unwinding a nearly 4 trillion dollar balance sheet which should really scare them, it's the reaction to tapering QE in interest rates that scare them.

Remember the June minutes when they sounded like they'd end QE by the end of this year, half of the participants were for ending QE by the end of 2013, THEN THE NEXT F_O_M_C WAS THE ABSOLUTE OPPOSITE? The reason why is because of the 1% jump in the 10-year benchmark interest rates, that's what scares the F_E_D, that's what they've been trying to figure out how to deal with as it takes policy right out of their hands. Even the "Ambiguous" possible end of QE discussed that had no threshold at all, it was arbitrary, just a decision to stop shows how willing they are to end QE any time, right now if they could, it's how the market reacts as it fears they will hike rates soon after, that's what the F_E_D fears.

Assets TAPER ON / QE OFF

I haven't even had time to read the minutes, but I have an idea what they say, raper soon.

Check out the QE sensitive assets and remember there's still the initial knee-jerk move to consider.

 TLT Treasuries down

10 year Treasury futures down

30 year T futures down

the $USDX straight up

And the SPX/SPY down.

A perfect TAPER ON reaction. However, lets not react emotionally, let the dust settle and work from objective evidence.

Market Update... There goes AAPL

There's finally some improvement in the intraday SPY/QQQ charts. This may actually yell us something.

We already know what we know based on the size of the accumulation and we know about the F_E_D knee jerk reaction, we may be able to put the pieces of the puzzle together here.

 Finally SPY 1 min starts improving

It has been this SPY 5 min chart that has kept me from closing SPY calls.

QQQ 1 min is improving.

At first this made me nervous, but looking at it I thought, "This looks strong, but it doesn't have the reversal process, the bottom isn't wide enough"

 VXX seeing a strong positive divergence as SPY was weak obviously made me nervous.

However once again the 5 min chart of VIX Futures tells me it's not ready to go yet.

This is what I'm thinking, protection is being bid at lower levels and will continue to be on a market move to the upside- There's a good chance that it's a knee jerk move and that would create these kinds of signals, by the time it was done, the VXX chart would be wide enough to have a reasonable reversal process.

We'll know in a few minutes.

Market Opinion

This is pure opinion, just you and I talking. I'm just watching intraday 1 min charts about 30 mins in front of the F_O_M_C minutes and I don't like the way the charts look (as far as the couple small bounce options I took on like SPY and AAPL calls, as far as the majority of trading positions and core shorts left in place, I'm not concerned much at all.

It's just intraday these 1 min (and some others) are not looking good. I'd think if there was a bullish leak then the 1 min charts would be positive on any kind of pre-minutes pullback, but there's not much there.

Even worse, HYG is not looking good at all.

The only thing that is still there and keeps me in the SPY/AAPL calls is the 3-5 min positive charts built yesterday as most are still there.

Who knows, maybe there's no leak, but I doubt it.

Just one trader to another, I'm nervous about these charts right now in front of the minutes. Leading indicators aren't giving me anything to hang my hat on either.

However, I have to stick with the charts and an hour or so of 1 min negative intraday charts isn't on the same level as the 5 min positives built yesterday, even though they are weak as well which I interpret as a short duration bounce, thus the reason for options for leverage.

If I have something that's more than emotion, I'll let you know, but I'm human too. However I have to stick with the highest short term probabilities and they are still with yesterday's 3-5 min charts.

Almost Forgot- WARNING

As ALWAYS, "Beware the knee-jerk reaction" which applies to anything F_E_D related and more broadly central bank related (across the world), but specifically F_E_D on big events like F_O_M_C or the minutes.

The initial move is the knee jerk, it's impressive, but typically reversed between several hours and a couple of days.

Just my standard F_E_D event boilerplate.

IWM Update

I'm not sure if we get a pop in the IWM/market generally, I really think the minutes have something to do with all of this, whether they were leaked and bullish for the market or leaked and this bounce was used to short in to. Remember last time they were leaked it was 1 day before, yesterday is when we saw the accumulation for today.

In any case, if IWM does make a move higher (I'm still holding SRTY long as an IWM short trade), I'd be interested in possible puts in to that kind of price strength.

Right now most of the market is looking like this, it may be some nervousness in front of the minutes in about an hour.

 Intraday 1 min negative divegrence as IWM gently rolls over, the divegrence isn't that bad.

However this 5 min one is and the channel buster is, so if the IWM gets a price pop, I'll of course wait for intraday signals to show distribution first, but I'd be very interested in IWM puts, these channel busters tend to reverse fast and hard.

Thinking about adding to AAPL Calls

It's VERY hard to imagine AAPL doesn't pop to the upside VERY shortly, it's even in a tight bearish consolidation triangle which would mean an upside breakout from the triangle would be a head fake catching traders off guard.

 1 min is very high

The 5 min and that's about as far as it goes, but note the triangle, a perfect head fake pattern and its mature.

Market Update

I've never seen so much "good cop/Bad cop" coming out of the F_E_D over the last week, Bullard who spoke at 10:30 this morning said among other things....


  • BULLARD SAYS THINGS ARE LOOKING BETTER
  • BULLARD SAYS JOBS PICTURE LOOKING BETTER
  • BULLARD SAYS QUESTION IS WHETHER JOBS PICKUP SUSTAINABLE
  • BULLARD SAYS A STRONG JOBS REPORT FOR NOVEMBER WOULD INCREASE PROSPECT TO TAPER IN BOND BUYING IN DECEMBER
The tine is clearly Taper On and maybe as soon as December where most have been betting, but most have been wrong most of the year. In any case the market didn't like it which came right after the ECB floated negative deposit rates again and sent the market a little higher. My question still is what does all of this mean if anything, for the 2 p.m. minutes because the mixed messages don't seem to be trying to inoculate the market against anything in particular.

I called for this bounce based on charts, nothing else and I'm sticking with charts. No matter if I post all 4 major averages and HYG Credit, the bottom line is still pretty much the same and I think the 3C  ES 5 min displays it the best.

 After the negative market performance Monday, I suspected we linger in the area Tuesday creating a small base in which yesterday I made pretty clear I think it bounces, whether there's advance knowledge of the minutes and that's the real catalyst for a bounce (we'll find out at 2 p.m.) as they have been leaked before, there's still only about a day of accumulation (yesterday) so we have this little "U" is ES where the positives were yesterday and price moving up off that base area, again it's limited in the amount of accumulation so the move to follow which has started is limited.

The SPY 2 min positive mostly yesterday and rounding.

 3 min the same

And this is the "U" reversal process, remember they are proportional to the preceding trend so this is the right size considering Monday.

The 5 min chart is about as far as we go for positives and that's only on an intraday basis, zoom out to perspective and...

That's what the 5 min chart looks like, the larger picture is the leading negative divergence, the positive of yesterday is a peep in this signal.

Pretty much across the board, the more important 10, 15 min + charts are negative so that's another cap on the bounce anticipated.

However as I said yesterday, "Wall Street doesn't do anything without a reason" and they did this, if it was obvious to us Friday, then Monday and then yesterday in which we can predict the next day based on the charts (as well as the longer term trend), they are behind it.

The question is why and typically as I reminded you, these moves are rarely mediocre, they are there to cause movement and to do so they must move emotions.

I'm thinking any "real" price strength we "may" or should get, would be where I want to short in to price strength, re-open VXX calls and enter Puts and shorts.