Thursday, March 8, 2012

Some Reading Material

You can call me a Kook (which is not very nice to say to a surfer), but I have on more then one occasion pointed out what I believe are leaked reports (as 3C showed odd activity before the reports).

We;; it turns out, I may just not be a Kook after all, when the government itself turns to nuclear security agencies to help safeguard the data from being leaked, obviously the data has been leaked.

Here's the story from (I dare not say it, but I will type it), CNBC


Labor Dept. Asks Nuclear Guardians for Help Keeping Jobs Data Secret

A First for Market Internals

I won't bother posting all of the Price/Volume relationships, you can probably guess what the dominant relationship was, Close Up and Volume down (the most bearish of the 4 relations) across the board.

However, I was surprised to see these market internals generally and especially on an advancing day....

Today's movement came from lower than avg. volume (NYSE 717 mln, vs. 775 mln avg; Nasdaq 1570 mln, vs. 1706 mln avg), with advancers outpacing decliners on the NYSE and decliners outpacing advancers on the Nasdaq (NYSE 2364/659 Nasdaq 1820/701), but especially interesting was the new highs/new lows which were:  new highs outpacing new lows on the NYSE and new lows outpacing new highs on the Nasdaq(NYSE new highs/new lows 121/8 and NASDAQ new lows/new highs 79/22).


Even on Tuesday we didn't see new lows outpacing new highs and this is the first time I can remember seeing it since the rally started. 
As for MCP posted earlier with the great 3C chart, here's the breaking news from Briefing.com


Molycorp to acquire Neo Material Technologies in $1.3 bln deal  (25.98 +1.07)
2012-03-08T18:00:36 ET
Co announced the signing of a definitive agreement under which Molycorp will acquire Neo Materials for approximately CDN $1.3 billion. This will create one of the most technologically advanced, vertically integrated rare earth companies in the world.


Something fishy in ES

This is the S&P E mini futures (ES) from pre market , regular market and post market as they trade 24 hours a day during the trading week. In the afternoon you can see where they were falling apart before the Greek debt news that turned out to be as usual, inaccurate. However it's the post market action that is out of the ordinary with 3C leading to a new low. We still have a long night with the Greek PSI details trickling out at 1 a.m. EDT, however I thought this strange enough to post it.

I'll check on it later and see if anything interesting happens

Put MCP on Your Radar

It's unusual to see a stock that is up and really leading positive like this... I'll be looking for an entry long.

 30 min MCP the green arrows are trend confirmation, white are positive divergences and red negative. This stock seems to like to run parabolic head fakes like the one around the 30th with the red arrow above price, but the recent action has been leading positive.

 Here's a closer look on a 15 min chart, accumulation into the 27th and the 13th, now the 15 min chart is leading positive.

 The 5 min chart shows the reversal at the top to the left, again a head fake move with a lot of downside momentum from it, some small accumulation around the start of the month and a head fake move at the yellow arrow, currently though it's leading positive.

This 2 min chart shows that head fake mentioned above clearly, but on the 6th, 3C never came down with price.

I like the looks of MCP, I'd like to catch a pullback to look at a long position here. In any case, I would keep this on your watch list.

How the Sewing Circle Did Its Job

From Sunday's analysis for this week. "The Week Ahead"

"A couple of interesting events we have this week, Apple unveils the Ipad 3 on Wednesday, although the Bollinger bands are so tight, I don't think the breakout will wait for Wednesday."


It didn't, first thing Monday morning...


"Content providers are not cooperating the way AAPL would like, they don't want to hand over so much control of content to AAPL. This is not a perfect analogy, but close enough. When APPL launched the I-Phone, they needed a network that was willing to upgrade their system so I-phone features could be utilized, AT&T stepped up and was rewarded with a 5 year exclusive contract. Imagine if not networks stepped up, this is sort of akin to the content problems AAPL is having"


Trade in AAPL yesterday at the launch of the I-Pad 3 and Apple TV
Probably not the smashing success Tim hoped for...


"We have a bevy of other potential game changing issues coming due around the same time, specifically the Greek PSI deal is slated to be completed Thursday this week and the consequences carry the entire bailout."


I suspected we'd hear some kind of European rumor to push the market higher, specifically remarking that it would likely be refuted within hours as per the norm.


And the news today...


"According to Greek SKAI, participation is now over 90%."


Trade was getting very negative just before this yellow arrow which happened to be the time that a little European rumor, (that's news in Europe) broke...


And for the follow up on that news....


"The SKAI number which ramped the market was based on the assumption of a CAC trigger ""


So risk was on based on the "leaked" erroneous results of the Greek PSI a full 10.5 hours before the results actually start trickling out, with no distincition being made as to what bondholder class did or did not participate initially any way. Meaning, even if there is a "successful" PSI % it is still wide open to market interpretation as there will be no way of knowing whether the Hedge Fund Blocking Stakes will present legal challenges in British courts.


Pretty much all of the elements expected are there, they may be a little off and a little out of order, but they are there.


ES Volume

Can anyone guess what the dominant Price/Volume relationship will be tonight... If this doesn't speak to you....
Note Volume in blue...

Financials/Tech and Event Risk

 XLF 1 min

 XLF 2 min

XLF 5 min

 Tech/XLK 1 min

 XLK 2 min


XLK 5 min

There's clearly no underlying support for the bounce in Financials and Tech..

 The SPY is close enough that it could put in a new closing high and is AAPL below, but at this point, I'm not sure if it even matters,


Between the close and tomorrow's open, we have the reaction to the Greek PSI and Non-Farm Payrolls, both before the market opens, there's huge event risk. Later I'll get in to some specifics on today's rally, but as Soc. Gen. commented, it "seems" stupid with the event risk.

Personally, to me it makes sense.

If things pre-market go wrong, it could make this move look small (by the way, there was a new closing high the day before).

In some ways Monday would make more sense, but in others, letting a move like that fester over the weekend could be equally as damaging.

Thus I closed any longs left.

Thoughts

With the NFP (Non-Farm Payrolls) at 8:30 a.m. tomorrow morning and the Greek PSI results at 1 a.m. EDT, that leaves a lot of uncertainty going in to tomorrow's open.

I think I'll be closing the rest of the HGSI position....

PSI to be announced 1 a.m. EDT

Greek PSI should be out any minute

 EUR / USD volatility ..

I expect the initial reaction will be seen here in the EUR/USD first...

AAPL only 3 points away

 AAPL Intraday...

 AAPL only 3 points away from making that new closing high I've been hoping for all week.

Here's the underlying support for AAPL, which essentially there is none.

A new closing high going in to a disappointing NFP tomorrow would be a prime set up.

Market Update

As a reminder, he Greek PSI results are do out in 20 minutes. It sounds like either way they go, there are a lot of open issues. There's a lot of potential for knee-jerk volatility...

That last ES divergence looked like it was going to be trouble.

 DIA 1 min

 DIA 2 min which has been leading negative all day deteriorated...

 IWM 1 min

 IWM 2 min is the same situation as DIA 2 min above.

 QQQ 1 min seems to have one of the sharpest negative divergences.

 The 2 min remains in leading negative territory.

 SPY 1 min went leading negative very fast.

Even though it has been in a leading negative position all day, the same move can be seen on the 2 min.

AAPL just saw a break of the intraday trend on the highest volume of the day.

Reality of Today's Rally

As mentioned early today, ES moved up with the EUR/USD, an event I was looking for yesterday, it happened today. The catalyst, there was none, which is also what I was looking for (more specifically a floated rumor to lift ES overnight that was bunk).

The main attraction in economic data today was Initial Claims,

Released On 3/8/2012 8:30:00 AM For wk3/3, 2012
PriorConsensusConsensus RangeActual
New Claims - Level351 K351 K345 K to 360 K362 K
4-week Moving Average - Level354.00 K355.00 K
New Claims - Change-2 K8 K


They missed and this going in to tomorrow's NFP, not exactly a risk on friendly environment.

A just released Gallup poll found that February jumped the most since 2010 for the 3rd consecutive monthly increase, this in front of tomorrow's Non-Farm Payrolls.

Again, not a market risk friendly piece of news.

The point of what I'm getting at can all be summed up by Soc. Gen's comments on today's market action...


"I have tried my best to remain relatively bullish towards global emerging markets (GEM) over the recent period despite the global risks, but even by my bullish bias standards, today’s move is simply stupid. EM assets are rallying with a vengeance today, but the timing of that move is just wrong, in my view. Why now, ahead of a massive event risk, namely the results of the PSI released tonight?

It is still unclear whether the outcome for the PSI is going to be a market-friendly one, and in any case, it is not going to be a straight-forward one to interpret for global investors either given the rather complicated structure of the deal. We basically have some serious disappointment doubled with some uncertainty. So unless EM investors know something I don’t—which would indeed make me stupid—today’s move is at best premature and quite a bit far-fetched.

I am happy to participate in this EM rally on Monday morning, once we have got confirmation that the PSI outcome was favourable and that the NFP was risk supportive."

So in effect, there's huge event risk, economic reports that are not favorable for tomorrow's NFP and huge uncertainty surrounding any Greek PSI outcome, yet the market rallies...

Looking at the earlier Market Update showing negative and leading negative divergences, this move DOES make sense to me. If you recall what I am looking for in the market to signal a solid reversal (and recall last night's breadth post that left me breathless), the rally is necessary, a head fake move even more so. So this apparent, "Stupid move" actually does make perfect sense if you read Sunday's analysis of what I was looking for this week to signal the end of the market's move up and a much nastier move down.


ES Update

As most of the averages have stalled since 1 p.m., ES is really starting to look bad...


Market Update

This update is a little more detailed and a little more complicated then usual, but we are at an important crossroads so I'll do my best to make it clear.

 DIA 1 min is the closest to in line out of all the averages and timeframes, there was a negative divergence on the open sending DIA lower this morning and then a positive divergence (remember the 1 min is pretty much intraday moves) sending DIA higher, right now it i in a relative negative diverence here.

 The 2 min chart is still intraday moves, but more influential. You can see where we saw the positive divergence on the expected bounce and yesterday's strange negative divergence around 12-1 p.m. in all of the averages, it created a leading negative environment for the DI which it remains in with a small negative divergence now (or at the time of capture 10 mins ago or so).

 The 5 min chart is more influential and excellent for this kind of bounce we were expecting (as of last Friday and Sunday's analysis). The positive divergence is clear, however yesterday's odd negative divergence again around the 12-1 p.m. timeframe is also clear. This chart is actually leading negative as we have higher prices today, but 3C hasn't made a higher high and remains below yesterday's highs.

 A closer zoomed in view of the DIA 5 min shows a negative divergence on the open sending the DIA lower and a very small positive divergence (white) at the a.m. lows. Right now, We have several negative divergences, not only the larger leading negative seen above, but also a smaller one recently.

The bottom line is that there are negative divergences in to the bounce, which is what I want to see.

This is the ES chart below (E-mini S&P Futures)
At the pre-market highs reached in ES overnight, there was a quite large negative divergence, it is actually leading negative. We saw a positive divergence at the a.m. lows after ES declined more then 8 points from the negative divergence at the pre-market highs, that's a big fall in ES for a short period of time. The bounce of the morning positive divergence is now going leading negative.

 IWM 1 min showing the positive divergence to the left that started the bounce, again the unusual negative divergence yesterday around 1 p.m.  which has kept the IEM in a leading negative position as prices are higher this morning then yesterday, but 3C is still below yesterday's high.

 This is a close up zoomed vie of the IWM 1 min chart, you can see a negative divergence on the open sending the IWM lower, there was NO positive divergence at the a.m. lows today, so the IWM seems to just be floating with the market. The green arrows indicate an in line move (however remember this is within a larger leading negative divergence), this is where it is difficult to understand, but just remember the 1 min chart is intraday moves. As of the capture, there was a slight leading negative divergence building, this can represent a consolidation or a pullback.

 IWM 2 min shows the bounce as all the charts do and yesterday's strange 1 p.m. negative divergence. Note the IWM is in leading negative position with a divergence at the highs of today.

 A closer look at the IWM 2 min chart shows yesterday's strange negative divergence and the leading negative position the IWM remains in, again at the bottom this a.m., there was NO positive divergence.

 IWM 5 min with the positive divergence for the bounce at the left, the negative at 1 pm area and a continued leading negative posture with a negative divergence on the open today, still no positive divergence today at the lows.

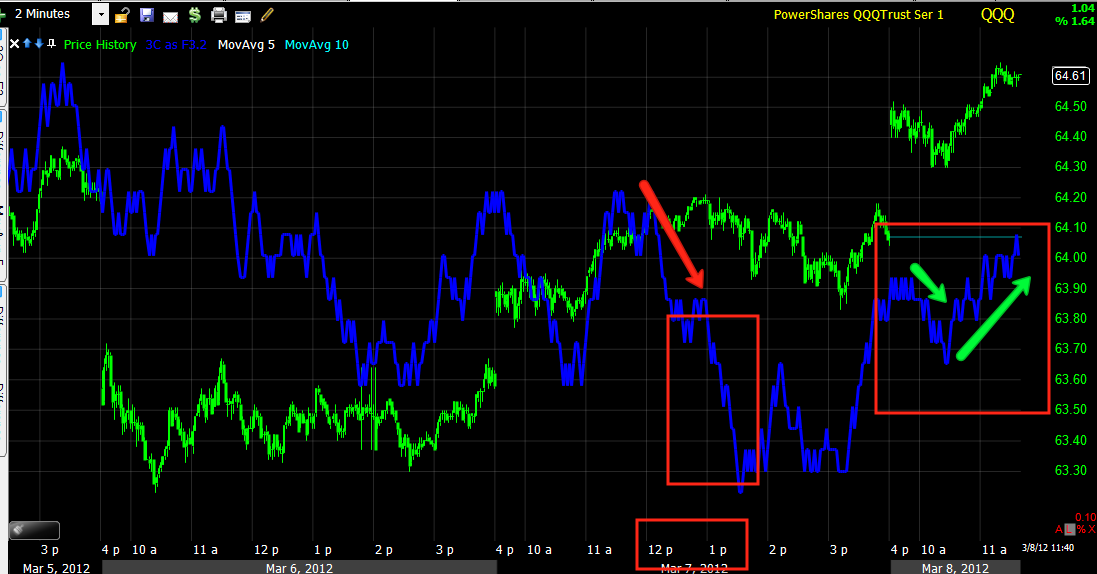
 QQQ 1 min showing the divergences for the bounce up, yesterday's 1 p.m. -ish negative and a stronger negative divergence currently

 The 2 min chart has remained leading negative, even since the bounce started.

 A closer look at the QQQ 2 min

 QQQ 5 min shows the strongest negative leading divergences at yesterday's 1 p.m. area and continuing in to today as 3C refuses to make a higher high.

 A bigger picture of the 15 min QQQ chart, since the top, the Q's have remained leading negative, showing no real positive underlying action at all in the bounce, which is what I expected to see and wanted to see.

 SPY 1 min with the same positive divergence to the left that started the bounce, the same strange 1 p.m. negative yesterday, a negative on the open sending it lower and a positive at the lows sending it higher, there' a slight negative in place.

 Today's action on the 1 min, shows the opening negative, the positive at the lows and the strat of a leading negative.

 The 2 min chart is interesting, since the positive divergence starting the bounce, the leading negative divergence ha just grown, really starting at 1 pm yesterday.

 A closer view of the 2 min, SPY remains in a negative divergence, both relative intraday and leading on a longer term basis as seen above.

 SPY 5 min I think is pretty clear.

 We have had some gap filling, but for a real head fake move, there would need to be a close above the red trendline in any of the averages , this is the SPY.

 The QQQ may be the best candidate for such a move...

 The DIA

 The IWM, I don't think this has much of a chance.

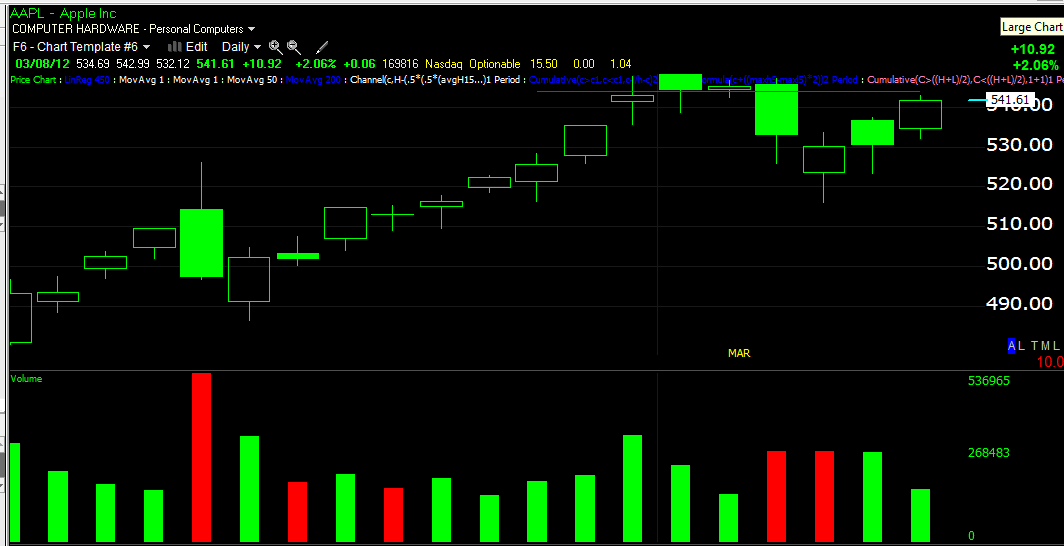
 And here's what it would take on a closing basis in AAPL

As mentioned yesterday, we did see a head fake move Monday a.m. that sent AAPL lower, but I'm starting to wonder if the action since the 15th in the yellow box has indeed been the head fake move in AAPL, a break below the red trendline on volume would confirm this.

In any case, all of the averages are showing very weak underlying 3C readings in to the advance and the market is starting to look more like a small bear flag, meaning perhaps we have already seen the break. The 3C trade shows the weakness in the move since the bounce started.

I'm going to take a look at some other indications and post them.