Thursday, January 29, 2015

Daily Wrap


Plausible deniability strikes again!


This time through a private luncheon Janet Yellen attended with Senate Democrats. Before everyone gets too up in arms as I see some sites are already doing, looking at who Chuck Schumer's top contributors are and wondering (I guess you could call it), whether he let them know what his message "from Yellen" was before divulging it in an interview. Yes, this does have the appearance of impropriety and rightfully so, an independent F_E_D chairperson shouldn't even give the hint of impropriety (considering some of the most profitable traders are Congressional staffers), however to be fair, Yellen has attended numerous private events with both Democrats and Republicans including luncheons like today with both sides, not that I think this is the kind of behavior a F_E_D chairperson should engage in, it just doesn't look good.

Many were wondering, after yesterday's more hawkish than usual F_O_M_C policy statement, which F_E_D member would be out today to walk the market back from the edge, the obvious choice would be Bullard, but it appears to have been Yellen herself, however as we have been pointing out since Bernanke was doing it (or Greenspan with his "Greenspeak"), the statements they make or the way in which they do it, they ALWAYS maintain plausible deniability. I can't remember the specifics but I think it was around the change in F_E_D guidance from Qualitative in which actual dates were given to Quantitative, which as I pointed out at the time, are very ambiguous, they can be made to reflect anything you want, they don't hold your feet to the fire like a quantitative guidance which is derived from qualitative guidance anyway.

From what I recall, this was disclosed first in Bernanke's presser after the F_O_M_C and then more specifically in the release of the minutes from that meeting. Just like now, the minutes and change in guidance came off super hawkish, introduced uncertainty which the market hates and had a bad reaction.  If I remember correctly, it was after the close the very same day the minutes were released that Bernanke made a statement that was ambigouos, but gave the very specific impression of a much more dovish stance than what the minutes disclosed, then later when the F_E_D did exactly what the minutes suggested and the opposite of the impression Bernanke gave the day the minutes were released in walking the market back from the edge (after the close), Bernanke made clear, "I never said any such thing" and just as I warned the day he said it, "It was plausible deniability", he was doing what Cramer talked about in the infamous Street.com interview (the one he wishes he never gave). Bernanke created an impression, but in a very ambiguous way that later allowed him to deny he said any such thing which is exactly what he did and he was right, he didn't say what the market had "INTERPRETED, although that was his intention... he left enough room for "plausible deniability".

Now in some ways I agree with the more "conspiracy minded", I've NEVER heard of F_E_D policy being disseminated through a private luncheon by politicians the day AFTER an F_O_M_C meeting that created a very hawkish tone. IN FACT, I'VE NEVER HEARD OF F_E_D POLICY BEING DISSEMINATED THROUGH PRIVATE MEETINGS WITH POLITICIANS EVER, it runs contrary to the F_E_D's  supposed independence...Heck, they barely give any useful guidance at the twice a year public Humphrey Hawkins testimony in front of Congress.

So, the appearance of Yellen today and certainly the "spill" of F_O_M_C policy is WAY BEYOND coincidence and the more conspiracy minded are right in having anticipated some speaker to come out and walk back the market from yesterday's hawkish tone.

Apparently the comments that are now being taken as Gospel as far as F_E_D guidance, which came from Chuck Schumer and was,

“Her message is that the economy’s getting better but there’s still a ways to go in terms of job creation,”  “That worry seems, in her mind, to be paramount and that’s why she is not going to raise rates immediately.”

Beyond the ambiguity of the statement itself with words like, "seems", "in her mind" as opposed to the full voting F_O_M_C and of course "Immediately",  as you know the F_E_D can call emergency intermetting- meetings.

Okay, lets walk back from speculation and emotional biases. The F_O_M_C policy statement was clearly hawkish, I warned before hand that the removal of the "Considerable Time" phrase alone was enough to make the market take a step back and view it as troubling. 

The best possible definition regarding "Patience" as it relates to the timing of rate hikes we have was Janet Yellen on record, not off record at a private event with information passed on second hand, but during a F_O_M_C presser by Yellen herself. The term "Patient" toward the timing of a possible rate hike was a "Couple" of meetings, when pressed on the definition of "a couple", Yellen said a couple is, "2". Thus, as best as we have it officially from the mouth of the horse in an official capacity, "Patience" has been best defined as 2 meetings.

The removal of "Considerable Time" was done for a reason, it implies more than a "couple" where as "Patient" could mean anything from the next meeting to a year away, "Considerable Time" has considerably longer connotations and thus there was a reason it was removed from yesterday's F_O_M_C policy statement in a "slow-boil the frog manner. First the term "Patience" or "Patient" was added to the "Considerable Time" and then "Considerable time " was removed and "Patient" replaced it in an otherwise, hawkish statement, thus it was taken hawkishly.

Carrying on with what we "KNOW", we know that, "Solid Job Gains" was upgraded to, "Strong Job Gains". Economic Activity was upgraded from a "Moderate Pace" to a "Solid Pace".

As pointed out last night, the economic data for 2015 is hardly deserving of an upgrade since the last meeting, see last night's Daily Wrap in which the Bloomberg Macro-Economic Negative Surprises were at the worst start of a year in more than a decade! While I can't take issue with job gains, we do know via recent earnings that there have been thousands of corporate layoffs, yesterday's Dallas F_E_D showed 11% of respondents had lay-offs. The strong dollar, as mentioned last night does not look to make things better and although things may change, I don't see the mechanism in which the Dollar will moderate against the Euro and Yen especially with ECB and BOJ QE.

There were no hawks dissenting from yesterday's policy so I'm guessing that there wasn't anything that they were too upset with, especially as the "Considerable Time" language was removed, which for the market, was synonymous with, "Not for a while still".

I don't pretend to know when the F_E_D will hike rates, I'm looking for evidence as you know now via the bond market, but I do know that today's Schumer circus was the biggest and best example of the plausible deniability scam we have ever seen by a F_E_D member. Not only was this a private LUNCHEON with absolutely no minutes or record of what was said, the actual market moving information came from a second hand source repeating his "interpretation" of what he heard. Yellen could raise rates tomorrow in an emergency meeting of the F_E_D and have the easiest time ever denying that she said anything of the sort, maybe something like...

"Yes I attended a Democratic luncheon as I customarily do with both Democrats and Republicans and we did talk about some of my views and concerns which were also made public in the F_O_M_C policy statement the day before so no special information was given. In no way did I give any guidance on when rates would rise, in fact as you know the F_O_M_C is made up of  12 voting members and the remaining non-voting regional F_E_D bank presidents not only attend the F_O_M_C meeting, but participate in and contribute to the shaping of F_O_M_C policy. So even if I wanted to give specific guidance to the members of the Senate Democrats which would be improper, it would be impossible for me to do so because I am one of 12 voting members and many additional presidents shaping policy. I can't take responsibility for what Chuck Schumer may have thought he heard or how he interpreted the diverse subject matter of the luncheon."

In other words, while expected, this was the largest set up of plausible deniability ever given by a F_E_D member or chairperson, not only was it an unofficial gathering with no minutes or evidence of what was discussed, but the words/message didn't even come from her mouth like Bullard, but rather a second hand source and politician at that. That is  Plausible Deniability which is how the F_E_D works in creating an impression without committing to a stance.

In any case, the market today was essentially no different from our forecast for the day in yesterday's Daily Wrap which was specifically,

"All of the averages ended the day like this so they "should" pick up where they left off on the intraday charts and see some continued negative action tomorrow morning...Price Down/Volume up, which is essentially like seeing a Hammer candlestick on a daily chart on 3x average volume, it's a 1-day short term deeply oversold condition that suggests the next day close green...SO I EXPECT THERE TO BE SOME BOUNCE TOMORROW PERHAPS AFTER SOME EARLY MORNING WEAKNESS"

After this morning's weakness which sent ALL major averages below the level at which QE3 was discontinued, we saw the early morning weakness burn-off, almost exactly when we predicted which was after the 11:30 European close, we saw numerous divergences (positive) building and the market move higher exactly as we forecasted yesterday with ALL of the major averages closing Green EXACTLY as forecasted yesterday.

We had early weakness as expected, then shortly after the European close as intraday positive divergences built we headed higher with the Dow leading 2 +1.31%, the R2K just behind at +1.28%, the SPX and NDX close to +1% and transports +.60% despite the fact that the Baltic DRY Index was down 5% to 632, the lowest level in  29 years!

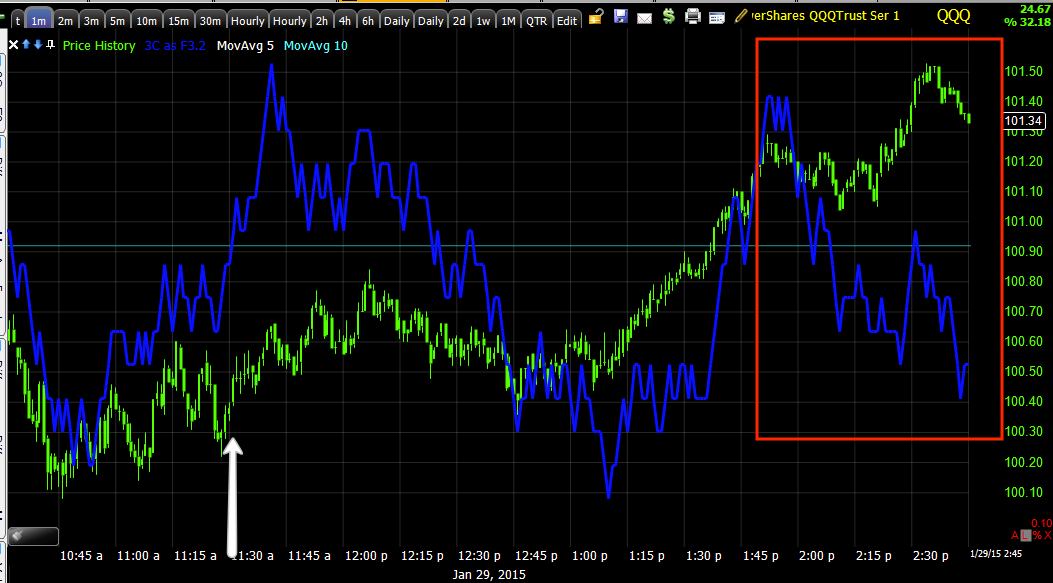
Looking at the chart, you'd hardly know there was a F_E_D "message" today beyond the expectation we already had last night for the market today; it would be challenging to pick out the exact spot Schumer's interview hit the wires.

However all of the averages that did move to red intraday vs the end of QE3 (as most were there yesterday), all moved green since QE3 ended by the close today.

Gold as we have been expecting or GLD, pulled back GLD on Track and closed down -2.16%, we still have further to go and SLV was smashed at -5.75%.

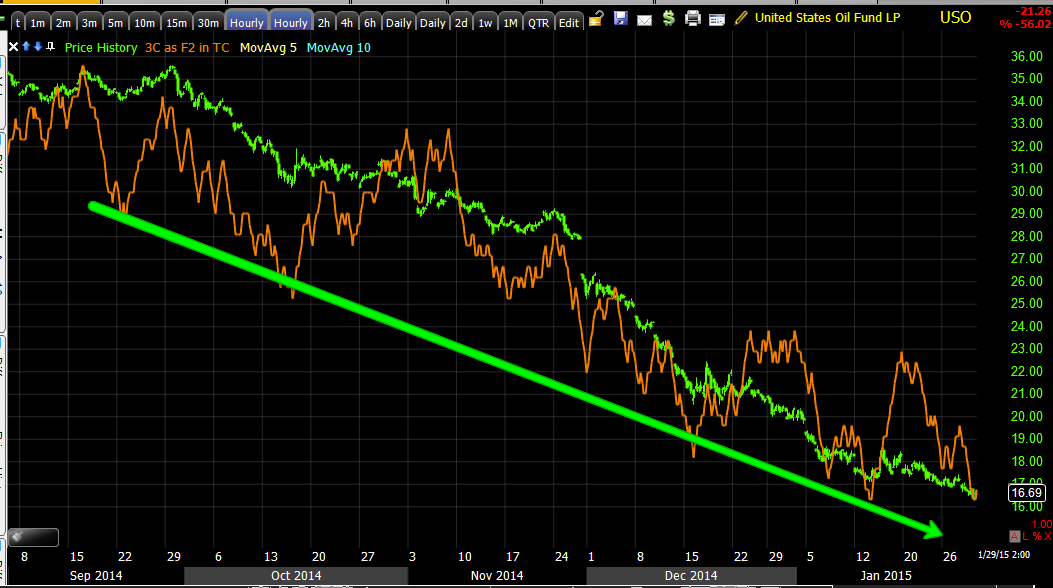
After today's apparent continuation of a head fake move below USO's range, setting a new intraday low, USO closed higher at +.72% as we have expected and we expect more as you know, USO Update & Effects.

As for Leading Indicators, VXX outperformed its correlation vs the SPX intraday, TLT underperformed after yesterday's big short squeeze on the long end of treasuries causing a divergence with yields (see below)...

Despite the longer, bigger picture signals from HYG (High Yield Credit ) 3C charts which are falling apart, Closer to a Bounce Intraday, but Closer to the End, as I posted earlier today the HYG 1 min intraday chart was in line and it played no small role in propping up the market today...

HYG vs SPX clearly leading intraday, but once again, the more important information is on the HYG charts right here, Closer to a Bounce Intraday, but Closer to the End.


Although Yields led as they should early in the day, by 2-2:30 they diverged, not in a huge way, but we'll see where it leads...
30 year yields (red) vs SPX (green) saw early support for the market as expected, but then the SPX diverge from bonds' reality.

Interestingly the same thing happened in Pro sentiment, early support, late day divergence (negative).

Also of some interest, at least on of the HY Credit assets pulled a similar divergence...
Early, but brief strength followed by HY credit's unwillingness to follow the SPX higher in the afternoon. I don't think this is the kind of ground-breaking divergence I'm looking for, but judging by HYG's 3C charts, we'll likely be there very soon. 

The Dominant Price/Volume Relationship today was Close Up/Volume Down, this is the most bearish of the 4 possibilities, often it results in a 1-day oversold condition with a red close the next day, the exact opposite of last night's P/V Dominant Relationship.

Perhaps just as interesting, all 9 of 9 S&P sectors closed green with Consumer Discretionary leading at +1.36% and Energy lagging at +33%. Of the 238 Morningstar groups I track, a whopping 209 of 238 closed green, this looks like a strong 1-day overbought condition that would normally close the market red the next day.

However, tomorrow is an op-ex max-pain pin day, which should open around today's close and hang around that area until about 2 p.m., I'll be watching intraday charts for any additional directional information.

The averages closed out the day mixed as far as 3C divergences, the SPX looks like it should continue higher in the morning while the NDX and IWM look like they should see some downside, but again I think the Op-Ex pin will have the strongest influence on early price.

As usual, the last 2 hours of the day as the market un-pins, give us the best 3C data for the week.

As far as Index futures go, I'll have to take another look later tonight and if there's something there I'll post it, but for now, the positive divergence in all of them from earlier today that sent them higher is seeing a 1 min negative in all 3 majors, so I'll be interested to see if it sticks around, just as we caught a major move in 3C at 1:15 in the morning leading to some dramatic losses.

 ES leading negative right now after a positive earlier today.

NQ doing the same pretty dramatically

And TF following suit. I'll check them later, I would tend to doubt a sharp sell off, but we have seen aggressive selling in to any price strength all month.

Talk to you soon, have a great night.


Quick EOD Update

From the looks of things, today went off exactly as expected. I think the highest probabilities for tomorrow largely based on experience of Op-Ex Friday's is an opening pin close to today's close in the averages that holds in that area for most of the day until about 2 p.m. when the pin tends to be released, price action can go either way, but the last 2 hours of 3C data provide some of the best of the week.

I'll be looking for anything that is standing out and post it in the Wrap tonight, but this wasn't a big enough base to do much on the upside, it is the right size for an oversold condition which we had yesterday.

Beyond that, HYG is giving hints, the rest of Leading Indicators, breadth and the analysis in Bonds should be the most enlightening.


Market Update

Thus far the 3C concept of 3C/ price action picking up where they left off (the next trading day) which forecast yesterday that we'd see early market weakness and the Internals that we track posted in the Daily Wrap yesterday suggested that the morning weakness would morph in to afternoon strength and likely close green on a deep 1-day oversold condition, have been right on. Even the projection of this transpiring after the European close (which is just something we observe often) was correct.

I do see some distribution in to higher prices, perhaps these may be "steering" divergences for tomorrow's max-pain options expiration pin. Typically the max-pain op-ex pin of Friday (weeklies) is somewhere very close to Thursday's close, thus these negative divergences that are seen since we've turned green on the day, may very well be related to max-pain op-ex pin positioning, although the other possibility is the "selling in to any price strength". I tend to lean toward the former over the latter, the simple reasoning is we haven't really sen any price moves that would be significant gains worth selling in to yet.

In any case, here are the charts showing what we've been expecting to happen and what is happening...

 IWM 5 min intraday positive divegrence

IWM 2 min intraday positive divegrence, this is exactly what we forecast yesterday for post-A.M. market action today.

However, as you probably know, ANY new trend starts on the fastest charts which is the 1 min chart, thus the afternoon move higher is seeing some light distribution. I mentioned a couple of possibilities above, although I suspect this is more likely a "steering divergence", essentially not letting price move too far away from what will likely be tomorrow's options expiration maximum pain pin of prices, which causes the most number (dollar amount) of options to expire worthless.

 QQQ 5 min intraday positive as expected on an oversold basis as of yesterday's closing internals.

 At the white arrow, price action becoming more positive after the European close and the same intraday 1 min negative divergence right now, you know what I suspect it is.

 We even have it on a QQQ 2 min chart.

If this negative were to get a lot worse, then I'd be looking at a different scenario of a FAIL of this oversold bounce condition, but we're not that deep in to it yet.

SPY 5 min hasn't posted any divegrence, it's just in line, thus it's not a strong move , really it can't be too strong on a half a day's base, but it shows weaker relative underlying performance than the Q's and IWM, perhaps the SPY will lag.

But we are seeing the same 1 min negative, the green arrow is the European close.

As for TICK...
 You can see the up channel on the averages' move higher and the break below that channel where the negative divergences are forming on intraday charts, so far they are pretty mellow around -500 to -750.

This is my custom TICK/SPX indicator, you can see in yellow yesterday's 1-day oversold condition in the capitulation event and today's positive movement in intraday breadth via the tICK reading.

This is just showing the nature of a capitulation event which is a fractal concept, we see these on intraday charts like this or daily, even monthly, it's good to know what they look like as you'll know what the near term probabilities favor next. Typically volume increases on these oversold events as well.

 HYG 1 min remains in line, it seems it is helping with some support here, but the charts that I showed earlier are still in effect...

HYG 3 min leading negative.

The point here being that the ramping lever is seeing what appears to be money backing out, no longer willing to take on risk as they likely don't want to get caught long when the music stops and can't find a chair, this acts as a fantastic leading indicator, especially when HYG's price itself starts diverging with the averages.

Right now I think we have a fairly decent handle on the short term action and even the short term cycle that started 1/14-1/16, but there's something more important I'm using some of this downtime as the market is doing what we expected, to look in to.

This is the hawkish F_O_M_C statement and the divergence between that and traders' perceptions as they are pricing the first rate hike out further, for instance the F_E_D Funds Futures are pricing in a 14% chance of a June rate hike where as it was 25% last month. Many "experts" are saying there won't be one this year, however I think the bond market may have insight in the apparent divergence between what the F_E_D has said, is saying and what certain individuals are perceiving.

I don't want to just post opinion, I want to post objective, unbiased evidence, this is what I'm looking in to with Treasuries most specifically.

We had 2 auctions today, a 5 year with $35 bn worth of T's up for auction, the high yield was 1.288%, below the When Issued of 1.295% and below last month's 1.739%. Indirects (foreign bidders) took down 63% vs the 4 auction average of 55%, this was the lowest 5 year auction yield since May 2013 and another strong auction on top of yesterday's 2 year.

The second auction 90 minutes later (today) was $29bn in 7 years, they were a bit different with the high yield at 1.59%, above the when issued of 1.586%, the high yield of 1.59% was lower vs last months at 2.13%. Indirects took down 56% vs the 4 auction average of 50.4%, not as strong as the earlier auction and yesterday's.

It really has been the TLT signals though that have been bothering me the most, I knew I should give them some time and I'm glad I did, but now we should be able to get some information that is truly useful as to what the market is really pricing is vs the talking heads.


The second was a 7 year auction with $29 bn in T's

USO Update & Effects

First we'll take a quick look at USO's charts, I still like this one for a bounce that likely turns short squeeze, which means we may have to consider some other possibilities related to such a potential outcome.

 USO 60 min with two candles VERY close to a Harami (bullish) reversal pattern, plus the increased volume is common at a reversal area.

This morning's weakness looks to be similar to the averages on this chart, 3C picking up the next day where it left off at the close which was negative, but...

 As you see, it looks like that was used to someone's advantage as the intraday 3 min chart is leading positive

As is the 5 min intraday

And the 5 min trend is still very much intact.

Remember, based on these charts that have a positive divegrence out to about 30 minutes, I think we get a surprising bounce in crude, it would seem likely to trigger a short squeeze, but I do not see it in any way as a primary trend reversal, more what I'd call a counter trend rally/bounce.

The 60 min chart shows no evidence of anything other than primary downtrend confirmation, this chart would need a significant base and positive divegrence before I'd even consider a trend reversal, it's not there.

However, even though I don't see much in the Energy (XLE) charts that excites me, it would stand to reason that some of the badly beaten down energy names would trigger a short squeeze, we saw that earlier in the week, I believe Monday as Energy led the 9 S&P sectors and we had a strong short squeeze in Energy stocks, this could of course effect the broader market. I can't say specifically it did on Monday as the Russell 2000 was already forecasted to lead the averages as of Friday's Week Ahead post and the other averages were rather flat, but it is something to consider.

Also worthy of consideration, even though it is early as we have a couple of hours left, the forecast for an oversold bounce from last night (afternoon strength to develop)...
Daily QQQ chart with a bullish Hammer candlestick, almost a bullish Harami or Inside Day as well. I suspect volume will be higher today which would also be bullish.

Just don't forget what those HYG charts looked like, that should give you some ideas of how you can use this as a set up for several different positions whether a piggy back short term long or letting the short trade come to you.


Closer to a Bounce Intraday, but Closer to the End

The forecasted afternoon bounce on an oversold basis that was expected to proceed A.M. weakness, based on where the 3C charts left off at the close, looks closer than ever right now (intraday), here are a few signals in addition to what I've already posted...
 ES/SPX futures intraday positive.

As you know, I often find early or cleaner signals in the leveraged ETFs, take SPXU above for example which is a 3x short S&P-500/SPY, being this 2 min intraday chart has a negative, it suggests a short term pullback, being it moves opposite the SPY, that would be confirmation of the SPY intraday bounce expected.

The IWM intraday 2 min positive along with TF futures intraday positive and...

An intraday 1 min negative in SRTY, the 3x Short Russell 2000, again being it moves opposite the R2K, it's another confirmation signal.

I'll point out that right now and as expected, these are all weak signals that fall along the lines of the 1-day oversold condition/bounce laid out last night.

One group I think might be worth a look is Financials. I do like the look of the Financials Short position and a bounce in XLF/Financials would allow the trade to come to you.

As far as the larger picture in financials and the highest probabilities based on the charts...
Well this 60 min XLF/Financials 3C chart is not pretty. Note not only the large relative divergence from the left side to the right side of the chart, but the more recent leading negative divergence to the right, thus a short in to some price strength would seem to be worth a close look. 

As for the second part of the posts' topic/title, HYG 3C charts have been one of the easiest giveaways of what the market is moving toward. Yesterday I posted a series of the HYG charts, the asset looks to be clearly falling apart as it typically is used as a market ramping lever as HY Credit tends to lead and stocks follow. Thus the charts below are suggesting HYG is about done and close to a move lower, again, HY credit tends to lead, stocks tend to follow...

 HYG intraday- nothing exciting, but after the 1 min chart...

HYG 2 min from the last small base/cycle (1/15-1/20).

The HYG 3 min chart with 3C migration at the same cycle with the same leading negative divegrence now...

And the 5 min chart showing the same.

As well as the 10 min chart.

As for HYG's longer term trend which has been making a series of lower highs and lower lows, a downtrend....
The 60 min chart, I expect HYG will on be heading toward a new low and dragging the market lower with it as it isn't providing that ramping support that we so often see.


GLD on Track

The February 20, $121 GLD Put tracking position is moving closer and close to the gains expected as GLD looks to be clearly pulling back as expected.
 The 10 min GLD chart that has been suggesting a very clear pullback in GLD.

And on the daily chart, it looks like GLD has broken free of the reversal process zone (top) in yellow and is now clearly pulling back as was expected based on the chart above.


As has been posted in just about every GLD update over the last several weeks, I'll be watching the pullback for signs of what I'd call a "Constructive pullback", one that at some point is being accumulated for a new leg higher as there are some longer term charts suggesting GLD is set to make such a move. The beauty of the pullback (possible) trade is that price has to come to you rather than you chasing it and it has to prove itself by confirming a constructive pullback that has been accumulated. So we may have a longer term long gold position as the pullback unwinds, we'll see if those positive divergences show up as G:LD pulls back, but for now the Feb 20th put position is very close to going green.


Intraday market update

The following is from last night's Daily Wrap. I typically cover market internals toward the end of the Daily Wrap and often we'll have an extreme scenario which gives us pretty good short term foresight and forecasting probabilities, for example from last night....


"Internals are very interesting and also suggest an oversold bounce on a short term (1-day) basis.

There's not a Dominant Price/Volume Relationship in the Dow, it's split so we'll pass, but in the Russell 2000, SPX and NDX, there is with 1084 stocks, 325 stocks and 69 stocks respectively, this is a VERY strong Dominant Price/Volume Relationship and guess what it is...?

Price Down/Volume up, which is essentially like seeing a Hammer candlestick on a daily chart on 3x average volume, it's a 1-day short term deeply oversold condition that suggests the next day close green, similar to last night's which was on track until the F_O_M_C.

Additionally making it even stronger, of the 9 S&P sectors, all 9 closed red, that's Dominant. Tech which was just the laggard a day or so ago led at -.17% and Energy which was the leader just a day or so ago was the laggard at a deep -3.94%, I think the only reason it led a day or so ago was the short squeeze which was primarily in Energy names.

Making the relationship even more potent is the 238 Morningstar Industry and sub-industry groups, only 15 of 238 closed green!!!! AGAIN, A HUGE OVERSOLD SIGNAL, SO I EXPECT THERE TO BE SOME BOUNCE TOMORROW PERHAPS AFTER SOME EARLY MORNING WEAKNESS, MAYBE WE CAN FIND SOME INTERESTING OPPORTUNITIES TO TAKE ADVANTAGE OF THIS SIGNAL THAT'S STANDING OUT."


The "Early morning weakness" was bases on the 3C charts at the close and the concept of 3C picking up where it left off the next trading day (cash market), which suggested early morning weakness which is what we've seen.

However, being internals suggest some strength to build in after the morning session, it would be reasonable to expect it after the European close which is often an area of intraday trend change.

Here's what I've dug up thus far suggesting the market is working on that oversold bounce intraday. First the averages...
 DIA intraday 1 min positive building...

SPY intraday 1 min, not quite positive, but an improvement.

The same with the QQQ 1 min

And a relative positive in the IWM 1 min

As for the Index futures, they show a little more clearly the signals.

 ES 1 min

NQ 1 min

TF 1 min- all intraday positive and continue working on the divergence.

The custom SPX:RUT Ration is also showing a positive divergence.

As is HYG vs SPX.

And TLT vs SPX as it is weaker than it should be (SPX prices inverted), this means yields are leading the SPX.

And Pro sentiment intraday is positive vs the SPX today.


As suggested because of weaker treasuries this morning, yields are leading which helps the market in case of the expected bounce.

You can keep an eye on the NYSE TICK (intraday) as well for some early warning signals, but other than day trading , I don't see this as any big opportunity right now, in fact it gives me some time to look at some more important components of the market.