Friday, June 17, 2011

Member Success Story

Last night I published my target for the SPY's closing trade today, as you know.


I encourage and try to help members find trading strategies that are a fit for risk tolerance, trading style, portfolio size, time you can commit to the market, etc. It's very important to take the ideas here at WOWS and make them your own, I'll always be available to help. 


I post a lot of different ideas and information because we have a lot of different traders. One of our members sent me this email after the market close today.


"Hey great call on the SPY!!!!!!... after reviewing what you had said I found it to be very logical.  I set up an Iron Condor 127/128 and monitored all day. Came close to the lower limit but still far from break even!! You just made me a cool $1000. Have a great weekend Brandt!!!"


I'm not a huge fan of trading options, but this member saw an opportunity in the information and applied it to his style of trading and I hope he'll celebrate and have some fun with the money this weekend. More importantly, I didn't make him the money-HE MADE IT and should be proud.


This is a perfect example of what I envision for all Wolf on Wall Street members. While I offer trade ideas and other information, I don't want to be a crutch, but a vehicle that helps you transform your trading to not only be profitable, but exciting and fun. 


I guess it's best summed up in you can give a person a fish or teach them to fish. I hope you find in your experience here at WOWS that you come away with a better understanding of the markets, some good insight and ultimately that you make these trades and ideas your own.


In that post I was trying to convey how Wall Street manipulates markets and burns a lot of option investors, but our member took the information and used it to take some money out of the market-WITH OPTIONS! I'm really happy to hear it and all of your success stories. 


In the end, we are a pack of students of the market, adapting and moving forward. I'm here for you any time, but I love to hear when you make the trade ideas your own.


Congratulations CM-a very well played trade!

And There You Have It!

Last night I posted this "$127.25 Just About the Perfect Close For Tomorrow?"

So I was off by $.20 cents, but the effect was the same (see the linked post above)-The $127 puts which had the highest open interest were pinned and expired worthless as the SPY closed at $127.05.

The $128 calls, and today we hit a high of $127.94, also with the highest open interest, expired worthless.

How was that for a prediction?

As I've said many times, I only prefer options for short term trades and this is exactly the reason, most options will expire worthless.

Looking ahead to next week, we still have some very strong positive divergences and I've sen them in quite a few stocks. If the Greek debacle on Sunday doesn't explode, the market stands a chance of finally bouncing now that OPEX is behind us.

Did you see that end of day recovery in URRE featured today in the afternoon? It was down 6% and closed in the green!

You know me, my work is just beginning. I have a lot of internals and charts to look at plus some scans to run so check back for updates. Otherwise, everyone have a great weekend.

Going in to Monday

Today's trade is about what I expected yesterday, it looks like a lot of options will be pinned as is usually the case.

I see some strength in various stocks and averages and am looking at cautiously going long today in the following ETFs until we see if the bounce takes hold and where it appears the drive will come from, I suspect financials will be important.

 FAS-3X Bull Financials  NOT FAZ!

 TQQQ Ultrapro NASDAQ 100

 UDOW UltraPro Dow-30

UPRO UltraPro S&P-500

I like these for broad coverage and they are meant to be shorter term trades so if the bounce materializes, I have a day to figure out what sectors look like they'll lead.

As I said, I urge caution -this is no time to swing for the fences with the Greek/Sunday event which is a coin toss, but these ETFs have been looking good and any bounce that takes place, should be pretty decent in size and time so I don't think I'll be left behind by being a bit cautious.

One To Watch

URRE is engaged in mining of Uranium ; their primary customers are utilities that use nuclear power.

 After the Japanese earthquake, URRE took a big hit.

 Since then, the daily 3C chart has been very strong. I don't think the world is just going to stop using nuclear power and this reaction to Japan might be creating an opportunity in URRE. This is a very strong daily chart.


 Today URRE broke support, we see this a lot (false breaks) before a reversal.

 The hourly chart is positive.

 The 15 min chart is positive

 And the 1 min chart on the break today is positive, suggesting the break of support may be under accumulation.

This is another stock that I would set an alert on, maybe price passing above $1.47-$1.48 might make for an interesting entry in URRE.

It's a low priced stock and thus speculative, but volume is pretty decent and its optionable.

Beyond Coincidence?

As you know, I've been thinking today would be a pretty rangebound day, causing a slew of options to expire worthless. The reasoning continues that early next week we could finally see that bounce with OPEX out of the way.

This morning it's reported that Germany's Angela Merkel essentially caved in to French and ECB demands regarding the voluntary restructuring of debt as to not give rise to a "credit event", this was a major change of heart for Germany.

Papandreou announces a reshuffling of his cabinet.

Now this just breaks on Reuters...

Essentially the new finance minister tells Reuters that they have an austerity package that has passed committee and is expected to pass parliament. There are some major changes in the package and Greece is expected to seek EU Finance ministers approval on Sunday.

If the EU caves into the new Greek austerity measures, then the former seemingly impossible impasse, may just make it through. Wouldn't that be something to hear Sunday that the Troika accepts Greece's new plan and a deal is essentially done.

It would seem unlikely given the demands of the Troika, but there seems to be too many coincidental moves in play. It's certainly eyebrow raising and it's hard to imagine a cabinet reshuffle one day, a plan that will pass Parliament the next day and Greece seeking the approval of the EU on Sunday, of course before the market opens.

GOOG and OPEX

Personally I don't like trading options unless they are for short term moves.


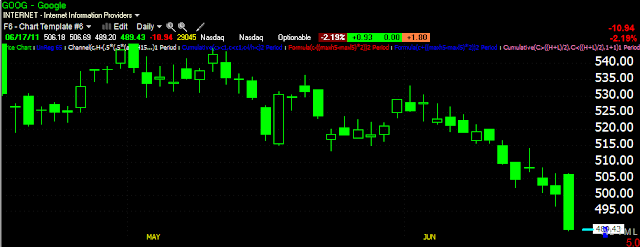
Looking at the GOOG chain for calls, with the largest open interest at $510 and then $500 with big volume in the $500s today, is it any wonder GOOG is trading like it is?


Current price-$489.59-both the $500's and $510's are smoked.

Market Update

 DIA 1 min

 Continued negative divergence in the short term 1 min 3C in the Euro

 QQQ 1 min positive divergence-this one looks the best for a possible quick intraday trade up.

SPY 1 min

All in all, I expect the market to remain choppy today. With pressure still on the Euro I don't see any of these divergences as carrying the averages too far. If you are trading intraday, it's going to be a tough market with the choppiness and the OPEX.

EEE Trade Idea (Long)

This is a speculative trade, but EEE can move. The last run on a positive divergence was in December of 2010 when it ran over 700%.

Volume is low now, but during that run it was hitting 9.6 million shares a day.

 Here's the triangle with a slight break, usually a good timing indication.

 On the daily chart, this is the first positive divergence of the year, you can see the 2010-2011 run to the left.

 On the break below the triangle it looks like there's some accumulation in the white box on the 5 min chart.

 The 10 min chart shows the same.

Still, this is a speculative trade and I want it to show me something before I get too deep into the trade. I'll be setting an alert for a breakout of $1.90.

If you don't have a charting platform that allows you to set alerts, check out www.FreeStockCharts.com ,
the data is true real time there and it's totally free.

FSIN Follow Up

FSIN drops another 9% today, bringing the trade to a gain of 39% in a couple of weeks.

I'm tightening up a stop for taking some partial profits, this is the Trend Channel set to 60 mins with a current stop around $4.90, it should keep tracking lower, but I think partial profits on an intraday stop of the Trend Channel make sense as FSIN is reaching oversold levels.

GLD Update

I mentioned the volatility squeeze in gold yesterday, but also warned to beware the first move out of that consolidaition. 3C  1 min has been negative on GLD all morning, as of now, GLD has retraced 50% of today's move up.

I don't think longer term conclusions can be made at this point, but this is a 50% retrace of today's move in GLD. Whichever way the market ultimately takes gold, they are still going to play the game. We should have better visibility within the next trading day or two as the 3C charts catch up to the changes from yesterday's margin reduction and today's "Safe-Conflict Free Gold" provision.

Euro-Dollar-SPY

Here's the Euro ETF in green, last update looked like it was getting ready to fall, which means the Dollar Index rises and most inverse correlated assets including equities and PMs typicall fall. The SPY is in white.

This may give you a few short term intraday trade ideas using Leveraged Bear ETFs. I personally would close them by the end of the day though. As you know, my current line of thinking is the market calls are going to be pinned, the SPY should close below $128. However, the longer term charts still look very viable for a bounce. That could come Monday although I want to be a little cautious holding to big of a long position over the weekend (which I would only establish toward the close today)-remember Greece is out there and the news is flowing fast. If the market sees strength on Monday on a bounce, you can always add at that point. The 60 min positive divergences in the SPY and many others like financials would suggest any bounce would be considerable. Rule #1 is always risk management first.

EUR/USD

It looks like the Euro is near a short term decline and the dollar a short term bump up.

 FXE (EURO ETF) in a nasty 1 min leading negative divergence

 Even the 5 min chart failed to confirm the gap up.

 UUP (Dollar Trust ETF) is positive and leading on the 1 min.

There's also a positive relative divergence in UUP on the 5 min 3C chart.

Correlations between the dollar and the typical inverse correlated assets have not been as strong recently as they were in months and years past, but a move up in the dollar certainly does have the capability of putting pressure on equities, commodities and of course precious metals.

As of now, GLD still hasn't been able to push through that gap resistance I showed you earlier in the GLD/gold update.

FAS Chart Request

I'm going to update all timeframes for FAS (Financial Bull leveraged 3X)

 The 1 min chart remains negatively divergent. There may be some institutional distribution here or via specialists to keep FAS from prematurely reaching $24, as the $24 Calls have the highest open interest-perhaps it's being pinned for OPEX today?

 Moving into the longer intraday timeframes, things start to look a lot better. You can see 2 areas of accumulation, both at the lows on the 5 min 3C chart.


 The 10 min chart confirms what we see on the 5 min and is also in a leading positive divergence.

 The 15 min chart again shows more confirmation of accumulation at the lows and a leading positive divergence.

 The 30 min chart is where it gets really interesting, this is a very strong 3C chart in an important timeframe. It also happens to be in a leading positive divergence.

 And finally the 60 min chart (the most significant of the intraday charts) is looking very strong with several areas of accumulation. This is one of the reason I'm thinking that after the options are pinned today, we have a fairly reasonable chance to see a significant bounce. Many of the market averages look the same.

This is a daily chart of FAZ (the financial bear 3x leveraged) and as I pointed out last night, this is ultimately where I want to be.  I'm excited about the prospects of playing a bounce in FAS , but ultimately the disposition of the daily chart of the Bear ETF shows the path of least resistance looking at the longer term, meaning after a potential bounce in FAS, I want to be looking for an entry in FAZ as the market overall is in a very bad place. A Bounce is one thing, but the overall trend will ultimately be where the real money is. I just don't want anyone to be confused about my position-short term I'm bullish financials for a bounce, but longer term I'm bearish financials for the continuation of the trend after  bounce.

GLD Update

 GLD 5 min is still in confirmation with price.

 GLD 1 min 3C has not strengthened to this point.

There's some gap resistance coming up shortly, this is an area where some key underlying behavior may come in to play.

The Q's and OPEX

 The Q's are significantly underperforming the SPY/DIA (note the SPY keeps backing off the $128 level)


Look at where the heaviest open interest and volume are in the QQQ Calls, that may explain the weakness.

CRUS/SINA Follow Up

CRUS and SINA were also June 7th trade ideas on the short side.

Here's the current stop
CRUS is down 10%. The current stop at $14.65, again the Trend Channel has held this trade very well. All Trend Channel stops are on a closing basis unless otherwise noted.

SINA has had a great move thus far- 25%. If you are Swing Trading either or any of these positions, you'll want a tighter stop, just email me for swing stops.


If you have Telechart, StockFinder or TC2000 I'm happy to share the formula with you.

PANL Follow Up

On June 7th I listed several short trades -PANL was one of them.

Take a look at PANL as of today...
PANL is down 14.36%

If you are in this trade, the 1 day Trend Channel has held the trend well, the current stop would be around $38.00

Only Two Economic Reports Due Out Today

The University of Michigan Consumer Sentiment Report came in at a miss of consensus, coming in at 71.8 -consensus 74 and last reading 74.3.

The second report, Leading Indicators  came in at .8% with consensus at .3%.This index is based on information for May so the UM report is a bit more accurate as it reflects data for the first two weeks of June. Ultimately both reports are largely irrelevant .

Market volatility today will be driven by quadruple witching, so volatility should be high. Other then that, Greece will continue to be a major driving force in the market especially when it's devoid of any heavy economic reports.

More News for Gold

Check out this article 


I find this a little strange after yesterday's CME margin decrease for GLD. I'm sure you can do the simple math.

What's really behind this, I suppose we'll find out in a few months.

As for Silver

 3C 1 min is in line with the move up in silver and if anything leading a little bit

As is the 5 min chart.

GLD Update

Last night the CME lowered the margin rates for gold

This morning Gold Broke out of the volatility squeeze I showed in the above post, but so far, it's looking much like the rest of the market in the short term.
A 1 min negative divergence-so don't be surprised if it retraces a bit as it already has started to do.

We'll have to see what it looks like as the longer term charts develop being this margin decrease is a new parameter introduced.

Backing and Filling

It's no wonder the market is backing and filling into the gap, there was no confirmation of the gap.

 DIA 1 min

 QQQ 1 min

 SPY 1 min

However, it's not necessarily a disaster, all of the 5 min charts for the above, look like this one of the SPY.