Wednesday, January 7, 2015

Daily Wrap

From yesterday's Daily Wrap

"I think I have been clear about what I expect from a market bounce, an oversold bounce, not something that is supported and to that end, today put in the second Hindenburg Omen in a row. The last two clusters sent the market lower so this also fits with our near term and longer term analysis.

As for Leading Indicators, none of them are really screaming near term. "


Today there were some short term signals and some migration of bounce signals to some longer term charts, however I think this may be a scenario in which short term nose is mistaken for something credible that's developing, at this point it's difficult to say,  but I think the only two things that really matter right now are #1  an oversold bounce off 5-days of decline and the worst 3-day start to January ever recorded. And #2, that the bounce will fail making it a great opportunity to sell or short in to. Beyond that, some of these signals that showed up today may not warrant the attention I'm giving them unless they prove to be more than just a passing bit of noise over a single day.

Today did see a short squeeze in the Most Shorted Index as you might imagine after the last week's performance, this was the strongest squeeze among the MSI in a month, it was evident at the open and then again around 1:30 going in to the Minutes release.

Opening MSI squeeze prints at +1750 on the open (TICK).

Leading Indicators weren't really "screaming" just like yesterday. Today VXX and VIX were mostly in line with SPX performance, HYG was about in line and acting as a lever with a positive divegrence out to about the 3 min chart, but that's about it. TLT outperformed a bit and this showed up in 30 year yields exerting some downward pressure on the market. We'll have to watch, but this may be the start of a larger 30 year yield/SPX divergence leading to the next lower low.

 TLT's outperformance (SPX prices in green are inverted to show the correlation).

 As you can see, 30 year yields put in a positive divegrence at the SPX lows yesterday and helped lead in to today, however today after the European close, they moved to the downside which may be the start of a larger divegrence in yields which is important as the longer term chart below shows.

30 year yields vs the SPX (green) w/ yields leading the market.

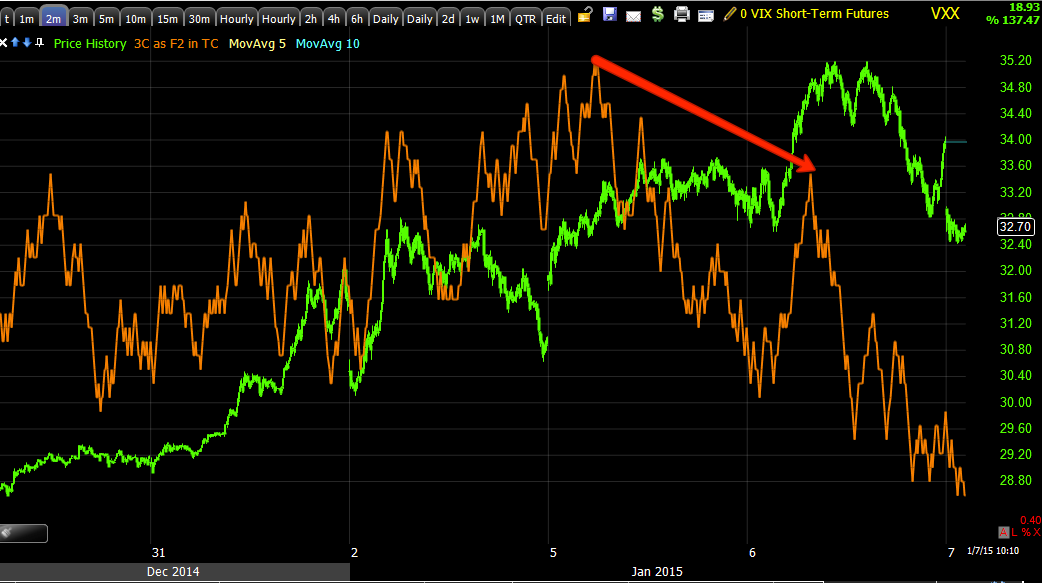
Our SPX:RUT Ratio and VIX Term Structure ended the day rather flat, but may have accomplished what would be a stronger base...
I mentioned the chance of a market pullback very early today to make a more symmetrical inverse H&S bottom/base. It seems that the SPX: RUT Ratio (red) was reflecting such a base (roughly) being carved out and now returns to in line.

The Pro Sentiment charts really aren't showing much, pretty close to in line, but not leading either way, just kind of blah.

HY Credit is still a bit mixed, although the PIMCO HY Fund which was leading in to today was more in line today, perhaps having already established a position for a bounce and not willing to chase much beyond that.

Again HYG is still positive out to about 3 mins, after that it goes flat and then negative so it's just a matter of a few timeframes turning and we'll have an idea of where our best entries are.

Some confusion was in the $USD which closed higher on the day, but lagged i to the afternoon and the Yen charts, these suggested a decline in the USD/JPY and after a bounce followed by a larger decline (multiple timeframe analysis).

It seems this did play out to some degree, although not effecting Index futures much. There's still a chance of seeing more of this overnight.

 USD/JPY (candlesticks) on a 1 min chart vs ES (purple), note the afternoon weakness in USD/JPY which is something I saw earlier and assumed it might be part of a short term knee jerk reaction to the minutes, instead the FX pair lost some ground in the afternoon, but didn't have much effect on the market if any.

 This is the 1 min Yen chart today with a positive divergence around the European close that led to higher prices in the Yen and combined with some $USD softness in the afternoon, lower prices in USD/JPY in the afternoon. There's a possibility of more overnight...

 5 min Yen leading positive.

5 min $USDX leading negative, so the chance of overnight weakness in the pair and perhaps index futures looks to be pretty real. 

At the 7 min charts they move back to inline and reflecting the end of the market bounce, at 15 min charts the Yen is positive again and the $USDX is negative, which just is more confirmation that this is a bounce to sell in to.

The index futures also look like they could see some overnight downside as they have leading negative 1 min divergences right now after the close. They are really not too different from the USD/JPY and the same scenario laid out above for the FX pair.

However as I said above, the most important themes for me are a bounce which are represented largely out to the 5 min 3C charts like this IWM 5 min chart...
 5 min IWM positive.

Then the 10 min charts are either in line or turning negative, at 15 min we have clear leading negative divergences that are horrible looking and just get worse as you move to longer timeframes.

15 min IWM, I purposefully didn't draw on the chart. This reflects the strategy of shorting in to short term price strength as it will not end well, but a bounce in the area at important moving averages or support after such an oversold set of conditions, is not at all surprising and for bears, actually healthy that the market doesn't get so oversold that it pops up like a rocket on huge oversold tensions.

Anything we can add to the above two themes is icing on the cake, but these are the two dominant themes and 1 dominant strategy.

Speaking of Dominant, the Dominant Price/Volume Relationship was the most bearish of the 4 possibilities and the same for all 4 major averages, Close Up / Volume Down with 23 Dow stocks, 70 NDX 100, 898 R2K and 338n SPX. Usually the next day close would be red based on a 1-day overbought condition, but this market is at extremes so I think we can see a couple more days like this, but make no mistake, this is not bullish.

Also indicating a near term overbought condition, all 9 of 9 S&P sectors closed green with the leader Healthcare at +2.35% and the laggard, Energy at +0.21%.

Among the 238 Morningstar groups, we had another short term overbought condition with 218 of 238 groups closing green.

That will about do it for tonight unless something pops up in futures, but you already know I would not be surprised to see some overnight weakness.


Closing Commentary

From what I can see, the minutes had very little effect on anything seen earlier today. It still looks like a decent chance of a USD/JPY short term pullback perhaps with Index futures following, this could even be overnight. However the probabilities of the market bouncing higher seem very high. At this stage it's not a trade I would piggy back off, I may feel different if there's a pullback scenario and set up that is well timed with good signals, but for now, I would continue to consider this the oversold bounce we have been looking for and I don't think it is at all done, but I do think it ends badly for the market making it a great opportunity for trades to come to us just as NASDAQ biotechs currently are, exactly in line with expectations and nearly exactly the way the IWM range bounce went down.

Other than the minutes not seeming to have anything to do with the signals seen earlier today, there's not much else new to report. I'd consider the short term possibility of a pullback just that, a possibility and if it gives good probabilities for a piggy back trade, then we'll cross that bridge when we get there, otherwise, I'd stick with the larger theme we've been looking at this week, an oversold bounce that we can sell/short in to, an opportunity.

Look Familiar Part Two

Earlier today I posted what is a macro concept in Look Familiar?, the Crazy Ivan shakeout of both sides of a lateral range. The example given was yesterday's "trade set-up, Letting the Trade Come to You- NASDAQ Biotechs. What both the IWM and IBB/NASDAQ Biotechs had in common before anything began outside the range was the larger negative divergence that suggested any move above the range would be a short selling opportunity.

I guess just by dumb luck and irony, the IWM started a Crazy Ivan shakeout with a break below the range the very next trading day after the idea was posted, giving it the bear trap it would need for upside short squeeze momentum. Similarly, IBB/NASDAQ Biotechs did the exact same thing at the exact same time, the next trading day after the idea was posted. Call this irony, chance, whatever you like, I believe it's evidence of one of our concepts and it's predictability and probabilities that make it such an effective tool in setting up trades and knowing what to expect. Of course the IBB/ range was significantly ssmaller than the IWM range, thus we'd expect events to transpire faster, for example, we've already crossed above the range's resistance area which is what we expected and we also expected to see distribution in to a move above the resistance area of the range, thus making it a head fake move and an excellent opportunity or asset to short in to its price strength and underlying weakness.

Along the same lines as the larger IWM concept, here's where IBB/NASDAQ Biotechs and BIB (leveraged long NDX biotechs) as well as BIS (leveraged short NDX biotechs) stand.

The trade set-up was for a move ABOVE the range with confirming distribution in to that move. While I'm not saying this is it and as far as IBB can go, I am showing that just like with the IWM, the same process which was forecasted by the longer term charts (see yesterday's post) is underway.

 Because this is a shorter timeframe (30 mins vs 1 day), we've already completed the Crazy Ivan shakeout of both sides of the range, now it's just a matter of the charts lining up to give us a well timed entry, but the process is already underway.

This is IBB as it broke above the range, note the 1 min negative divergence.
 divergence.

 The leveraged long of IBB (BIB) is showing the same distribution in to higher prices as anticipated in yesterday's trade set--up.

And the 1 min BIS (leveraged short) is showing accumulation below the range.

IBB had a 5 min positive divegrence so when this shows signs of going negative, we should be at an area where IBB short or BIS long makes sense.

BIS 5 min is already at a leading positive 5 min divegrence so we only need to see 2 and 3 min charts go positive here with IBB confirmation.

Thus far this trade set-up is going exactly according to yesterday's plan/[post.


F_E_D Minutes

I don't think we learned a lot from the F_E_D minutes, thus there hasn't been a significant knee jerk reaction.

What we did learn, was using the secret decoder ring the minutes came with, the term "Patient" meant "flexible", not necessarily the definition one might usually take away that would suggest a longer period of time as in one being patient until their opportunity. In the F_E_D's mind, patient means flexible which means rate hikes could come either sooner or later , all depending on data, I don't think it was the best, most articulate choice of words.

We also learned that the F_E_D is comfortable raising rates at the current inflation rate of 1.4%, .6% below the F_E_D's 2% comfort zone, the only caveat being that if they were to raise at current levels , they'd need to feel assured that inflation would be heading toward their 2% long term goal, which essentially means is that the F_E_D could hike at any moment, the 1.4% inflation currently is not a hindrance to them doing so and the caveat of feeling comfortable that inflation will head towards 2% is about as arbitrary as their assessment that lower oil prices is a net plus and transitory as well as global risks being about equal with US upside, balancing any fears there.

All in all it sounds like they gave themselves the elbow room and clearance to raise rates whenever they want, taking away any arguments that some might make that inflation is too low or that Energy prices will keep inflation too low as they view it as a new positive and transitory, and finally the global downside risks are balanced with the US upside, thus global risks to the downside aren't anything standing in their way from earlier than later rate hikes.

There's a lot more I could say on the issue, but it's opinion and conjecture, but let me just sum it up as , I don't think policy normalization is something the F_E_D is wanting to do because the US economy is "CLEARLY" ready for it, I think it's something the F_E_D HAS to do, because they've painted themselves in to a corner with little dry powder to respond to any future shocks and need to regain some of that dry powder through policy normalization, the BIS said it in their last two major reports and I think the F_E_D is not ignoring the BIS's comments that "Leading central banks don't have the ability to respond to even a garden variety recession" because of their balance sheets spread so thin.


Tricky Market

Either there's some indecision in the market related to the F_O_M_C minutes due out in a little under an hour or this is on of the more elaborate head fake bounces I've seen. If the latter is true, I "may" even consider playing a piggy back long trade until we get to the point in which shorts should and can be entered, otherwise I'll just stick to the plan.

One chart than sums up some of the conflicting short term vs intermediate (bounce) signals in our custom SPX:RUT Ratio and VIX Term Structure.
 The red SPX: RUT Ratio is not confirming short term price action to the upside today, however the VIX Term Structure yesterday gave a small buy signal. I suspect these are not contradictory signals, but a more elaborate set up having to do possibly with an initial knee jerk reaction.

Remember we have had the worst 5 day performance since 2013 and the worst 3-day start of the trading year EVER recorded, we are deeply oversold on a short term basis.

 The 1 min IWM is not confirming price action today and looks like a pullback toward yesterday's lows or even below them as a head fake move is likely, however this is an intraday steering chart, not an important signal for a bounce.

 the IWM 5 min is showing a respectable 5 min positive which should lead to the kind of bounce we can short in to at our advantage.

However the 15 min IWM chart and beyond, show the highest probability resolution, in my mind a near certainty to the downside.

Everything I've looked at this morning from the $USD, Yen, USD/JPY, VXX, VIX, VIX futures, yields, 10 and 30 year bond futures, Index futures, Leading Indicators and the 3C charts for the levers like HYG, VXX, TLT, etc.) all suggest the same thing to some degree, some even greater than they were yesterday which is why I might consider a piggy back long, depending on the set up and what the charts look like, because unless the minutes were leaked, they remain a wild card.

We'll see shortly, but I wouldn't assume any near term downside is a break lower and that the bounce has been scratched, in fact just like you saw in the last post of NASDAQ Biotechs and the IWM example, often a downside move is very useful in creating upside momentum so we'll see how things react during the minutes, but I suspect these charts are probably reliable which would mean a bounce and perhaps a quite impressive one, although perhaps short lived followed by additional downside and the breaking of the SPX support at the 100-day moving average.

Look Familiar?

Almost all of our concepts are in some way based on human psychology as well as lessons we've learned about how Wall St. uses long held beliefs about Technical Analysis, Santa Claus rallies, etc. against traders.

As such, just about all of our concepts are fractal in nature, working on a 1 min chart just as well as a monthly chart and working on the IWM just as well as bonds because they are all rooted in the same influence that moves them, human psychology.

So after what we have been forecasting since mid December and what has happened since then, does this price pattern look familiar to you?

 If not, here's a hint...

 Note both have a range, both break below the range in a head fake move or failed move and head higher, using a short squeeze of new shorts who entered on the break below the range.

If it's still not ringing any bells, here's the full chart of the one above and how it resolved thus far...
The IWM daily 6 week range with a Crazy Ivan shakeout and false breakout/head fake move.

The initial chart at the top is one I just mentioned as a Trade SET-UP, let the trade come to you...
Letting the Trade Come to You- NASDAQ Biotechs

Above is the full chart, even though it's on a 30 min chart rather than a daily, it's doing the exact same thing. You probably remember what we expected of the IWM and where the best place to short it was, it's exactly as described in the linked post above from yesterday.

I just thought I'd take the opportunity to show you how predictable Technical traders can be and as such, how predictable Wall St. can be and how you can use that to your advantage in just about any asset and just about any timeframe imaginable. Human psychology remains a constant.


Market Update

The market has taken an interesting twist, if not deceptive. Breadth since the open which was strong has fallen off to pretty weak levels. You may recall in this morning's first post the 5 min $USD negative divergence and the 5 min Yen positive divergence which if triggered, would send USD/JPY lower, but I wasn't quite sure if that was a transitory divergence or already the start of deterioration in a very early/young bounce. I think we have our answer and it's probably important you see this so you don't pull any triggers too soon.
'
The 5 min FX divergences have moved to the 1 min charts which means they are about to trigger...

 $USDX 1 min neg.

Yen 1 min positive which has resulted in...

 a clear USD/JPY 1 min negative suggesting it and likely index futures pullback, which is something I was expecting this morning in the first post, but it may be deeper than initially expected.

This may cause people to think, "That's it for the bounce, time to pull the trigger on shorts" and while anything is possible and this is why I'm watching everything so carefully, especially with the minutes (wild card) at 2 p.m., I don't think that will be it for the bounce we have been expecting this week.

 Case in point, almost all risk assets look like this, the QQQ 1 min which is negative and lower prices would not be surprising from here. However...

This 5 min QQQ positive is much bigger, a much stronger chart and it has no deterioration.

The bottom line, it looks like the market is going to see some near term downside that will make this morning's newly formed bounce look like it's over before it even really started and that's a narrative traders will buy in to as we have had the worst 5-days since 2013 and the worst start to the year EVER. 

However, a 5 min positive like this just doesn't pop up from nowhere and these are rarely abandoned once they've reached this stage so I would not buy in to any downside hinting that the early strength in the market was just a passing event, I think this is probably a trap of some sort, perhaps to engage a short squeeze. Thus, I'd be patient here before rushing to any decisions.
  

Morning Update

You probably noticed today's market tone is quite different than the last week, it should be. All of the ramping levers are deployed...

 HYG has now moved up off its pos. div. which is all that counts for price action, the divergence itself does nothing for price, it's the move higher in HYG that ramps the market.

VXX/VIX as we've seen the last two days especially has come down as it moves opposite the market.

 And TLT's divergence yesterday has sent it lower, yields higher, thus giving support to the market near term for higher prices.

Finally the USD/JPY (candlesticks) linked up with ES/SPX futures just after the European open this morning around 4 a.m., and have been moving together in lock step.

 There are several divergences in the SPY, I chose this shorter 2 min chart so you can more clearly see the a.m. price action higher, although it would not surprise me to see a pullback to the red area before continuing higher, it's really not a matter of concern.

 The QQQ 2 min also higher this morning, remember to keep an eye on NASDAQ Biotechs, IBB as a possible trade set up. So far they are about doubling the NDX's performance today.

 And a near term chart of IWM which also looks like it could pullback a bit, but that's not of much concern.

With all the levers deployed, you either chose to trade this on the long side in which case it's about management for now or chose to wait for a bounce to short in to price strength and underlying weakness in which case, it's about patience as well at this stage.

Looking at the component currencies that make up USD/JPY, I found this today...

5 min $USD negative

5 min Yen positive. This would suggest USD/JPY weakness and thus market weakness unless another JPY pair rotates in. Right now it's very hard to tell whether this is very near term for a quick pullback or this is the first sign of a dent in this bounce already which would be a bit surprising.

I'll be looking for possible leaks of the minutes, watching the market for any weakness brewing which should hit the levers first (USD/JPY, HYG, TLT, VXX) as well as any price action in to the minutes release at 2 p.m. today.

Other than that, the majority of my time will be spent looking at assets such as the NASDAQ Biotechs to see when they are giving signals that their move is weakening and thus ripe for a short sale entry or early warning for some  of our more aggressive traders who chose to play this long.

I may be a bit more quiet than usual today, that's just because now that we have the bounce the evidence was pointing to, there's not too much to report on until something changes, otherwise I have a lot of work to do in looking at several hundred assets on my watchlists for potential trade candidates.