Friday, May 1, 2015

Daily Wrap

As we have had numerous signals of an impending base and bounce to come, it was the USD Andy yesterdays internals that drove it home for me.

From yesterday's Daily Wrap :

"As for internals today, I knew what the Dominant Price/Volume relationship was going to be before noon time. You may recall yesterday's which suggested additional downside today, but sector performance was moving toward a short-term or one day oversold condition.

Today was a definitive short term or one day oversold condition.

The Dominant P/V Relationship was Close Down/Volume Up, the most likely of the 4 possibilities to produce a bounce or next day close green (even though tomorrow is an op-ex day). There were 70 NASDAQ 100 stocks at Close Down/Volume Up, 1332 Russell 2000 and 264 SPX500, that's a DOMINANT relationship.

In addition, all 9 of 9 S&P sectors closed red with Energy leading at -0.31% and Health Care lagging again at -1.40%.

Incredibly, only 13 of 238 Morningstar groups closed in the green.

THIS IS A DEFINITIVE SHORT TERM OVERSOLD BREADTH CONDITION, WAY MORE RELIABLE THAN INDICATORS TRYING TO DETERMINE THE SAME.

That means these readings are also supportive of a near term bounce."


Clearly the dominant price volume relationship and sector performance showed a short-term oversold market which is much more accurate via breadth conditions then any indicator such as RSI. So in addition to all the other indications which ranged from leading indicators to currency indications  just plain old 3C charts, we started to see the bounce unfold today.

Macro data was horrible today sending the Bloomberg macro data surprise index to a new six year low. However macro data was horrible on Wednesday as well and did not have the"Bad News is good news" effect. I don't believe today's macro data had anything to do with the market's performance either. This was set up in advance as we saw earlier in the week when first calling for a bounce.

When we see purposefully constructed market moves such as this bounce, there's always a reason for them. One of the reasons that became obvious early today was in VIX related assets such as VXX. In addition to other indications today, this post More confirmation of our Near-term Price expectations shows short-termVIX futures as well as actual VIX futures being accumulated. Typically we don't see accumulation of VXX until we start seeing distribution of the bounce, however in this case accumulation was near instantaneous on lower prices indicating to me smart money is trying to load up on protection hand over fist as fast as possible with as much as possible.

One of the very obvious reasons for this move was recapturing SPX 2100, Dow 18,000, NASDAQ 5000 which was all achieved today. Although it was on half of yesterday's volume and approximately 30% less volume than the recent average for S&P e-mini futures. Obviously a lot of this can be explained away by the numerous closed markets observing May Day.

A typical, non-manipulated market bounce would look something like this...
SPY and a series of lower highs. However with a preplanned, constructed bounce, they always have an objective and part of that objective was clear on VXX accumulation today. To get traders to move and either stop out or enter positions, the market has to do more than the typical price action above, it needs to touch emotional extremes that causes traders to make emotional decisions. That being said, I don't have a target in mind other than something higher than today.

Here's the performance of the major averages in various time frames...
 The major averages today with Transports leading and the Russell 2000 lagging.

 The major averages since the F_O_M_C again with Transport leading and the Russell 2000 lagging

The major averages on the week once again with the Russell 2000 lagging. This was the worst week for small caps in six months which should tell you something about the nature of the trend change we are currently in.

While I could go on and on with different 3C charts, there are a select few currency futures, Carry trades and index futures that make the coming week's price action clear as well as what is to follow.

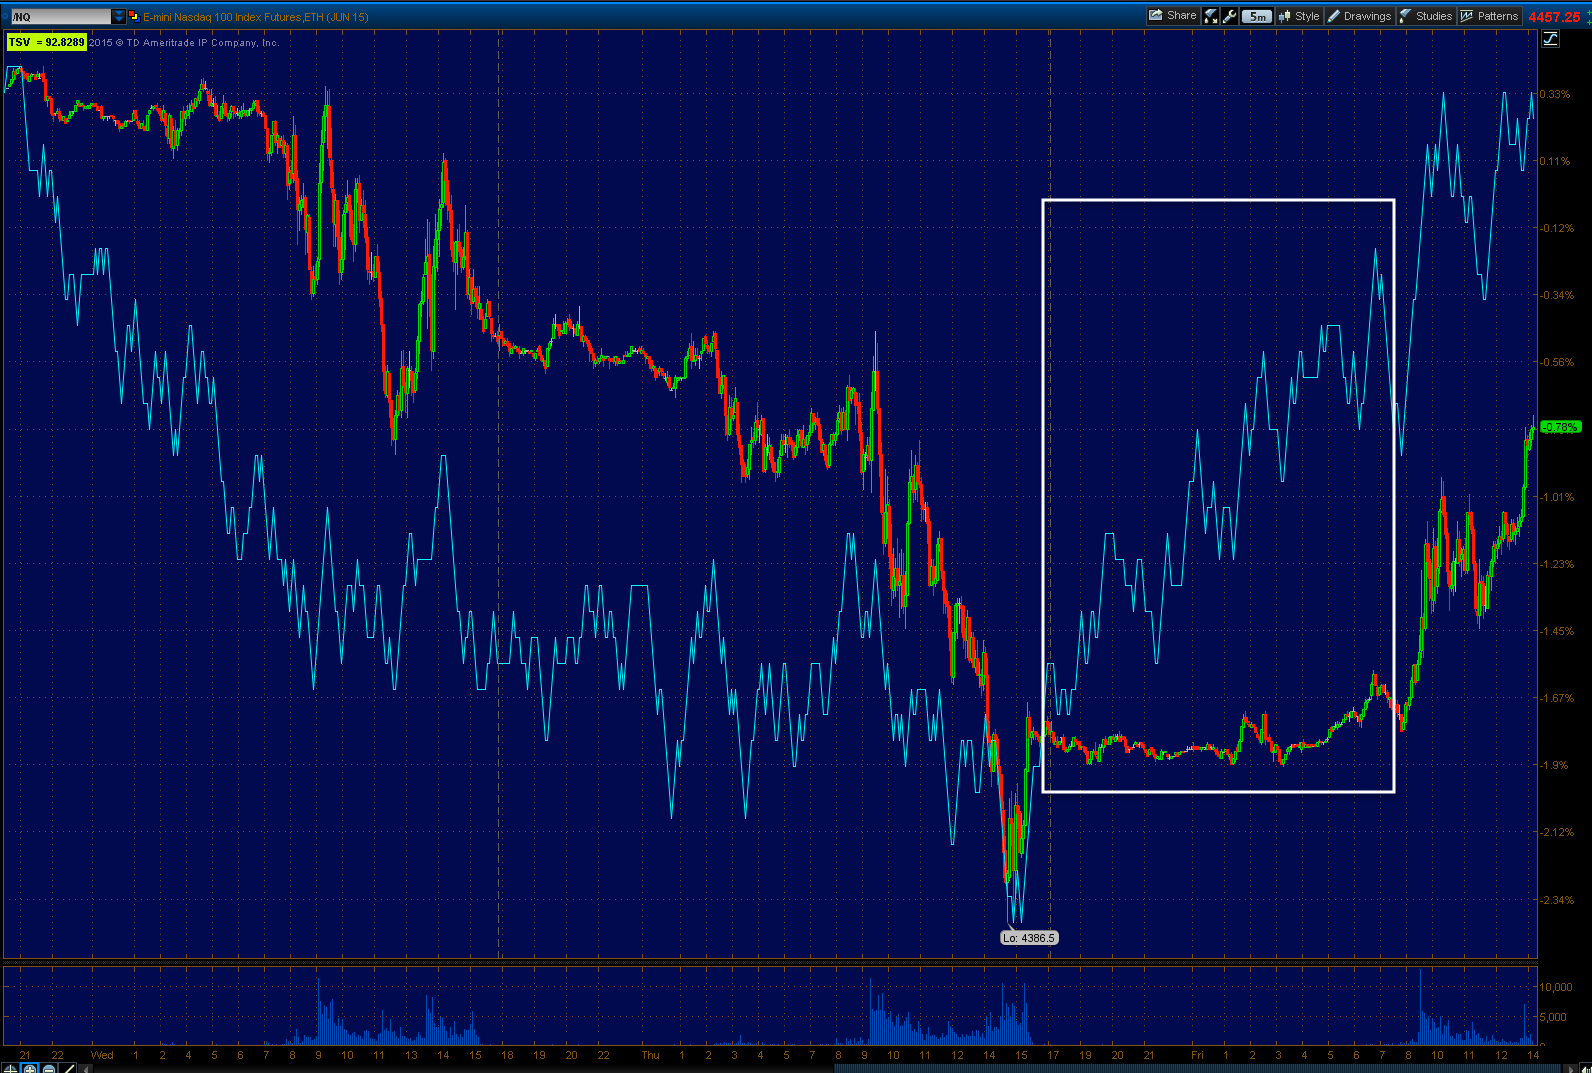
Into the end of the day, if you were paying attention to the NYSE TICK index, you would have had early warning, but I do not see it as significant into next week's early trend.

 NYSE TICK Index intraday falling out of the channel after hitting+1250 bullish extremes.

This gave you early warning as to what the close was going to look like...
SPY 1 min at the EOD... Nothing to worry about at all, just some profit taking in to the weekend.

You have to remember that few people see the underlying action that we see, therefore, a chance to book some gains or get out at breakeven is an attractive option.

 This is the USD/JPY (candlesticks) vs. ES in purple. Clearly our US dollar analysis is very important in multiple Time frames/ trends.

 Looking at the one minute intraday USD/JPY 3C chart, we can see a slight negative divergence which fits very well with the TICK Index readings. While many technical traders do not see it, the pros can see a change in one asset that will effects another.

For example...
 The US dollar was seeing some end of day distribution on a small scale which naturally would have an effect on USD/JPY which is correlated to index futures. So some profit taking on perceived $USD weakness that would translate into USD/JPY weakness which would have an effect on index futures, is natural.

Speaking of the US dollar, considering our longer-term analysis and the effects that it will have as laid out in this post yesterday, $USD Update & Market Repercussions, the fact that the US dollar had it's fourth worst week in two years this week should not be lost on you.

 This is the one minute chart of Yen futures which are in line however the USD weakness had small effect on the USD/JPY carry pair.

As to longer-term, more important charts..
 The USD five minute is still positive, giving evidence to more upside early next week.

 The five minute chart of NASDAQ 100 futures is also leading positive short-term. This also indicates the probability of upside early next week. However take note that the base/ divergence is not so big as to cause a change in trend. However as I was getting to above, Wall Street set this move up for a purpose and I can almost guarantee you that it will look extremely strong even though there's no "gas in the tank" to support the move beyond a very short-term scale, but that is the nature of emotions, they can take over rationale extremely quickly and that is the end goal.

 With strength in the USD andUSD/JPY, yesterday we forecast strength near-term in the Nikkei 225. This seven minute chart of Nikkei 225 futures shows a positive divergence in line with our forecast. I'm looking for an impressive move early next week, not one that will hold as you will see below.

 This is the ES/ SPX futures on a 10 minute chart also showing the recent positive divergence behind this move.

 The USD futures were one of the earliest signals for a market bounce as you can see on this 10 minute chart with a reversal process in place and a leading to positive divergence.

The basic arithmetic goes: USD bounce, USD JPY bounce, index futures bounce, broad market averages bounce.

 The 15 minute Yen futures are in-line, that's a stronger USD should lift the USD/JPY.

 With USD/JPY strength comes yen weakness and Nikkei 225 strength as this 30 minute Nikkei futures chart depicts with a 3C  positive divergence after distribution earlier in the week.

Today's Nikkei 225 close which was near flat, represents a loss of downside momentum and opens the door to this bounce.

However looking at the longer-term charts, The probabilities of any short-term bounce are already set.
 This is a chart of the one day Nikkei 225 futures which were in line on the uptrend and led to a relative negative divergence, followed by a current leading negative divergence. I fully expect the Nikkei 225 to be in a topping process.

In addition, the one day ES/ SPX futures chart shows a much more developed leading negative divergence or distribution on a very large scale.

 The USD one day chart has also gone negative and leading negative at that. This is not just about the USD, it is about F_E_D interest-rate hikes and more importantly the carry trade unwind which is at nearly $9 trillion  $USD.

You can read more in any of this week's posts on the USD or specifically $USD Update & Market Repercussions

 Two years ago I wrote an article that is still linked on the member site which forecast a rising yen at the same time the market entered a primary bear market trend. As you can see, The yen futures on this one-day chart were in line with the downtrend and have sense moved to a leading positive divergence as the yen's trend has shifted from down to lateral which is indicative of a base.

All of these one-day charts taken together are extremely damning for the broad market.

This is a close-up of the one day USD chart posted above. As already mentioned the USD has seen the 4th worst weekly performance in two years.

Earlier in the week I showed how the USD failed to make a higher high and went on to make a lower low which was exactly the forecast that was made on April 2. I also suggested that the intraday lows at the yellow dotted trendline would be an ideal area for the USD to put in a countertrend bounce.

Looking at all of the charts above, whether intermediate term USD positive divergence occurring just as it makes a tweezer bottom at intraday lows, or the USD/JPY charts, ES charts, Nikkei 225 charts, they all come together perfectly.

I expect we will see the additional strength early in the week which will turn into a reversal process in which we will want to be shorting into price strength/ underlying 3C weakness and closing positions such as VXX Puts or NFLX calls (which I entered as a hedge to the NFLX equity short).

This is one of the rare moments in the market that I described last weekend in the two posts from Saturday and Sunday which I would recommend just so you can see how everything comes together like a ballet at the right moment in the market. This is what I consider the closest thing to beauty in the market.

The weekend is beauty and I hope you all enjoy it very much.


High Degree of Confidence in our Forecast

I'll be posting charts shortly, but as I have gone through the indicators, assets and watch lists, I have a HIGH degree of confidence in our near term "Bounce" expectations with the Nikkei 225 seeing a bounce as well (today's price action in the Nikkei set it up for a loss of downside momentum and a bounce). The USD plays a major role as will the USD/JPY which I'll show you as well.

However, what happens after the bounce... DOWN.

I have a high degree of confidence in that forecast as well, not only from the charts, leading indicators, but the $USD and the effects beyond simple FX pairs such as the carry trade. Today's aggressive accumulation of VIX based assets (VXX/UVXY/VIX futures) doesn't tell me that the bounce is almost done, it tells me they are trying to pick up as much protection as possible because they know what is coming after this bounce which is likely the entire reason for the bounce in the first place.

Charts on the way... I hope you did well this week and were able to set up some positions for next week and the bigger picture.

The Week Ahead

I expect next week, at least early on, we'll continue to see a bounce. The USD/JPY has had some movement due to other currencies (namely the $USD), but only on a very short term basis. I believe the longer trend signals will hold through early next week giving us a chance to enter longs like VXX/UVXY at a discount, sell some of the counter trend bounce positions like VXX puts and NFLX calls and enter trend/swing trades in core positions, NFLX, AAPL, Biotechs , Transports, and other core positions we have built positions in.

For now, we'll take it as it comes, I can give you an idea of what Monday's early action will look like once seeing the closing charts, but I believe beyond the opening action, the bounce still has gas in the tank.

Make no mistake though, this market is BADLY damaged, I'd think by mid next week we'll be turning to the downside and making a lower low which should eventually take out the October kiows and completely change the primary trend classification.

More to follow, but that's the gist. THIS IS ALL BASED ON CHART SIGNALS, NOT MY OPINION.

NFLX Update

I think most everyone knows what to look for on a downside (or upside) "flameout" (intraday capitulation/short term selling event). We've had this scenario several times this week and I have posted what to look for and it seems you guys are making the concepts your own, which is all I could every hope for.

We have some history with NFLX...

 This 60 min chart of NFLX's two gaps up, both earnings based, shows the long term underlying trend of distribution. At #1 to the left is Q4 earning and the gap up which needed to be done to relieve market makers of underwater positions from the 10/16 gap down in which they likely got caught holding inventory at levels almost 20% higher.

Our entry (short) took place on 2/26, Trade Idea: NFLX Short, the best entry you could ask for, but we had to wait for it since the first Trade-setup, NFLX trade Set-Up, on 1/21, the day of the earnings gap up..We patiently waited for the right signals and finally entered on Feb. 26th, at the red arrow (vertical) Trade Idea: NFLX Short. A short at the highest close of the entire move, but it took patience.

After the most recent earnings (Q1) based gap up, on April 21st we started looking for the NFLX short entry, NFLX Update / Trade Set-Up. Our last short entry on April 27th, Trade Idea : NFLX Short

So why NFLX calls? We use multiple timeframe analysis and try to match the right trading tool (trade) to the timeframe we are trading. For a longer term position, the Trade Idea: NFLX Short is fine, but for a near term bounce....Today's, Trade Idea: VERY SPECULATIVE...NFLX Short term CALLS was the right tool for the time frame and expected move.

This is the 10 min chart showing strong deterioration.

However very near term the one minute chart is showing a positive divergence in line with the market balance we expected. Two thirds of stocks will move directionally with the market.

This two minute chart of Netflix shows a much cleaner divergence although it is only a two minute chart and thus we can't expect much more than a bounce. This is the reason I chose to use the leverage of options.

The three minute chart is also positive, But that's about where it ends.

This is the five minute chart as you can see, negative

At 12:13 PM today, I got this email:

"And there it is a spike below post earnings lows, yesterday low and this mornings low. High volume.
 
Let the short squeeze begin ..."

This is what our member was looking at...

As I have said over and over again, it doesn't matter what the asset is, It doesn't matter what the timeframe is. The best price-based indication of a trend reversal (on this short term trend), is a head fake move. In this case it would be a stop run. This is exactly what our member was referring to as you sent the email at the red arrow as price broke below the intraday lows on surging the volume (stops are being accumulated).

I'm glad to see the concepts being utilized.

Trade Idea: VERY SPECULATIVE...NFLX Short term CALLS

I'm going to open a "bounce" NFLX May 15th $555 call position, but in very speculative size. I expect to be closing it early next week.

More confirmation of our Near-term Price expectations

I have an email I want to share with you and hopefully will have time to, it's fantastic.

In the meantime, I'm watching the market run up right now as the 2 p.m. (approx.) max-pain options expiration market pin expires. While I obviously think we have more bounce to go, there are signals in VXX (VIX short term Futures) as well as the 3x leveraged UVXY (which is at over a +40% gain since yesterday afternoon) and VIX futures themselves that confirm our near term expectations of a market bounce and that's all. When the charts turn negative intraday for the market, we will be making new lower lows and that proof is being accumulated in VIX products right now.

Remember an accumulation signal is not a signal to necessarily go long, it's showing us what is happening under price's surface as these assets pullback. Te only reason to accumulate them (beyond getting in at lower prices) is because you (and by that I mean smart money), expects the market to end or continue with something much worse than what we have seen this week so far.

 NQ 15 min still showing a nice positive divergence, in line with out bounce expectations...

The 5 min NQ chart is showing no signs of distribution yet.

Nor is the fastest 1 min chart.

For that matter, neither is the 1 min QQQ or any of the other averages...

like SPY which is in line, confirming the bounce intraday.

However, I'd normally expect to see VXX accumulation once the above assets started to show distribution, but it seems someone with deep pockets is willing to grab as much VXX/VIX related assets as possible on cheaper prices and they got started immediately.

VXX
 1 min leading positive divergence in to today's losses...

That signal has migrated to the longer 2 min chart.

UVXY is showing the same accumulation.

And most surprisingly...
VIX Futures are showing intraday accumulation.

It seems to me very clear that once this bounce ends, we are headed for a much nastier downside move in the market.

Broad Market Update

So far everything is going according to expectations. As I said yesterday, the USD is one of the strongest signals for a near-term bounce that I have, although far from the only signal.

Today I might not be able to make the same statement. However I think it is critical to understand the nature of our expectations for the USD and how those affect other assets and more importantly the repercussions of where we are right now in the USD which I think very few people realize the nature of this inflection point and how pervasive it is and how much influence it will exert across multiple asset groups. 

They have posted probably half a dozen or more USD articles this week, if you don't have a basic understanding of our expectations, then yesterday's post, $USD Update & Market Repercussions is an excellent place to start. Given the USO post today with USD connections, a second post from Wednesday would also be insightful, USO / Oil Update, the Carry Trade ($USD-Broad market too).

I can't update the market without updating the US dollar as well. Or perhaps better said I cannot stress enough the probabilities of our expectations for near and larger term market action, without touching on the US dollar.

As for the normal "Market Update" 3C charts of the averages...

DIA
 2 min 3C chart with yesterday's head fake/stop run move we anticipated and warned to look out for in this post from yesterday, Market Update (I post it because the concept as to how to identify an intraday flameout works in any asset and all timeframes so it's a useful concept for your tool box).

*This is the chart from yesterday and commentary from the 1 pm Market Update if you just need a quick look without reading the entire post as I will be showing yesterday's action in context of a head fake move.

"Something at least like a small "W" base-be on the look-out for another head fake stop run below this morning's lows on the formation of a second low and wider base."

Back to the DIA...
 This three minute chart shows the deterioration this week in three she end price as well as the head fake/ stop run we warned about above which as you can see was accumulated as expected. There has been no V shaped reversal to the upside, which would not last very long, if even intraday. Today we continue to work on the reversal process for this bounce.

 This is the five minute DIA 3C chart showing the forecast since April 2. I believe the distribution in three she is clear. Using this chart in the context of multiple time frame analysis, you get to see the positive divergence for our anticipated bounce, but also its probabilities vs. what has already occurred-massive distribution. In other words I am using this chart to put the expected bounce in context.

 As for the longer term view using multiple Time frame analysis you can see the extent of the damage done at the April forecasted area in which we saw Head fake moves above the various triangles in the averages. The importance of this is we new technical traders would chase it and SmartMoney would sell into it. This is a pivotal area for the market.

SPY
 The SPY 5 five minute chart with a relative positive divergence to the right which shows accumulation of yesterday's Head fake / stop run.

 We even have a relative positive divergence on the 10 minute chart. From left to right, note 3 she confirmation of the uptrend into distribution at the top and a bounce in the works as I already touched on today and in the past, price's affinity for loitering in the area after an initial break. To put a finer point on it, call it a new short seller's shakeout after a day like yesterday.

Most traders chased price.

I didn't want to close UVXY (long) position earlier yesterday unless we got a head fake move below the morning lows which would make it worthwhile to take the gains and re-enter the trade at better prices which is what we did.

UVXY 10 min
 As UVXY trades opposite the market, the yellow trendline and move above it would correlate with the same point at which the market made a stop run/ Head fake. You can see clearly that taking that trade off the table and booking the profits was the right thing to do via the 3C chart's signal above.

As you know we also opened an additional trade on the move, Trade Idea: Extremely Speculative (Options/Puts) VXX

SPY...
 60 minute chart needs to no commentary. This is the highest probability resolution of any upside move from here, a failure and simply a bounce.

QQQ
 1 min with an increased leading positive divergence today. You can see the clear accumulation of yesterdays run of the stops under the other trendline.

 QQQ 3 min showing a relative positive divergence.

 However at the five minute chart 3C is at a new leading negative low with no positive divergence indicating a bounce so it is not that strong as it has not migrated to the five minute chart. We should return to making lower lows as soon as the bounce is over.

 As a reminder of the damage done to the market, a 30 minute QQQ 3C chart. Note where price and 3C are at point "A" compared to point "B". If there is trend confirmation 3C will move higher with price. We have higher prices at point "B" than at point "A" with much lower 3C signals at point "B" indicating extremely strong distribution through this area.

 The same as seen on the 15 minute I WM chart.

As for index futures, ES (SPX E-mini)...
 This 10 minute chart of ES should put everything in perspective for the local area, but I did want to show the positive divergence for our bounce. I just want you to keep it in context of the larger signal on this chart.

 This is a close up view of the exact same 10 minutes ES chart and positive divergence.Once again it is showing accumulation of yesterdays stop run just as the averages above. If you have not read the two articles linked (near the top right side) on the member site,"Understanding the Head Fake Move", you are missing a lot of context here and a lot of great concepts such as the head fake move which we used yesterday to enter VXX Puts which are well over a +30% gain today using May monthly / in the money Puts!

 This is the 10 minute chart of $USDX and one of the first signs that we would see a market bounce soon. It too, much like the market is building a broader base with a stronger 3C positive divergence/ accumulation.

 However, just as we made a market forecast on April second we also made a $USD forecast on the same day which anticipated a large bounce to the upside (green at "A") to be followed by an even larger decline (red at "B") to the downside. At the yellow areas, We have simple, corrective, counter trend bounces just like we are expecting now.

However to put this in broader context, the $USDX (futures) daily chart.
 First the daily chart with 3C showing significant distribution as the trend has changed from upper to lateral in a triangle-like formation.

At #1, the $USDX failed to make a higher high for the first time in this trend, that was followed by a lower closing low.

I suggested that the intraday low at the yellow #3, would be an ideal area for the USD to put on a countertrend bounce.

Almost everything about the USD and the market are interchangeable as if they were one. This is that, "Beauty" or "ballet" in the market that I posted about last weekend and we rarely see but it is one of the most profitable times in the market.

Here are the posts from last weekend on the subject:

Important Market Update Part 1: The Forecast

Important Market Update Part 2: The Forecast Plays...


This is a close-up view of the exact same chart above showing the triangle-like formation which is exactly what we forecasted on April 2. The broad market averages were forecast to develop very obvious triangles and for a head fake move above those triangle to break out and fail. This has already happened and the head fake move has been confirmed.

We will use the bounce to sell in to or to sell short in to as well as manage any trades put on such as the VXX  puts yesterday.

Everything continues to go according to expectations.