Tuesday, February 3, 2015

Daily Wrap...

Again today there was more macro economic data coming in on the very poor side, NY ISM with a significant miss and a huge month over month swing to the downside. I really don't know how the F_O_M_C can reasonably upgrade the economy and if you saw the today's post by the CEO of Gallup polls, it went something like this,

"The Big Lie: 5.6% Unemployment
Here’s something that many Americans -- including some of the smartest and most educated among us -- don’t know: The official unemployment rate, as reported by the U.S. Department of Labor, is extremely misleading."

You can get the rest of the story here...

I probably don't need to go in to the F_O_M_C economic upgrades and the mainstream narrative of where unemployment is, I think we all know enough people to know 5.6 is not accurate, but it is what's needed to hike rates. again, I'm not going to go on another rant on the subject, I think I've been pretty clear.
One of the other major ordeals brewing is Greece. Yesterday's market strength was claimed to be because of some FT headlines about Greece and essentially making progress, in last night's Daily Wrap I refused to go in to any more detail as I knew it would be a complete waste of time and as of today, it's exactly that.

The initial combative Syriza one had the Troika nearly on their knees begging to work something out, whether the Greek Finmin was misunderstood or just tried to be too cooperative, away from the hard line they initially took, it didn't end well and the EU started strong-arming them immediately once they smelled weakness. As a result, today we had this from Greece and their FinMin...

"There has been no "U-turn" on the Greek debt position, adding that "Our promise is solid, debt will be rendered sustainable even if haircut replaced with euphemisms, swaps" Greece’s Finance Minister Yanis Varoufakis comments in Twitter post.

However, that 1-day of weakness may have been too much and too late as Germany calls the Greek plan "Half baked " and reflects it, shortly after the ECB rejects it out of hand as well, that''s what the Greeks get when they try to play ball with the Troika, they were in a much better position when they were combative and meeting with Russia, at that point all of Europe was falling all over themselves to find a solution that works for the Greeks, so this is obviously going to be a knock-down, drag-out brawl as Syriza learns in one day what happens when you try to tone things down and find a settlement in good faith, even if it isn't immediately acceptable on the first pass. Expect things to heat up and Striza to go back to what they know which could lead to...? Yeah, those three dots (...) are the great unknown and the real danger for Europe and the global economy.

The $USD has its worst 2-day decline in 16 months, this has a lot to do with oil-related currencies- see below.

Yields also popped higher as we saw yesterday in TLT as being highly probable, remember yields move opposite bond prices and tend to draw equity prices toward them like a magnet.

We also have all 3 levers in effect today accounting for up to $1.75 of the SPY's $2.92 move and additionally we had the AUD/JPY lever leading the market, also see below.


The 3-day move in oil is now the biggest 3-0day move in 6 years, I hope lots of you were able to make a play there, stay tuned for updates (again see below).

The market put in some solid gains today, but as I showed in this post, USO and Effects Part 2 while sentiment has been massively swayed, technically the move is nothing to write home about and the averages are all still red year to date.

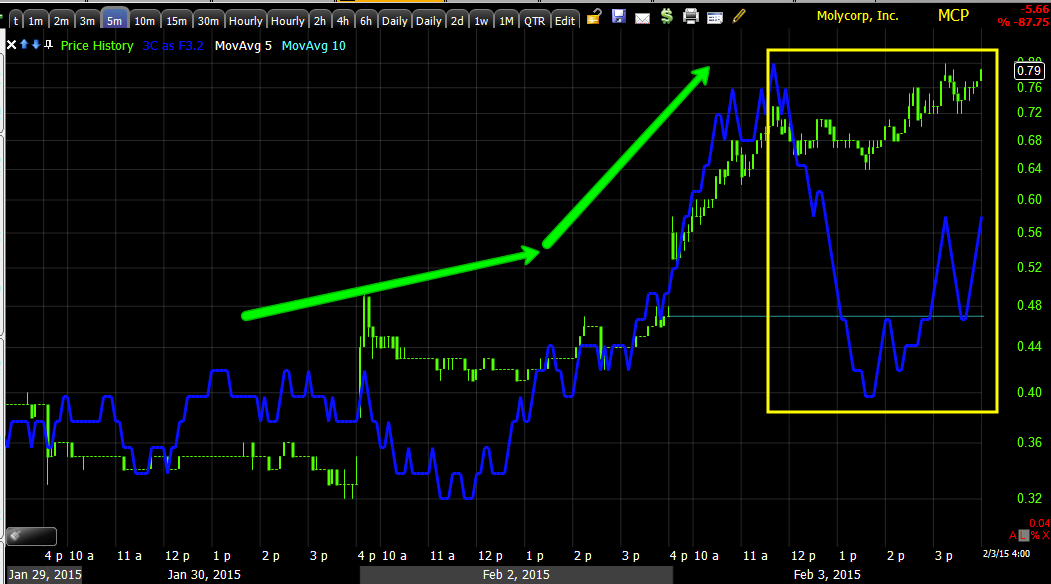
MCP as you have probably seen is tearing it up, I would like to see a consolidation and keep this move healthy, I'll stay on top of updates there as well. 

I'm sure you have a pretty good feel from yesterday and today what the levers moving the market and additional conditions like energy sector performance are, however one of the biggest smoking guns I noticed developing quickly today was among the Leading Indicators and the ramping levers, HYG (High Yield Corp. Credit) in specific as yesterday we saw the positive divegrence that we forecast would lead the market higher, today in addition to a very parabolic price move which I never trust (up or down), we had these charts develop quite fast.

 HYG 1 min leading negative

HYG 2 min leading negative

HYG 3 min leading negative

HYG 5 min negative, very different than yesterday and giving some early hints as to market probabilities near term, perhaps closer than thought.

I posted the VXX and TLT divergences, relatively positive considering so this is a biggie.

As the last post just made clear, USO and Effects Part 2,  just about everything is connected to everything. In fact some of the most beaten down currencies in this world currency debasement war (with the US obviously the big loser) have seen a nice pop much to their disliking, take commodity linked currencies...

After a surprise rate cut overnight from the Australian Central Bank, the $AUD plunged only to be lifted back to unchanged on the back of the move in oil...
 The $AUD rate cut ($AUD currency futures) almost looks as if someone knew about the rate cut or was just very nervous in advance as 3C shows a strong leading negative divegrence. On the cut, the $AUD plunged, on oil strength, it regained all CB related losses.

You may recall earlier today my contention that the AUD/JPY, which was a sponsor for today's market...
(AUD/JPY in candlesticks vs. ES in purple with the cash market between the green and red arrows)...

looked as if it may see some downside soon.
AUD/JPY...1 min intraday negative divegrence.

It's hard to say what the $AUD will do caught between a CB policy action and oil prices, for now the Yen looks a bit weak and that is helping the AUD/JPY move higher, at least through today.


 Yen 10 min negative divegrence. I would think the Yen should be headed lower, lifting the AUD/JPY, unless we see a change in the $AUD with a change in oil (or less likely a change in the Yen).

The $USD has been beaten down pretty good on the move in oil, but that too looks to be ready to change, watch the USD/JPY for upside in the very near term with a negative Yen and positive $USDX divergence developing...
$USDX 5 min leading positive divergence.


As for the EUR/USD, which has got to have Draghi near a coronary between the Euro's gains and Greece, may give him a break, at least a brief repreive. You saw the $USDX positive divegrence building above, now the Euro negative...
Euro gains with a negative 7 min leading divegrence, thus between a leading positive $USDX and a leading negative Euro, all should be right again with the EUR/USD shortly, for a short period assuming oil does as expected and pulls back briefly before making another run higher.

From this morning's USO Update,

"Oil is now on track for its 4th consecutive daily gain and it appears, as usual, the bottom callers are in, just in time for what should be a little consolidation which will likely kick them out of the trade and turn them bearish again just as USO makes another leg higher.

Other than the Mass Psychology of calling the obvious long after it has occurred and taking it to an extreme of a "Bottom", which this clearly is not, the market is finally noticing what we have been forecasting for weeks, but it does look like we are at an area of natural consolidation, one I'm sure will be interpreted as "Oil is not at a bottom, it was a false start".

To the 5 min chart that looks more serious and the 7 min chart, by the 10 min chart price and 3C are in line, thus I don't see this as much more than a consolidation setting up, unless things were to materially deteriorate from here"

Taking a look after the close as this was a VERY early look at Brent Crude and WTI (USO) futures and the ETF, 

 The 7 min Cl/Brent Futures looks like it will see a consolidation/pullback with this negative divegrence in place, but...

The CL 10 min chart is still in line so from what I can see now, I'd think, as mentioned early this morning, Oil is headed for a little consolidation and charts like the USO 60 min below, make me think USO has plenty of upside left in it...

USO 60 min leading positive,  but a bottom?

I don't think so, this is just one of numerous charts I could post that argue against a bottom in oil being in place.
USO 4hr still in line with the primary downtrend.

Now, since I did post the USO and Effects Part 2 as well as the effect it has had on Energy stocks which has seen the Energy Sector lead the market the last 3-days in a row, I'm going to borrow some research from Zero Hedge because credit where credit is due, although this is the other side of the coin I've been thinking about this, but haven't felt we were close enough to address it. What I'm talking about is Energy stock valuations since the bounce in oil and what the end game may look like if (and most likely when) the bounce ends...

Borrowed from Zero Hedge because as we've already seen, the move in oil is connected to the move in the Energy Sector which is connected to the move in the broad market and currencies, so the other side of the coin...

Several days ago the forward P/E for Energy stocks either had to come down by 40% or oil had to move to $88 a barrel to justify valuations based on forward Energy Sector multiple which stood at 24x (forward) P/E. Since the bounce in oil, here's the new valuation...
That would be back at levels last seen in 2000 during the Dot.Com bubble.

At a forward P/E of 26 with the historical average at 13x, apparently Energy companies are expected to "DOUBLE" forward earnings.  Thus, one of the unintended consequences of the Oil bounce may just be some amazing short set ups in the Energy sector which I'll be looking in to very closely as we start to get the hints and signals that the oil short squeeze and counter trend rally (which can be much stronger than what we've already seen), looks to be coming to an end.

I think this goes without saying , if the Energy sector can support and bounce the market based on the expected oil bounce, what exactly do you imagine happens to the market once the pil bounce and revaluation of the energy sector takes place?

OOPS... I should have said,  "Spoiler alert"

Amazing where the market can lead you when you pull on one string.

As for the GLD outlook, I don't even want to consider the long possibility which is there, until we see what GLD looks like on a pullback. Gold has been fooling around it's reversal process, but I haven't changed my expectations for a deeper pullback in the yellow metal.
 GLD 5 min negative

GLD 15 min negative

Gold futures 60 min negative.

As to why it's been loitering in the area and a possible downside target...
The 200-day moving average is in blue where price has been loitering, but I think it breaks and the 100-day is in purple which allows for a gap fill and is a reasonable downside target, typically we see a break just below the average as a head fake move and to put together a new base to make a move higher, but first we want to see how it acts on the way down. That's my best guess as for a downside target as of now and I think we still see that move take place.

As for near term market expectations, I made clear before the move started I expected a Crazy Ivan shakeout which is in place and I expected a head fake move above the triangle, we are above the triangle, while the averages' short term 3C charts are not there yet, HYG is giving a leading indication and the longer or even 5 min 3C charts of the averages skew the probabilities heavily to the downside, ad in some other things like CGreece, what happens to the Energy sector when the oil bounce is over, the break of numerous moving average acting as support in the area and things get ugly real quick.

As already mentioned, 9 of 9 S&P sectors closed green again, this would be moving toward an overbought condition (1-day overbought) with Energy leading for the 3rd day in a row at +2.74% vs yesterday's +3.06% and like yesterday the laggard is Utilities at a gain of +.37%.

Of the 238 Morningstar industry and sub-industry groups I track, an overwhelming 223 of 238 closed green vs. yesterday's 215 of 238, also another short term overbought condition developing.

As for the Dominant Price / Volume Relationship which was squarely bearish yesterday and in a big way, today we have a mixed or co-dominant relationship with almost all of the averages having a Close Up/Volume Down and Close Up/Volume Up dual relationship. Ironically although Close Up/ Volume Down is the most bearish of the 4 possibilities, Close Up /Volume Up which is the most bullish relationship, most often (leads to a 1-day overbought condition with the next day closing red.

For now, I'm not going to read in to the Dominant P/V, but the sector performance is getting very close to an overbought condition and if the 3C charts of the averages follow HYG, we may be heading down sooner than thought.

Finally for tonight, Index Futures are not looking great on the intraday 1 min chart which has bled over to the 5 min chart, a lot of the damage was done after the close, but not in all cases.

 ES1 min

TF 1 min deeply leading negative

NQ 1 min.

While I don't usually pay 1 min charts in futures too much attention on an overnight basis, they are seeping over to the 5 min charts...

TF 5 min.

If these move to the 7 min charts, things will start to look much different and I suspect the averages during the cash market will turn sour quickly. Just as I said last Thursday not to forget what HYG (short term positive) looked like as well as yesterday, don't forget what the HYG negatives look like tonight.


USO and Effects Part 2

I'm happy to hear that many of you are doing well in various USO trades, I'll cover USO in a moment. It's funny how quickly everyone goes from massive bears to raging bulls and I'm not just talking about oil where all of the Johny-come-lately bottom pickers are chiming in, I received this email from a member this afternoon and couldn't help but chuckle a little just because like every good joke, it has to have a little truth to it...

"Talk about an easily swayed public.

on various sites i've visited, nearly EVERY person is saying things like:
'risk on', 'bull market about to resume above this range', 'new all-time highs soon', etc.
amazing just a few days ago they were calling for a market crash."

I always think back to the October lows when EVERYONE was bearish as could be which was the reason I expected a strong rally before we even had any 3C evidence of a base which came soon after, that was at least a substantial move, but what is being talked about above is kind of silly when you consider what has actually happened...

 This is the very move we forecast specifically yesterday with a Crazy Ivan which now looks like both components are in place, but to give you a different perspective, take away the trendlines and...

You have a 2 day move inside a 3+ month range.

The point is not what will happen , the point is what has happened and how a day can change traders outlooks so dramatically, that's just chasing price, how can there be any conviction there?

I just thought I'd mention it as the market is moved by emotion/perception, those are the engines behind supply/demand dynamics (and of course the occasional central bank interference).

What I really wanted to talk about was USO and a post from last Thursday as we were looking for the USO bounce and short squeeze higher, USO Update & Effects. Notice it's not just the usual USO Update, but "& Effects" and those effects have a direct impact on the broader market right now, here's what they were from the post linked above (last week) which so far has been dead on, including a market forecast with the QQQ as an example (charts below)...

From last Thursday, USO Update & Effects...

"First we'll take a quick look at USO's charts, I still like this one for a bounce that likely turns short squeeze, which means we may have to consider some other possibilities related to such a potential outcome.

Remember, based on these charts that have a positive divegrence out to about 30 minutes, I think we get a surprising bounce in crude, it would seem likely to trigger a short squeeze, but I do not see it in any way as a primary trend reversal (for all the bottom callers), more what I'd call a counter trend rally/bounce.

However, even though I don't see much in the Energy (XLE) charts that excites me, it would stand to reason that some of the badly beaten down energy names would trigger a short squeeze, we saw that earlier in the week, I believe Monday as Energy led the 9 S&P sectors and we had a strong short squeeze in Energy stocks, this could of course effect the broader market. I can't say specifically it did on Monday as the Russell 2000 was already forecasted to lead the averages as of Friday's Week Ahead post and the other averages were rather flat, but it is something to consider.

Also worthy of consideration, even though it is early as we have a couple of hours left, the forecast for an oversold bounce from last night (afternoon strength to develop)...

Daily QQQ chart with a bullish Hammer candlestick, almost a bullish Harami or Inside Day as well. I suspect volume will be higher today which would also be bullish.

Just don't forget what those HYG charts looked like, that should give you some ideas of how you can use this as a set up for several different positions whether a piggy back short term long or letting the short trade come to you."


While I included some of the broad market in the QQQ chart itself, this is more because of the HYG charts even last week and the ability to use the entire post from USO to USO's effects on the entire Energy Sector which is a large component of the market averages and how that would effect the broad market.

In other words, "Toe bone connected to the foot bone; foot bone connected to the heel bone' heel bone connected to the ankle bone..."

Few things in the market are an island unto themselves... Today's +5.37% gain in USO (and nearly +18% over the last 3-days), has also moved as was warned and expected, The Energy Sector. In fact in looking at the internals and breadth of the market yesterday in the Daily Wrap, 9 of 9 S&P sectors closed green, the leader at +3.06% was the Energy Sector. Today 9 of 9 S&P sectors closed in the green, the leader... The Energy Sector +2.74%.

Last week's warning about what a USO rally would do or effect is one of those lessons that I think is worth taking to heart, since most of what we do is multiple asset and timeframe analysis.

That one wasn't hard to see coming...


MCP Blazing, Up 182% in 7 Days


Don't get me wrong, I'm glad to see it, MCP added another near +65% gain today bringing the total to 182% since the day after our last update which looked like MCP was just about ready to make a go of it.

See today's update for past links as well, MCP Update
 Look at that volume and candle today! I don't envision a rest just turning on a dime, I'd expect some kind of Doji star/gap up, but I do think a rest or consolidation will be needed soon.

You can see the rounding base above and the head fake move or "Igloo with Chimney" reversal (upside down) that we often see, this 60 min chart has a great divergence, especially in the head fake area.

In fact, this 2-day Trend Channel that has held this entire trend down was just stopped out today so there's a significant change in character, but I'd like to see it take a breather and consolidate soon...

Some of the intraday charts are suggesting that we are moving in that direction.

I'd also like to get this in a new trend channel ASAP, but one step at a time. Beautiful move this last week.

Market Update

This looks pretty simple thus far, considering where the leading indicators/levers are at in the process, the market averages make sense and there's still very much a roof of probabilities on top of this move.
As for the intraday charts, all of the averages look roughly the same as the SPY 1 min above, a little deterioration, but still has more on the upside as do leading indicators.


The same essentially with the IWM 2 min, yesterday's head fake or Crazy Ivan shakeout divergence was pretty clear as the lowest low intraday for 2015, the positives on that head fake/Crazy Ivan shakeout. We'll watch for these charts to give way first, but it's not an event, it's a process.


 And the divergences in all of the averages went out to the 3 min chart, after that, NOTHING.

So...

Looking at a 5 min chart and a much stronger base at the 14th-16th, you can see how the negative divegrence now is much worse than even back then, also note the rounding top or reversal process, not a "V" shaped event, so I'd be a little patient, let the market tell you as it will, as it did yesterday.

This 5 min chart is the weakest of roofs on top of this move, there are much stronger ones...

From a Lever's Perspective Only

I'm breaking up these updates just because the charts can move so fast on these shorter term charts.

The 4 levers in control today are 3 we knew about yesterday, VXX, TLT (both down which lifts the market) and HYG (up which lifts the market and creates the SPY Arbitrage).

There's a 4th lever which would normally be the USD/JPY, but because of the Australian Central Bank's rate cut overnight, the 4th lever is the carry pair of AUD/JPY.

I wouldn't say that we have hit a target zone that I would have associated with the last two bounce/bases in January, both cut short due to aggressive selling in to price strength, after all today is only the first day out of the descending triangle and is no where near out of the January chop, that would be the ideal target on a bounce, whether it's achievable or not, is hard to say, although that's why we're putting the pieces together and looking at the composite picture.

First as for the AUD/JPY, I'm not sure exactly why because I don't see any significant weakness in the $AUD and I don't see enough strength in the Yen to warrant a call for the end of the move, but when looking at the pair, they do have a negative divegrence suggesting this lever may be about to run its course.

 AUD/JPY with a negative divegrence in to its rally today on the Central bank action.

 HYG with the positive (1 min) divergence seen yesterday and a very parabolic move today with an intraday negative in to that move, looks a bit delicate...

HYG 3 min in an overall negative position with a parabolic move, it seems they really were trying to get this move off the ground after 2 failures in Jan.

And HYG 5 min in a negative position.

The parabolic move is probably just as dangerous for HYG's near term.

TLT which we pointed out a negative in yesterday, expecting it to move lower today, lifting yields which the market follows.

However from yesterday's negative, today has improved to in line.

TLT's 3 min is in leading positive position so it's not confirming the downside.

VXX clearly negative yesterday leading to lower prices today, but at a relative positive divgerence today, a big improvement in its tone.

And a larger view, still ,lots of overall VXX upside gas in the tank as well as a positive divegrence today on a 3 min

And the same on a stronger 5 min.

I wouldn't call this the end of the bounce, but I would say the levers are already starting to show signs of failure.

Leading Indicators/LEVERS

Yesterday I think we made it quite clear that the market was utilizing the market ramping levers simply because it's not strong enough to do it on its own.

I showed you a TLT negative divegrence yesterday that should send TLT lower today as it did, which means yields higher which attract market prices toward them, HYG (High Yield Corp. Credit) also with near term positive divergences as it leads the market (Credit leads, stocks follow) and the 3rd which was VXX (short term VIX futures) which was already in line and acting as a lever yesterday.

Today VXX is nearly perfectly in line with the SPX, HYG is leading as we expected from yesterday's signals (short term)...
 HYG vs the SPX intraday obviously leading...

 HYG's slightly longer term in which it was already in a leading position...

 5 year yields in line with the SPX

longer term 5 year yields...

And as for the TLT negative divegrence from yesterday, TLT is lower, yields are higher and the SPX is in line.

These are the 3 main levers, in fact, so much so that Capital Context's SPY Arbitrage Model that tracks the 3 assets (below) shows the boost the SPY got from the 3 levers being used at once today...

At least $1.50 boost for the SPY...

The SPY is up about $2.38 and $1.50 of that is due to the HYG/VXX/TLT levers.

That's short term market manipulation and we could see it pretty easily yesterday.

In fact in last night's Daily Wrap we had a breadth condition that would normally be considered 1-day overbought with a red close the following day (today), however this is what I said about the condition last night...

"In all 4 major averages, the Dominant Price/Volume theme was Close Up / Volume Down, the MOST BEARISH of the 4 possibilities and in every average except the Russell 2000, it was EXTREMELY dominant....If you know anything about advances on weak volume, this is akin to that, but instead of looking at the average, we are looking at every component stock in the average, thus we are seeing very weak tone in that regard, very much in line with a head fake move. This is part of the reason so many market levers were activated!

Normally I'd say we are at a 1-day overbought condition, but I think this move has to get off the ground, they need it to get off the ground and there's probably a reason for that which has nothing to do with what you'd think, like they need to relieve themselves of some inventory in to demand and higher prices if possible or short in to the same. I'm holding off on calling this a 1-day overbought event which normally sees the next day close red because of the levers and their divergences."

Looking at the SPY chart above, the break above the descending triangle isn't that surprising, it really isn't that important of a technical move right now as it's still in the January chop zone.


Treasury Futures/ TLT Update

Since our last trade idea in TLT (2x levered long via shorting TBT) which made a decent gain (and treasuries overall outperformed stocks last year with an 11% gain), I've seen something that caused me to close out the idea, something TLT hasn't shown for a while.

In 2014 bonds outperformed equities, +11% on the year. However things are obviously changing.

The market maxim , "As bonds rise, yields fall" or "as interest rates rise, bonds fall" is a pretty well known idea as is the concept of the "Flight to safety, out of stocks and rotating in to treasuries". However with the F_E_D about to embark on the unwind of accommodative policy sometime soon (even if soon is defined as the next year or less), there are a number of issues that are just incredibly overwhelming to consider all of them.

Issues such as Bond Duration which is a measure of a particular bond's sensitivity top interest rate moves in the market, not all bonds are the same. For instance, you could say longer "duration" bonds have more duration risk which is a measure of how much a particular bond will move vs a 1% rise or drop in rates. Longer term bonds have more duration sensitivity due to their longer duration, but duration is far from the only factor in determining Duration Sensitivity, other factors such as the interest paid over the lifespan of the bond, call features of the bond, changes in credit quality of the bond all play a role in the duration computation.

We can say broadly that a 1% rise in interest rates would send 10 year bond fund 10% lower while a 1% rise in rates would send a 2 year bond fund 2% lower, the 2 year bond fund has less duration sensitivity.

Additionally a 2 or 5 year bond has not only less volatility due to duration risk, but less time until maturity and would be easier to hold and reinvest the proceeds at a higher interest rate if it came down to it than say a 10 year bond where they are particularly touchy, the shorter term bonds are just going to be less volatile in their movements.

Additionally at 1.776^ yield, a 10-year bond has less yield to offset a price decline, the 30 year yield right now comparatively is 2.366%.

The biggest risk is rates rising faster than expected and as I demonstrated above, the 10 year bond is probably the most vulnerable to interest rate hikes.

Also the F_E_D controls the short term interest rates, but longer term rates are more a function of market dynamics. There are so many variables to consider between interest rates, duration risk, inflation prospects, bank's need for quality collateral as the F_E_D has absorbed a good portion of it, etc., it's quite difficult to look at bonds as we have in the past, especially since the unprecedented F_E_D actions since 2008, there's just not an A-B model to compare, in a sense we are in uncharted waters.

Although I never listen to CNBC as I don't want anything said there to creep in to my subconscious and effect my analysis and because I believe they have conflicting interests, I did catch the immediate analysis after last week's F_O_M_C and one of the commentators thought one of the best trades for 2015, based on what he perceived as a dovish F_E_D stance and it being unlikely in his view that we see a rate hike before 2016, was to buy TLT.

As you know we have been long TLT in a 2x leveraged trade idea that was recently closed because of some 3C signals I didn't like to much.

I've always maintained I'm not a guru, I'm the kind of person who will tell you, "I don't know" if I don't know, although I'll make every effort to find out. In this case, aside from some of the more obvious charts, there are quite a few dynamics I just am not grasping at the moment, I know some of you are much more versed in bonds and if you see something in the charts that strike a chord with you, don't be shy about emailing me and letting me know what you think.

First lets look at TLT because it is exhibiting not only 3C red flags, but price action red flags as well.

 These are the 4 stages on the daily TLT (20+ year bond fund) chart from left to right, stage 3 top to stage 4 decline to stage 1 base, stage 22 mark-up and note the trend line during 2014 and the increased ROC (Rate of Change) in to 2015... Look familiar?

I often say that this "bullish looking" price action is a "Red Flag" warning of a trend change to come. Increased price volatility is a feature we often see just between changes of trends or stages, it's what creates the Channel Buster.

This daily chart alone with a near parabolic daily chart in TLT is enough for me to back off the position.

The long term 60 min chart in TLT for the longest time has been in line or price confirmation, the most recent divegrence is a relative negative on a long timeframe of 60 mins. The white box and arrow is where we entered the last TLT long (2x long via shorting TBT to create the leverage) which was recently closed out because of the 3C charts, but not this one.

At the 30 min chart, note the area of our last long trade entry and the area of increased ROC in price as well as the 3C chart that goes with that area of increased ROC, everything fits and is screaming distribution/Top in TLT. The CNBC commentator's idea to go long TLT is at best a scary one.

 This is the 15 min chart showing the positive divegrence at the rounding bottom where we entered our last TLT long position, again the increased ROC area of price has a large leading negative divegrence, so it's not only a warning of a red flag in price movement, but on the 3C charts as a form of confirmation.

 The near term 5 min chart, which I'm looking at since the F_O_M_C on the 27/28th was in line and has gone negative since.


 As for the 1 min chart, I suspect this divergence which was posted yesterday has more to do with using the decline in TLT as a market ramping lever as TLT is one of the 4 main levers.

Treasury Futures, ZB=30 year, ZN= 10 year, ZF= 5 year and ZT=2 year...

First the 30 min charts...
 30 year T's (with the F_O_M_C highlighted on the time axis in the red box), is leading negative since just after the F_O_M_C, perhaps the policy statement was taken more hawkishly than some are willing to admit and of course smart money is always going to try to sell in to strength, not only because it makes sense, but because of the size of their positions, they need strength, demand/volume.

 The 10 year T Futures looks nearly as bad.

 The 5 year 30 min chart has a negative divegrence, but it's not as big, it may have something to do with a ramping lever but I can't be sure.

 However interestingly and as you might expect for those looking to reduce duration risk in front of a potential rate hike or surprise rate hike, the 2 year T-futures on the same 30 min chart looks a lot better.

15 min chart...
  the 30 year T-Futures on a 15 min chart also look leading negative since after the F_O_M_C (red on the time axis).


 The 10 year looks bad too, maybe not as bad on the 15 min chart.

The 5 year 15 min chart doesn't look as bad to me and I'd almost say it may have more to do with a market ramping lever, again I can't be sure.

7 min charts... 
 Again the 30 year T-futures on a 7 min chart don't look good, especially after the F_O_M_C.

The 10 year doesn't look good either, but not quite as bad.

 Interestingly the 7 min near term 3C chart for the 5 year TFutures doesn't look very good at all, again, this may have something to do with a market lever.

However the 2 year 7 min chart looks just fine.

5 min charts...
 Here's the 30 year... This divergence isn't far off from the one pointed out in TLT yesterday which I thought was being used as a market ramping lever.

 The 10 year 5 min chart...

 The 5 year 5 min chart, not looking as bad as the 10 and 30 year above and...

Again the 2 year T-Futures on a 5 min chart looks fine.

I suspect, although I'm quite open to ideas, that there's a move toward shortening duration , it seems obvious in distribution of longer term T-Futures and the much better looking 2 year charts and to a lesser degree, the 5 year charts.

I'm keeping tabs on how these react over the next week or so, to give them some time to take in the F_O_M_C and see if there are any additional changes that stand out that gives us a better perspective on what smart money is actually doing rather than saying.