Thursday, October 14, 2010

A whole lot of Bad in a wishful market

With so many emails and comments and trying to catch up from yesterday, I have some real catching up to do. Yesterday's "U" shaped or rounding reversal looked quite nasty, even if it was not reflected in the daily close to any significant degree, it just looked like another day up. However, whenever we have a Star like we saw yesterday or a shooting star, it is showing us that intraday, higher prices were rejected.

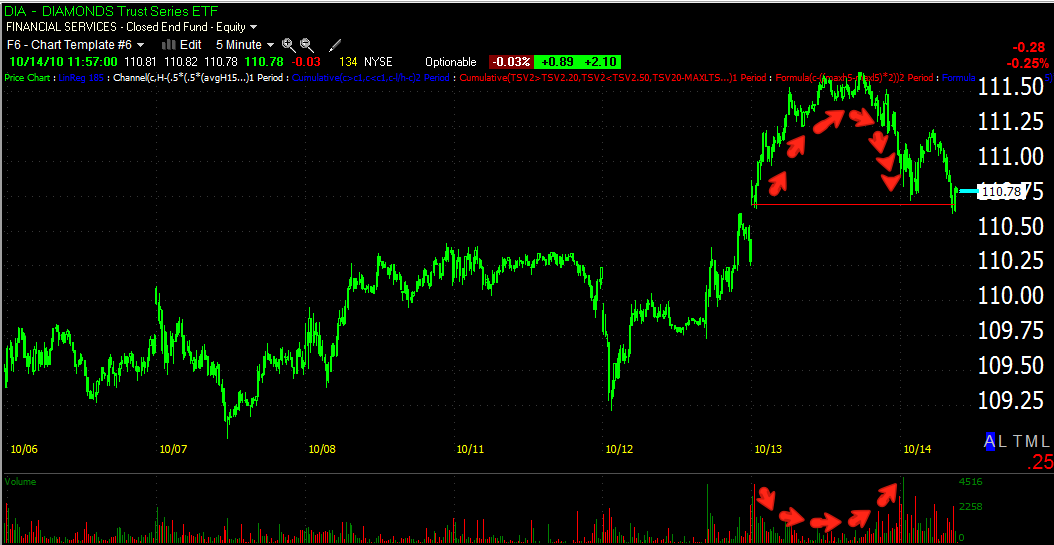
Here's the rounding top yesterday with 3C.

The vertical line is the open of yesterday, this is the SPY 5 min chart. There are no ifs, ands or buts about the negative divergence at the top, and from there into a leading divergence as price finished higher, but 3C was quite a bit lower. Compare the two horizontal arrows to see the difference. This is a leading negative divergence.


The next chart shows a second vertical line which is today. It did not tart out well. However around 1 pm you can see a positive divergence building which finally took shape around 3 pm.

To keep this in perspective, as I mentioned last week, the shorter time frames were going very negative, I said if it kept up we'd see it on the longer timeframes.

Here is the 10 minute... SPY

The 15 min DIA


30 min QQQQ

All in all, yesterday seemed to be an important day.

The VIX divergence is getting stronger, note the last VIX divergence and how small it was relatively, but it led to quite a move down in April.

XLF did show some 3C strength today, although it is still negatively divergent.

FAZ showed likewise some weakness in the 15 min chart today, but still is in a positive divergence.

The strength in FAZ is especially evident on the 60 minute chart-the higher the time frame, the more important the divergence.

GLD 10 min
As you can see 3C has called the divergence/reversals on the 10 min chart. I know it gets a bit confusing, but lets just focus on today.  The day started out with a negative divergence, GLD pulled back a little from there, then we saw the green arrow (confirmation as we saw higher prices into mid afternoon, By late afternoon we were still seeing higher prices, but the confirmation ended with a negative divergence as prices made a new high and 3C started stepping down lower.

This same behavior can be seen on a 1 min chart.

The USO chart has been in confirmation mode mostly until today, as I mentioned in an earlier update. Keep in mind both USO and financials went against the grain of higher Euro prices which is a little strange. I added a couple of indicators that are similar to 3C, I don't like them as much, but they roughly show the same thing.

The green arrows are confirmation, red negative divergences. I'm not quite sure if this is a pullback as USO approaches resistance or the start of something else.

Now some of the underlying fundamentals.

One of the biggest surprises to me this week was Janet Yellin more or less seemingly trying to lower expectations for QE2 and attaching a lot of conditions we haven't heard before. someone of this stature isn't out there as a lone wolf describing her opinions, she certainly had the blessings of BB and this was probably the first of the relevant Fed members to say such things. Bernanke's speech tomorrow should be very enlightening. One thing to remember though, when then Fed talks, the initial reaction to what is said is almost always the wrong reaction. It usually reverses within a a day to a couple of days. If you've been here long enough, you have seen this in action.

Another hot topic is inflation. The Fed seems to think it's a necessary evil to get jobs rolling, but the again it's a catch 22 as it hurts the economy. From the minutes released, they wanted to gear up some inflation, but all of the sudden they got it without any policy changes, I doubt this sits well with the Fed at this point. It wasn't expected, they assumed they could use a controlled burn to produce the right amount and now it's off on it's own doing it's own thing. More QE2=more inflation.

The Fed/Treasury/White House's Chinese Finger Trap that is "Fauxclosure". Don't forget who owns these toxic assets. The problem all comes back to the MBS scandal, as these loans were sold from one to another, any signature that was skipped, automatically throws the loan into question and in some cases a lot more then question. MBS has come back to haunt the banking system, do not underestimate the pile of carp that this is going to create. Why do you think BAC suspended foreclosures the day after the President pocket vetoed the bill that slipped through congress on the ultra-lube express that would have allowed these fraudulent signatures to be recognized in court? It seems everyone who is up for re-election including Senator Harry Reid is now calling for a halt to foreclosures in their respective states-some 40 state's Attorney Generals, Congressman, and Senators. They know the public perception of bailing out the banks once again is not going to go over well with an irate public. On the other side of the coin, if you can't prove who owns the note or there are discrepancies, no title company will write insurance-bye-bye to housing sales (as an aside, this may be why new home builders are looking better on the 3C charts).

So what will the government do? Probably side with the banks in saying it will hurt the housing recovery...which is where? In any case, remember who owns trillions of dollars of assets that are, toxic loans that are being foreclosed on. So where exactly will the bid come from, I personally am looking for a home, but I'm staying away from all foreclosures or bank owned. Remember, these are all part of structured assets as well. Add to that the fact that the banks REO portfolios have in some cases doubled in size, they have a huge problem here. However, this is a post that could take up pages.

Treasury auctions to say the very least ARE NOT going well. Read about the ones this week alone.

Watch for reality... yesterday the headline "JPM Earnings BEAT! 3Q earnings rise 23%"

And look what happened to financials today. Heck, look at JPM today... 3C caught this one right on.

Down nearly 3 % today,  WFC down 4.11%,  BAC-4.29%,   C -4%,  GS -1.93.  With the market headed higher, this is a little warning that ought to be watched pretty carefully.

There's a lot more-Unemployment is not better it's worse. As I predicted and showed you the U6 number jumped big time. The headline U3 number may make it seem not so bad, but the truth, the literal truth is not only bad, but worse and the size of the jump was astounding.

I could keep on going and going, but ultimately, Friday is going to tell the story. There's a whole lot of bad and a market way higher then when it believed there was a whole lot of good.

Yet the markets drift higher on what they believe will be QE2, which is not even confirmed at this point-I fall back to Yellen's speech. Tomorrow Bernanke will speak, the market is high right now as you can see in after hours, but I'm willing to bet that QE2-if the market even gets what it thinks, is going to be a lot different then QE1.

We'll see tomorrow.

Off to do the EOD research...

I have a lot of email requests so I'll try to fit as many in as possible. I usually get about 60 emails/comments a day so you can imagine how in the weeds I am after being out 1 day. Thank you very much for all the well wishes, it's very much appreciated.

GOOG

GOOG charts before the close....

 The 5 min.

 The 10 min-both in leading divergences.

Google is up in after hours...

The 60 min chart, a question of "will it hold?"

Today's NASDAQ 100 Breadth


Breadth in the Q's has gone south pretty badly.


 As I expected in the last market update, the negative divergence was a pullback. We still are in positive territory, but the SPY is starting to fade next to the others.


However, the negative bias of yesterday and the days before has made it's way to the 10 min charts (more serious) as you can see below. The Bernanke speech tomorrow should be some event.

Request for UUP

 5 MIN-PRETTY MUCH IN LINE WITH THE EUR/USD TRADE
 15 min showing a positive bias for the dollar
 30 min showing the top in red and a positive bias since.
Here's the daily chart, you can see the first positive divergence moving the index up in 2009, confirmation at the green arrow and then a negative divergence at the top. The positive bias in this chart is the position of 3C now relative to the position of 3C and price at the same level. Price is clearly lower, but 3C is virtually lateral when it should be much lower if it were confirming the weakness in the down trend. This same positive bias is seen in all of the charts above.

FAZ on Any Pullback

As you can see, 3C has called every major reversal in FAZ. The support I spoke of that would likely be broken, you can see at the faint red horizontal line. You can see it was broken yesterday on a strong 60 min. leading positive divergence, in other words, the break yesterday was accumulated and we are seeing a decent move in FAZ today. Since it has not broken out of the range yet, I would consider any pullback an opportunity to get long FAZ. You can always confirm with me as to 3C's disposition on any pullback, but this is looking very strong and for good reason. The financial sector is about to be thrown into massive disarray. If you think the Foreclosure Scams are not going to effect financial institutions, I think you may be underestimating the roots this thing has already put down. Americans are not going to be in a generous spirit when they understand the depth of the fraud committed against the American taxpayer after we bailed their butts out once already and saw nothing for it.

Looks Like a Reversal Again

1 minute 3C is starting to show negative divergences and it looks like we'll see at least a pullback. The positive divergence was big enough that I would have expected more upside, so this may be a pullback within a longer move up, it depends on whether 3c 1 minute goes into a leading negative divergence.

time for a bounce?

The Market has taken out the first support, now the gap from yesterday is the second support, price is trapped between the two and it's about time for a bounce.

 You can see the trading range has been getting tighter this a.m. which typically represents an area of a bounce or sometimes a reversal.
 DIA 1 min.
 QQQQ 1 min
SPY 1 min
The more important timeframe is the 5 min. which shows distribution in the long and short 3C indicators throughout yesterday and today starting around the top of price yesterday

Thank you for all the well wishes....

I'm still trying to get caught up. Here are a few requests. Someone asked about FAZ, I have favored FAZ for several days now as a long, XLF has had the mirror opposite look in 3C, this in itself is strong confirmation to me. I thought it would do the old black box or new black box trick and take out obvious support, it did, but was still a good buy. It's up over 5% today on good volume.

TREASURIES the ETFs are tough as they don't have a lot of volume. What I'm seeing in IEF, the shorter was some negative divergences in the long 3C, the last two days it has shown significant improvement.

Here's the improvement in 7-10 year IEF

Here's TLT 20 year+ note 3C basically in lockstep with prices until the positive divergence, these are short term possible reversals.


TMV, the bearish 30 year  looks pretty much the opposite short term. I think there's a lot up in the air with inflation, the FED WANTED to see inflation, but they wanted to create it, it is now creating itself which would raise the prospect of it getting out of hand. There was a piece in Bloomberg from the Fed's Lacker who said creating jobs was imperative, but risked inflation. It's an interesting read and it's right here...

http://www.bloomberg.com/news/2010-10-14/fed-s-lacker-says-making-jobs-a-policy-imperative-risks-inflation-bias.html

GLD...
The last two days has not looked like a strong 3C trend. Although this is one of those trades like i or the dollar that seems impossible for it to go in any direction then  up, all of those trades I mentioned did break their trends.
As an interesting aside, before I heard about the shoeshine boy story, during the housing boom, I had said, "when house-wives start to become real estate speculators, you know the end of the trend is near."

Interestingly, if you are looking for a job on something like Craig's list, there are a million positions available for life insurance agents and no matter what your resume says, YOU ARE PERFECT for the job. Well we had a garage sale to get rid of anything I haven't used in the last 6 months and this guy who is a life insurance agent calls me the day before inquiring about whether I have gold jewelry for sale. I told him, " I don't think so", but guess who shows up the next day just to double check. It reminds me of the shoeshine boy story or the housewives. In any case, that's just an aside.

As for FAZ/ XLF, here are the charts that REALLY count. There's now correlation between these two unless 3C is picking up on a real correlation of one being bought and one being sold.

 FAZ
XLF

I'll try to get to more of your requests...

Again thank you for the well wishes.

FAZ Trade

I've been talking a lot about FAZ lately and it's good positioning to take a shot at this one long. Including the warning that it may take a shot at breaking support, that is exactly what it did and has turned into a nice little trade. I think it's still in a position that it is reasonable to consider buying here.


FAZ LONG


This hourly 3C chart shows distribution (red arrow) at FAZ's top in August, price proceeded down from there. Since then it's formed a small double bottom and both bottoms have seen accumulation (white arrows). In the red square, while price is near the bottom lows, 3C is moving into a leading positive divergence, the most powerful sign of accumulation. I believe this is a decent entry point in FAZ. Recently we've been observing a black-box trading system trend that breaks typical and obvious technical patterns that T.A. users recognize and place orders because of them. These false breakouts I estimate to be occurring about 85% of the time when you have an obvious technical pattern. So a double bottom, even this small, may induce a black box system to run stops under that support level so make sure your risk management and position sizing allows for those stops to be run-in other words, widen your stop and don't place it under that support, but a bit lower, you can always add shares later. Otherwise, this is probably a decent entry point. 

FAZ's inverse counterpart, XLF is seeing a similar inverse pattern of distribution.


Late August XLF saw a good deal of accumulation at the white arrow, it sent prices higher to the September top where we see a negative 3C divergence or distribution at the very highs. Currently XLF is also in a leading divergence in the red box, but it is a negative leading divergence or heavy distribution.

The bottom line, financials are seeing distribution while FAZ, the inverse or short ETF on financials is seeing accumulation. FAZ is a leveraged trade, 3x so it can really move for you. Your other option would be to short XLF, but you'll get more bang for your buck going long FAZ.

Good luck!

Rounding tops

Here's the intraday action in the 3 majors, all are near important support on increasing volume.

 Yesterday presented a rounding top in all 3 averages. Note how the volume/demand falls off at the highs and then picks up again as price heads down. Also note the high volume we have at yesterday's last ditch support.
 A closer view

The Dow 11,000-still the big news?

I have showed you the 5 min 3C chart which has been on a path of straight, unabated distribution.

Here's the 5 minute above

As I said, if the 5 minute keeps up at this rate it will make it to the 10 minute and so on. This is very ugly and I wouldn't be surprised if this was in fact forehand knowledge of what the numbers this week were going to look like.

NEGATIVE 1 MIN DIVERGENCES

Both the DIA and SPY are close enough to call negative divergences.

What's really amazingly scary this a.m. is the economic numbers out. As I mentioned way back when we had our last GDP, a trend in economics is difficult to reverse once it has momentum, and the GDP downward spiral has momentum.

The trade deficit came in 2.3 billion worse then expected which makes this one of the worst numbers we have seen in years. No wonder there's a salvo of currency battles.

The fact the deficit is so bad, will certainly revise the Q3 GDP lower.

PPI ca,e in at .4% on expectations of .1%-remember I told you that capacity utilization was trending up and this would affect inflation at some point-some point in now. As expected, the majority of the increase was due to the horrible grains season and higher oil prices which were bound to hit consumers at the pump.

Finally jobless claims up from 445k to 462k.

This might make for a decent argument for QE2 if this were a vacuum, but it's not. Fauxclosure gate is gaining momentum everyday. Write downs are coming, reserves are going to be increased for banks because of this and there are several root that will fan out from that mess. The involuntary inflation, although the Fed wanted some inflation, is not the controlled type they were shooting for so this has got to be causing some second guessing as the more the Fed prints, the more inflation we'll see.

All in all, today was not a god day of eco releases.

Sometimes I think it's probably a good thing to take a break from the market...

Forced or voluntary.

I just ran across this story, the Fed's hawks are openly questioning QE2, not such a big deal in and of itself, but it gets more interesting with Janet Yellen (Fed Vice-Chair) coming out before the minutes were released and seemingly trying to ratchet down expectations. In any case, it's worth a read....

http://www.zerohedge.com/article/st-louis-fed-says-qe2-would-be-useless-and-may-be-damaging

Back...

Very sorry for the lack of post yesterday, but from the moment I woke up until an hour or so ago, I was under the weather (more like a hurricane), but I'm not going into the details. This is actually the first time I've been out of bed since yesterday at 10 a.m. so I'm going to do some catching up, see where we are at and have a post out very soon.

Right now we have 1 min positive divergences in all of the averages, that started at 10 a.m. the one in the QQQQ is losing a little momentum so we'll see if that brings about a reversal.