Thursday, January 23, 2014

Some Screen Captures of the New Website

This website  has taken a bit longer than I anticipated, but it's going to free up a lot of my time to focus more on the market, it's going to make your experience more efficient and add new features.

I have some colors, but I thought I'd run them by the people who'll be seeing them every day so you input is appreciated.

This is the header and basically where the posts will be. There are several tabs like "Resources and Concepts" which is an expanded area, a quick link to the Risk Calculator, etc.

There are also monthly archives as well as a panel with the day's posts for a quick view and the day's trade posts. Below there's a link to manage your account and log out.


You've seen this before, the Risk Calculator based on the 2% rule as well as maximum position size which you can input.

 This is part of your account settings, username, password, the ability to upload a small pic/avatar as well as your location and timezone for how you want posts to appear.


There's also a biographical section which you can see some of below which will consolidate all members' answers and you can see how you fit in in different situations, it's actually helpful once you see how it all works. All information is private, I won't even know what you checked off and there's nothing personal like "account size". 
This is where you'll also be able to choose the post types out of about 6 that you want delivered to you real time email or choose all/none.

There are a lot of other features that just aren't ready to show yet, but as far as contrast, readability, etc, I'd love to hear opinions.

PCLN Update

I have not forgotten about PCLN, I was considering taking some on here today, the process in PCLN looks good, although the move above $1200 could last a bit longer to make a more proportional process.

There has been distribution in to the +$1200 move, I'd like to see more so a market move off today's bad news in to the gap, might just provide a better looking position/entry.


Quick Market Update

I still think we'll get a corrective bounce, but the market is still weak.

XLF 1 min has a good basic chart that shows why we should expect a bounce, but even as an aggressive trader, I wouldn't try to trade it.
There's a more recent 1 min positive, there have been some more recent positive divegrences since about 2 pm and we have a rounding process about the right size. To reiterate though, this is still one of the weakest positions for a bounce in to the gap I've seen.

MCP Trade IDea

For those who like MCP long, it has done everything I was expecting yesterday, the "W", the shakeout and now the leading divergences. I'll be looking to fill out any call and equity long positions I can as I had some trouble getting some option positions up to size.

The Yen May Help Out a Bit Too

A bounce on a day like this is almost a foregone conclusion, especially if it's on  fundamental data that the market had not discounted such as the BOJ considering how to start tapering a 2-year QE program that is less than a year in to it.

The bounce isn't a big deal or a problem, in fact it's helpful with information like how far did it do, is it creating a downtrend because trends are like waves (back and forth), how much confirmation or distribution was present during it, which sectors lagged the most and allowing us opportunities to open or add to positions.

There's VERY, VERY little in the averages themselves or Index futures that would suggest a bounce, most of that in the way of probabilities in in the VIX short term futures and now maybe the Yen as this is really what today's trouble is all about.

Here are the charts that suggest a bounce and how far they go, which is to say the same thing as before, this market right now is extremely weak, it has been on long term charts, but now it is insanely weak on shorter term charts like I've never seen before, but I've never seen trillions of dollars pumped in to the market either by the F_E_D and how that all unwinds, the closest model would be 1929, but that's not even realistically close.
 VXX 5 min very strong, I pointed this out yesterday, it has added to that strength today.

 Only the very short term charts are saying pullback which is bounce for the market.

The Yen of course has been ground zero for us lately...
 We now have a 1 min intraday negative on the Yen

 However the 5 min chart (as mentioned last night along with the 15 min and 30) is very strong and broken out of an inverse H&S bottom.

This 30 min chart has been positive all of 2014 and the Yen has been trending up since the 2014 low as the carry crosses are all trending down since the start of the year.

This additional information just tells us what I've already said, extremely weak in the market, probably a good time to fill out core shorts on any price strength.

Market Update

Normally I might consider playing a bounce as there would almost always be a bounce on a day like this, but I require signals to enter positions. There a large enough reversal process in place in almost all of the averages (except the IWM), the VXX is too parabolic on it's move up and it is the only hint of negative divergences 1-3 min that suggest a bounce, the 5 min VXX is VERY strong.

This means that we should get a bounce in to the gap, but there ARE NO INTRADAY POSITIVE DIVERGENCES TO SUPPORT THAT PROBABILITY WHICH I DO THINK IS A PROBABILITY. THIS IS A NEW LEVEL OF WEAKNESS IF 1-3 MIN. INTRADAY CHARTS CAN'T EVEN GIVE ENOUGH OF A POSITIVE FOR A SMALL GAP FILL.

BIDU CORE SHORT Follow UP

BIDU is one of our core short positions (trend trades), one that's in the green already, one that I'd like to add a bit more too and will get the chance at some point.  I thought I just updated BIDU, but can't find the post, perhaps it was part of a Daily Wrap.

Here's what we have so if you are interested or in it and want to add, you'll need to set some price alerts in gaps above.
 I could swear I updated BIDU just yesterday because I recall the H&S coming out of a bullish ascending triangle, a triangle that is too large to be a legitimate consolidation price pattern. 

The H&S formed on the breakout above that triangle. Other than a 1 min positive, there's not much there at all. I think BIDU's best hope for a bounce with today's volume is an intraday rally that turns the current bearish candlestick in to a bullish hammer, on that kind of volume it would be a VERY strong bounce signal and being it's a fresh break of a H&S, I'd much rather be adding to BIDU on a bounce and not on a new break of a H&S top.


 The Trend Channel (2-day setting) has held the trend including the triangle consolidation, that's what's so great about this channel vs an envelope channel or something similar. However as of tight now, if we close here, the trend is stopped out as you can see at the red arrow.

The 3C signals are there for the H&S top as you can see on this 15 min

Larger signals are there like this 30 min

And the daily shows the stages of a cycle, accumulation, mark up, distribution which we have gone through and we are on the edge of the final stage, decline.

So I'd set some price alerts, this is an excellent candidate, it's in excellent position now if you have the patience for some volatility, but my job is to get the best entry so I'll be setting alerts and looking for that candlestick to maybe change to a hammer.

The Only Thing, VIX futures

That's it, even industry groups look horrible, ESPECIALLY TECH / XLK.

The 5 min VXX/ VIX futures looks good, I pointed that out yesterday, just the 1-3 min intraday charts look like the market could go for a gap fill or something, I'm not sure how much because there's so much damage.

The actual 1 min VIX futures confirm VXX, but UVXY doesn't look as bad, in either case, that's the best evidence for a bounce, not the averages, not the Index futures.

Based on that, I'd say we will still see something, what it turns out to be is a mystery, again I think we are going to see another shift or change in character, perhaps gap related.

NOT LOOKING GOOD

Even for the normal gap filling bounce.

The best looking of the major averages was the IWM and not very good looking at that, I'll show you what has happened there. Index futures aren't doing any better so this is as good as it gets and it's not very good at all.

 That 1 chart, the IWM 1 min that was leading positive, well this is what's left of it now.

No migration even to the 2 min chart.

 The 2 min chart in scale showing distribution on yesterday's "Big run".

The 3 min chart which went negative very quickly yesterday almost straight down, it has just added to that today.

Make no mistake, this does not look good, I'm glad we got in to position when we should have (I know it's hard, but this is the reason why).

I'm going to browse around some more and see if there's anything I'm missing

IWM / Market Update

This is an example of what I mentioned earlier, a "V" shape reversal. Remember tomorrow is an op-ex Friday (yes, even the weeklies get pinned). 

The best way I can describe what this looks like is a bottle rocket getting ready to go off, a sharp move up a little pop and falls back to earth and op-ex may intensify the need for that process.

What we'd want to do is to look for the bottle rocket to go off and pop and then see if there are decent shorts that also moved up with the kind of negatives the IWM has, that would give us a great entry (equity or puts) and a high probability move lower which also gives us a better price, less risk and better timing.

See my comments from this morning's 11:17 market update...
 This is the sharp 1 min positive I mentioned in the market update referenced above, it looks like a quick effort to fill the gap, not a quality effort, that takes time.

The little Inverse H&S or whatever it is is in place, it's the process that is important, but it's really small thus far and I think my description of the bottle rocket is appropriate.


The 2 min IWM chart has NO positives at all, meaning the divegrence we see above is not as strong as it looks, this leading negative makes a move higher worth seriously looking in to shorting.

Of course if the 3 min is negative, the institutional 5 min is not going to be touched and it is in bad leading negative position.

As for the Yen, the 1 min chart shows some loss of momentum, but everything after that is holding together fine, it's what I'd expect to see (confirmation).

The USD/JPY since the start of the year in a downtrend which WAS NOT BROKEN ABOVE $104.91, means this break of $104 today is likely going to see some volatility, but the end result should be the next lower low.

This is why I have been saying, we're already on the right side of the top, it's not apparent in the market and as I had said at the time, Wall St. isn't going to send up a flare and tell you a top is here, but the carry trades betray what they are doing.

Look at past tops, 1929, 2000, 2007, they are at the end, sharp reversals, not big rounding tops, at least they aren't when they happen, only in retrospect, but it's too late to make money looking back in retrospect.

UNG / DGAZ Follow Up-New Trade?

Yesterday in the UNG/DGAZ Follow up (for the DGAZ long) I said the following,

"My thinking as of now is that the weather is being discounted as UNG is up, tomorrow morning is the EIA Natural Gas report comes out, the best scenario would be a sell the news reaction as it seems the weather is already discounted. So I'll give the position until tomorrow to make that decision."

The EIA report came out this morning and it was the best scenario I could hope for. My guess was NG futures were accumulated (that I know for sure) while the US markets were closed Monday for MLK day, thus Tuesday we gapped up on more of these polar cold snaps. I was hoping the market had been discounting the weather and the EIA report would come in without a large, unexpected draw and the reaction would be to sell the news.

Here's this morning's EIA Nat. Gas Inventories...
 I highlighted the important part, the draw was no bigger than expected.

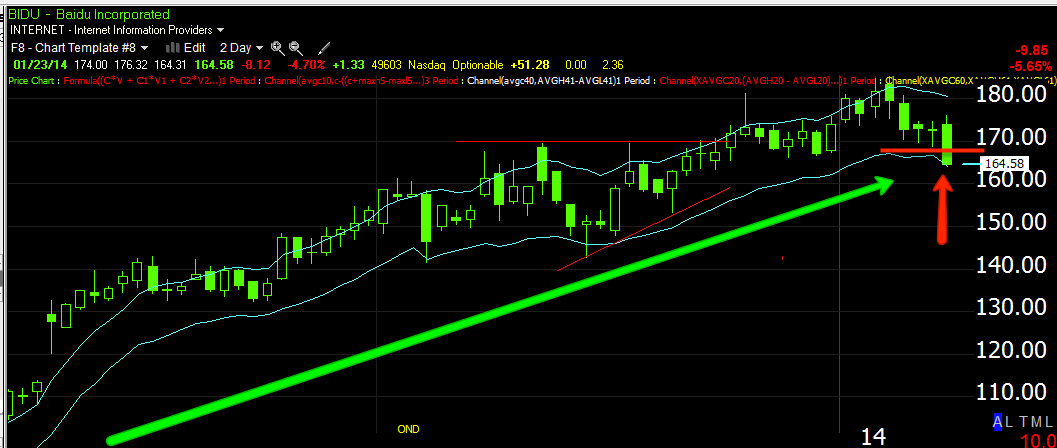
As for the UNG set up (daily chart)

 This is the prerequisite and how I deal with all H&S tops, even a small one like this. They have to have a preceding uptrend, a lot of people see H&S patterns in downtrends or without a sufficient preceding uptrend, they're usually random price patterns.  You can always and should always confirm with volume, you can create a simple indicator to do this using a cumulative indicator with the formula "V+V1" (volume today plus volume yesterday in a cumulative indicator). What should happen by the head is volume falls in to the rallies and increases on the declines, the left shoulder isn't important, but from the head to the right shoulder that volume needs to be there.

"A" is the preceding trend, "B" the H&S top, "C" is where technical traders short it on a confirmed break and "D" is where Wall St. shakes them out as this set up is a century old and predictable as can be. The red "X"s are the 3 places I'll short a H&S top, NEVER at the break down. This one went a bit too far, but I think it's salvageable.
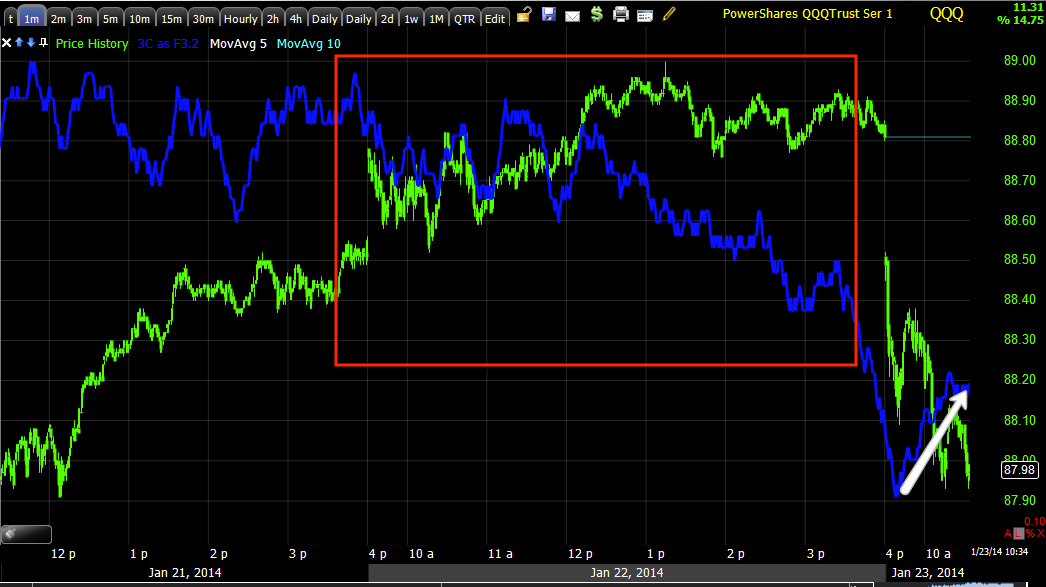

NG Futures
 1 min intraday NG we have some chop, that's fine, we need  congestion long enough for a reversal process and if you are considering taking DGAZ as a new trade, you'll want to get it as low as possible (NG higher or near the top of this range).

The 5 min chart though is what counts and I'm THRILLED to see this leading negative divegrence in NG futures on the EIA report and in to it. This confirms my thinking, now we need the signals to confirm my thinking, that's all that really matters.


 And NG 15 min is already showing a negative divegrence, this is great so far, exactly what I was hoping for if not better.

Check the volume too, with a choppy range today that volume looks like churning.

UNG Charts
 from confirmation to a negative which will usually start on the 1 min chart and move to longer charts "if" the divergence is strong enough, this is what I call "Migration of the divergence" or strengthening.

We see the accumulation areas, here we see a 2 min relative negative so there's some migration at work.

Here we see accumulation areas and a 3 min negative so that's good as well

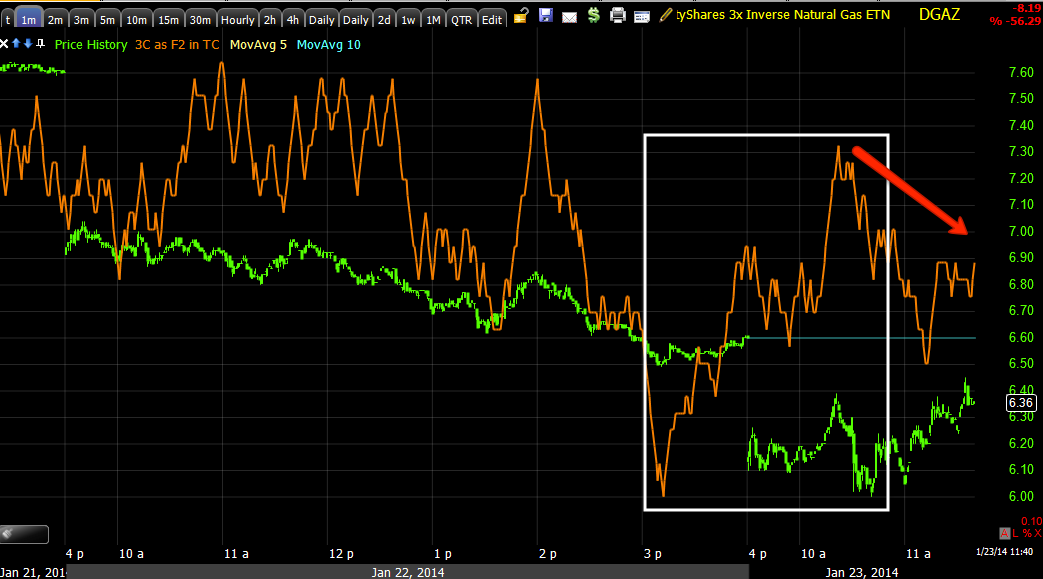
DGAZ (3x short Natural Gas or UNG) ...remember I LOVE UNG as a long term long, NGAZ long was a UNG pullback play, once it was over I intended on adding back some of UNG I took off the table (left some on the table as well).

 DGAZ 1 min is leading positive this morning, the slight negative is enough to send it back to the lower range and accumulate more, that's where they'll accumulate, not chasing price higher.

 3 min is leading so that's a good sign, the longer DGAZ stays here and builds a base and the stronger the divergence, the better looking the probabilities.

We even have a 10 min DGAZ positive divegrence from today only ...

So this is looking good although a bit early. For those who may be interested in DGAZ long, I'd give it a little more time. For those in it like me with drawdown, I think we'll be fine.

I can't add to the position, well I could, but I'd be violating a basic risk management rule, unless you planned to phase in to a position BEFORE you entered the first share, AVERAGING DOWN or Dollar Cost averaging is a BAD HABIT. We might get away with it here, but you try it one too many times and they'll be carrying you out feet first . 

I might look at a UNG put if the situation sets up, but that's more for members.

So far, so good.

Market Update

I'm watching the charts including index futures and some of the 1 min charts are getting sort of extreme or strong for a bounce, the 2 and 3 min charts aren't or are barely moving positive. It almost looks as if there may be a sharp upside correction, more "V" shaped than usual.

If the 2 and 3 minute charts stay like this or get worse, then I'd say market makers / specialists/maybe some HFTs may be trying to unload inventory from yesterday''s levels.

We'll see shortly, this is just a little bit of an unusual divergence.

Market Update

First my view is Don't Chase, this is why we enter shorts on strength, if anything I'm looking at longs on weakness, MCP for example although I don't want to be anywhere near leaning new long, there are a few I like.

The market is trying to get a foothold here, technical traders see a break of a level like the 1/21 lows, think support is broken, go short way deep in to this move and the first shakeout/bounce washes them out, this is what I mean when I say they use Technical Analysis against you, I can predict where the stops are, they can see them with the full book!

That being said, I'm not letting go of any of my short positions either, just sitting on my hands and looking for the opportunities, they'll take care of themselves.

Here are some charts, you'll probably find them interesting as several intraday extremes were pointed out yesterday, when you see the charts below you should remember, so was there some insider knowledge? I don't know, I trust the IMF about as much  as I trust the F_E_D, but the weakness was there.

I might take some profits in puts, but right now I don't have many, I've been missing fills left and right on options. I do want to point out I was talking to a member yesterday about the IWM Feb. 118
Put which was down -24% yesterday, I said, "That can change very quickly with that much time"... today it's down only 11% of position, not portfolio.

 SPY 1 min positive, note the intraday rounding which is more advanced than this capture, this is trying to get a foothold and probably will, not a big deal, but this is why we don't chase.

Remember the QQQ / IWM charts with extreme intraday negative divergences yesterday I posted? This is the QQQ, it too is trying to get a foothold here, but the interesting this is the distribution in to the afternoon, it was pretty sharp. I think the IWM was worse and that's why I was looking at SRTY yesterday (3x short IWM), that would have made for a quick trade this morning if opened yesterday.

 This QQQ 2 min chart was perfectly in line and then the floor fell out, it's still leading negative after this morning's move so we do have some serious weakness.

Remember this IWM chart-3 min that went negative, but nearly a vertical drop, it has added to that divegrence since then, but that was strong, fast distribution.

My Custom SPY/TICK indicator shows the market is trying to get a foothold, we want to pay attention in case it fails, but the shorts are/should be in place prior to today, I'd really be careful about chasing anything here unless it's in good position.

Market Update

You'll have to excuse me this morning, there are quite a few short trading positions I needed to check on as well as some possible trades and some other current trades, MCP still looks good by the way (long).

I think it was yesterday I had pointed out what seems to be that new dynamic I've been looking for (recall, "Whoever figures out the new dynamics of the market first, wins"?), when the 60 min Index future charts are negative, the market doesn't handle shocks well, on the Index futures charts I showed we have had 3 this year, today is the fourth although smaller than the previous one so far.

Additionally, as long as the Yen stays strong at 30+ mins, the market also doesn't handle shocks well. China's HSBC PMI dropping in to contraction didn't help either. We've had both divergences at least as of yesterday.

What happened last night is what I would call a fundamental event, something the market hasn't discounted, in this case the mere suggestion that Japan "should, uh...maybe start thinking about how they'll taper QE-Zilla" from the IMF. So we get a knee jerk reaction, but the knee jerk reactions haven't been to the downside very often, that's another change in character over the last several months, but especially 2014.

 Every one of these 60 min negative divergences in Index Futures this year has been followed by a sharp downside move, it use to be 5 min charts that were the timing factor, but I think these are stronger breaks.

The Yen 30 min chart has stayed in a leading positive divergence all of 2014 and since it has been, it's been heading higher causing the carry traders a lot of money at 100:1 leverage.


 I was hoping USD/JPY 104.91 didn't see an upside break, it didn't, the 2014 downtrend in the carry pairs remains in effect.

This is why the trading portfolio has been leaning heavily short (SPXU 3x short SPY) as the first rounding area was big enough, but add the second and make a large "W", even better.

We'll see if the market has a new dynamic on gaps, I hope it does as the breakaway and exhaustion gaps were very useful, over the last 4 years HFTs have been ruthless in filling them and we have a decent one today, but these are the new rules we need to learn and learn fast.