Tuesday, May 12, 2015

Daily Wrap

Lets start at Friday's The Week Ahead forecast...

"I believe  we will see early weakness on Monday. HOWEVER THIS PART OF THE FORECAST IS NEAR MEANINGLESS COMPARED TO THE REST SO I WOULD NOT GET TOO HUNG UP ON THAT.

I'm still expecting a $USDX led bounce in the equity market as well as the bond market, certain stocks are going to be shorts before others, but this gives us a chance to open or add to any positions we may want to tweak a little.

As I have tried to make clear, it doesn't look like smart money is even participating in this move, thus my own participation level is so low at present having closed VXX puts today.

In comparison to what comes next, this bounce is nearly meaningless like Monday morning's forecast."


As you probably have gathered recently, this isn't a new idea to us or a new correlation. We'll still get individual signals that give us ideas or insight on an asset, but the same singular asset is moving just about everything now and you can probably tell by the way I highlighted the "Week Ahead" forecast's first few paragraphs above.

To be sure, there are a lot of interesting things going on, but this is like that ballet that I wrote about several weeks ago, the closest thing to beauty I've seen in the market... The two posts I'm talking about are here if you care to read them, Important Market Update Part 1: The Forecast and Important Market Update Part 2: The Forecast Plays...

I can show you a few things we expected such as a Bond pullback since entering a half position last Thursday, Trade Idea: Long Bonds / TLT and the follow up charts, Bond Rally / Swing. Both expressly said that the initial position was a half size position because I suspected we'd see a pullback in bonds / Treasuries and we'd add the second half of the position once that had occurred and we had good confirmation on the charts.

Take our expectations near term for the market. Friday I closed 2 sets of VXX puts at a gain Taking Both VIX Puts off the Table and then turned around and entered VXX calls later in the day, Trade Idea-EXCEPTIONALLY SPECULATIVE...VXX Short Term Calls which was in large part, based on the Week Ahead's expectation of early weakness this week in equities. We saw "some" yesterday and the Call position was at a double digit gain as of yesterday's close, but the expectation that we'd see deeper weakness early in the week is why I left them open yesterday and didn't close them until today, Closing May VXX $20 Calls From Friday at a larger gain, VXX Call P/L which was exceptionally timely.

While the market did see some positive divergence today, it was clear through nearly every update this afternoon that I was looking for the market to come down, accumulation to occur on the move lower and the charts to look a lot better for a potential position for the next trend we forecast on Friday which is the bounce and that is followed by...

"In comparison to what comes next, this bounce is nearly meaningless like Monday morning's forecast."

Again these are all connected by one asset that seems to have unusual high levels of relevance right now for a particular reason...

Here are some of the correlations I captured, as you'll see almost all are nearly interchangeable or inversely interchangeable because there's one asset they are keying off of which I highlighted above in the except from the "Week Ahead" forecast from last Friday...

*The $USDX is in purple and the comparison symbol is the green/red candlesticks*
 $USDX vs 30 year Treasuries... As you know, I'm expecting a counter trend rally in Treasuries and a short squeeze, thus the long position that was partially opened last week and posts today looking for the opening to fill out the second half of the position, TLT/Treasuries Counter Trend Rally Follow Up.

 $USD vs NQ/NASDAQ 100 futures. Obviously our forecast was for near term early weakness this week, building in to a base the averages can bounce off (which is what almost all market updates today had in common)  followed by the final or largest trend, a move to the downside.

Although we entered VXX puts and calls and exited them based on the 3C signals, with this kind of correlation if you understand what is driving the NASDAQ futures, you understand what is driving the VXX short term futures as well as Treasuries above.

Or how about today's GLD/Gold Trade Set-Up, GLD / Gold Long Trade Set-Up ?
The $USD's correlation to Gold Futures. Again, the idea for the Trade-Set-up in gold futures came entirely from 3C signals, but I noticed all of these different assets were aligning near perfectly several weeks ago which is why I took both days of my weekend to write the two posts liked above.

Remember yesterday's call, USO/Oil Update, for a bounce in USO today?

"I suspect a near term (as in a day or so) bounce off support/resistance of the base, that "loitering" in the area and likely has to do with $USDX expectations and some very near term weakness, but I fully expect a strong pullback to follow so I suppose we could call any short term bounce the minor trend, the pullback , the swing trend and the eventual breakout to stage 2 the primary trend."

And what did we get in USO/Oil today?

 The bounce that was forecast yesterday with a bearish upper wick on USO's daily candlestick on heavy volume suggestive of churning just as we saw on the last break above the large base's resistance that we had also forecast or suspected almost a week in advance. Both candles are indicative of bearish churning so the "as in a day or so" comment above, so far doesn't look that far off, but we'll take a closer look in a moment.

 This is the correlation between the $USD ETF UUP in green and $USO in white with the $USD price inverted...again, the correlation is there whether 1:0 or inverted and that wasn't all, although from the move in oil and the trade idea in gold, this shouldn't be surprising...

As the $USD (UUP in green) took back all of yesterday's gains, commodities in brown moved almost in mirror image correlation higher.

The point is really the same one made at the top of this post in the form of the excerpt from Friday's "Week Ahead" forecast,

"I'm still expecting a $USDX led bounce in the equity market as well as the bond market"


 These are the major averages, all of which closed red today as the internals predicted in last night's Daily Wrap Beyond any other signals in the averages or VXX, internals specifically called today's price action in the major averages...

"The Dominant price volume relationship today was in all of the averages except for the Russell 2000 and it was closed down / volume down, which I have nicknamed, "carry-on" as in keep doing what you're doing, meaning the market is likely to move down tomorrow as it did today as there are no short-term internal imbalances."

The laggard today was transports in salmon, the leader that actually closed green was the 20+ year Treasury Bond Fund, TLT.

Even though I think we get a bounce across the entire treasury curve, since last Friday's Non-Farm Payrolls the 5 year bond is above the level when payrolls printed, the 10-year Treasury is just about flat and the 30 year is down; this in addition to a very thick short presence in Treasuries making a short squeeze very probable. Remember though, like the our wheel hub asset, I expect Treasuries to put in a strong COUNTER TREND BOUNCE/RALLY... NOT TO REVERSE THE TREND!

 This chart shows TLT in red vs the SPX in green, remember that the long end of the curve is underperforming since Friday's payrolls, but had I put 5 year Treasuries up here instead, they'd be moving in near sun with the SPX, although there does seem to be a slight leading relationship with Treasuries just as the $USD seems to have a leading relationship right now with gold.

 This is an intraday ONLY view of TLT in blue vs the SPX in green, taking away the underperformance of the last 2 days since the 8:30 a.m. Friday Payrolls print and really, the March revision down to 80k, a HUGE MISS.

This is our Wheel Hub" asset which everything else has some kind of correlation to, even if removed by an asset or two (LIKE THE KEVIN BACON GAME).
 This is the Daily Chart of the $USDX with a strong (carry trade on) trend through 2014 with strong 3C confirmation (green arrow) which suddenly starts to go negative, then leading negative, then as we forecast on April 2nd, the $USD would see a bounce, but a much larger decline following that. The $USD's bounce FAILED to make a higher high for the first time in the trend and on our "Larger move down" to follow, $USDX made a lower low to match its lower high, both on a closing and intraday basis.

I have expected what in the $USD recently as we have come to the area just below support (Think about the 3 places I'll short a H&S top and the 1 place I WILL NOT), the concept here is EXACTLY the same as 3C leads to a new negative low... The "Volatility shakeout" as a bunch of new $USD shorts have entered on a lower high and lower low as well as a break to a new closing and intraday low just below intraday support... a Perfect area to run a shakeout of the shorts and squeeze them.

Taking a look at some of the important charts for the $USD, you may recall exactly what I have expected near term for the $USD as well and why... Hint: the 30 min $USD 3C chart...
We have had a leading positive divergence in the $USDX suggestive of another...

Counter trend bounce ($USDX 60 min)...

 You've already seen the larger accrued trend of $USD / 3C on a 30 min chart... This is the 10 min 3C chart of the $USDX, what does it look like it's getting ready to do near term?

Lets compare it with one of the averages on the EXACT same timeframe...

The QQQ 10 min leading positive divergence, this is the chart responsible for the forecast suggesting a bounce after the "early" in the week weakness ended.

 A look at the 3 min $USDX chart is suggestive of the timing for the move becoming very close much like our expectations intraday for the market. As you may recall, there were a couple things I wanted to se before deciding whether or not it is a safe enough base to take a bounce position in until we get to the next pivot...

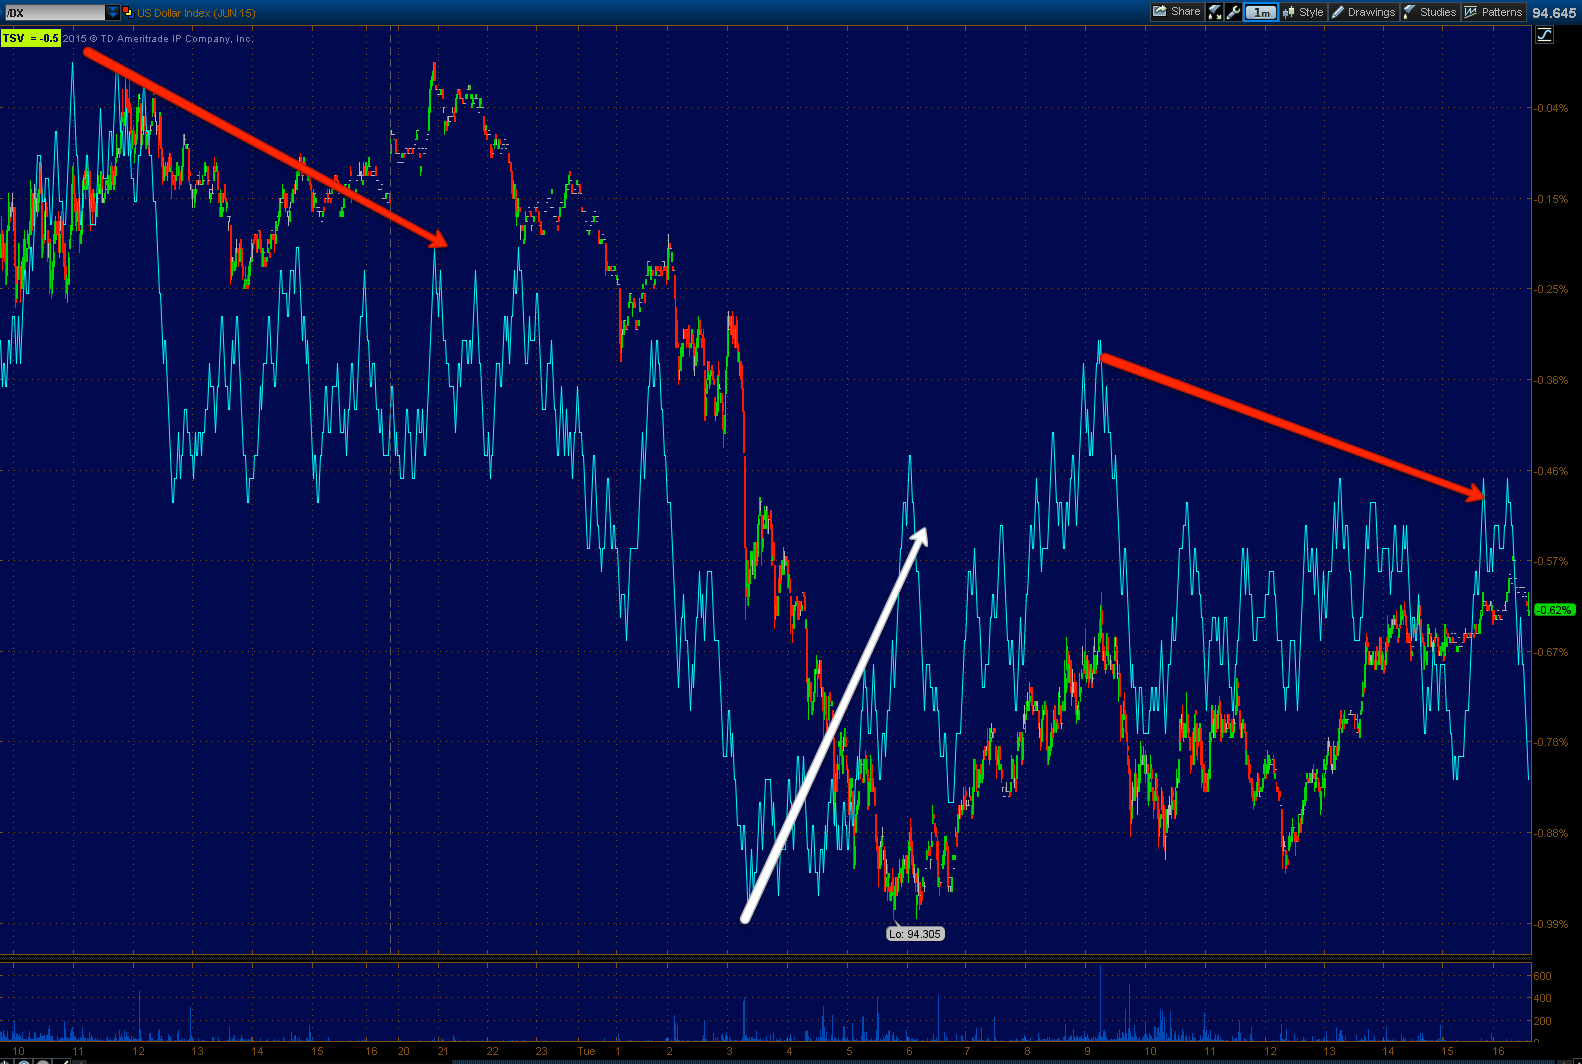
This 1 min chart of $USD is longer than the charts of the averages intraday, but what were we expecting today in the market, that being the reason I left the VXX calls open yesterday in to today (or as last night's internals told us)? We were expecting a move lower which is what the $USD did after putting in a negative divergence, then bounced off that this morning much like the market as we were looking for the early morning flameout/short term capitulation, Opening Action.... (from 10:15 this morning) and then we were looking for a pullback so the charts could right themselves as you can see this 1 min $USDX chart put in almost the exact divergence we were looking for in the major averages.

Take a look...
 QQQ 3 min intraday negative divergence as I was expecting and believe the market needs to straighten out the charts so they are strong enough to take a trading position and not lose sleep.

The same is true of Index futures...
Es/SPX E-mini futures 1 min intraday with the cash market highlighted in the white box today and the 1 min 3C negative divergence in effect in to the afternoon.

I could almost look at the 3C charts of the $USDX alone and have a pretty good idea of where the entries and exits are in most assets as they are so correlated, although I'd never do that because above all, the market is dynamic and things change. Being lazy never made anyone money.

However I thought I should point out just how important the $USD is and obviously this hasn't been news to us as the first paragraph of our Friday "Week Ahead Post" talked about it specifically...

"I'm still expecting a $USDX led bounce in the equity market as well as the bond market"

Quickly touching on a few assets, oil was expected to bounce today or as I posted yesterday (see above) bounce today for "A day or so". After the close the API inventories were released after last week's largest draw since 9/2014 at -3.88 mn bbl , tonight's consensus was for a much more modest draw of -250k bbl., but instead came in at a 2 mn bbl draw and a draw of 827k bbls at the Cushing storage facility. This sent crude futures knee jerking higher...

There's another Saudi increase in production and we have the DOE's EIA inventories tomorrow morning at 10 a.m. which could be a catalyst for what are turning in to negative divergence since this bounce higher was posted for very near term trade. Also remember the correlation (inverse) with the $USD as a dollar denominated asset. I'll be looking for a very specific put entry if anyone is interested in the trade, I'll post it if I see what looks like an excellent entry/position. In the meantime, the charts...

 CL/Brent Crude futures 1 min with a negative divergence in to tonight's API data.

 CL 3 min

CL 10 min which shares some similarities with USO's 10-15 min charts which have fallen off the map since the run above the base's resistance and we observed bearish churning.

The churning from last week and today on a daily USO chart...

While the 15 min chart just fell off a cliff (3C) as soon as that move was made above the base's resistance line, something I suggested may have to happen before a reversal several ays before it occurred.

 This is the near term USO 3 min intraday chart, also showing not only the short term accumulation for this move up, but a leading negative divergence developing near term like Crude futures.

And the 5 min chart with today's churning even intraday at the exact high of the day on significant volume with a leading negative divergence after.

As for Leading Indicators, I see two things and they are right in line with our forecast from the Week Ahead, the important part of the forecast are the highlighted areas and that's what I'm seeing in Leading Indicators...

"I'm still expecting a $USDX led bounce in the equity market as well as the bond market, certain stocks are going to be shorts before others, but this gives us a chance to open or add to any positions we may want to tweak a little.

As I have tried to make clear, it doesn't look like smart money is even participating in this move, thus my own participation level is so low at present having closed VXX puts today.

In comparison to what comes next, this bounce is nearly meaningless like Monday morning's forecast."


*All indicators are compared to the SPX/SPY in green. I may invert SPX prices from time to time so you can see what the normal correlation would be and any differences in relative performance, these will be noted as "SPX Inverted".*
 Our custom SPX:RUT Ratio shows what in the indicator's terms would be a decline with a small counter t rend bounce. While the market has managed to stay flat (see Friday's comments about the Dow's near 100 year old record of 38 consecutive days (now 40) in which it hasn't made a 1 month high or low in a VERY tight range that it should be able to easily accomplish.

The red arrow on the indicator is a leading negative signal, the recent white is in line with a counter trend bounce or the bounce in the "Week Ahead" forecast.

 Looking at the bigger picture with the same indicator, it gives 2 positive signals at 2 "W" bases and the market fails to break a range while the indicator leads lower to a new low currently. This gives you more of the feel of a decline with a corrective bounce to the far right in white.

This speaks to the big picture for the market as the internals and structure have been all but eviscerated.

 Intraday Pro Sentiment is lagging the SPX, suggesting we get that pullback I have been talking about most of the day,  that or the market completely falls apart here, which I doubt.

Our second Pro sentiment indicator used for confirmation shows the same as it failed to confirm the SPX today with notable weakness at the end of the day like the 3C charts.

HYG intraday tried to lend support to the market's bounce off intraday lows, however at the end of the day showed worse relative performance also suggesting a decline early tomorrow as we have been looking for so the near term charts can post a reliable divergence that we may be able to use to take a trade without unreasonable risk as things stand right now.

High Yield Corporate Credit,"Credit leads, stocks follow", (HYG) has been expected to continue to deteriorate as it has. A bounce in the SPX with continued deterioration in HYG would just make the leading negative signal that much worse.

  *SPX Inverted* This is VXX vx SPX, with SPX inverted, usually VXX would move in sync with the SPX, however at the end of the day there was some relative weakness in VXX . At the moment I have no opinion on this, but we'll see if it gets worse.

 TLT (20+ year bond fund) which has had a correlation with the SPX which is not normal, typically they'd be near mirror reflections of each other as rotation in and out of each causes that inverted effect. Instead it seems bonds have been leading the market lower with slightly earlier signals and I suspect we may see a bond /TLT long position (filling out the partial position) before any long equity/ETF positions intraday for a quick trade.

TLT v SPX on a larger scale with some hint of the normal correlation to the far left, but since it has just completely fallen apart. This however makes treasuries very interesting as a counter trend long on a short squeeze as we have been getting recent signals.

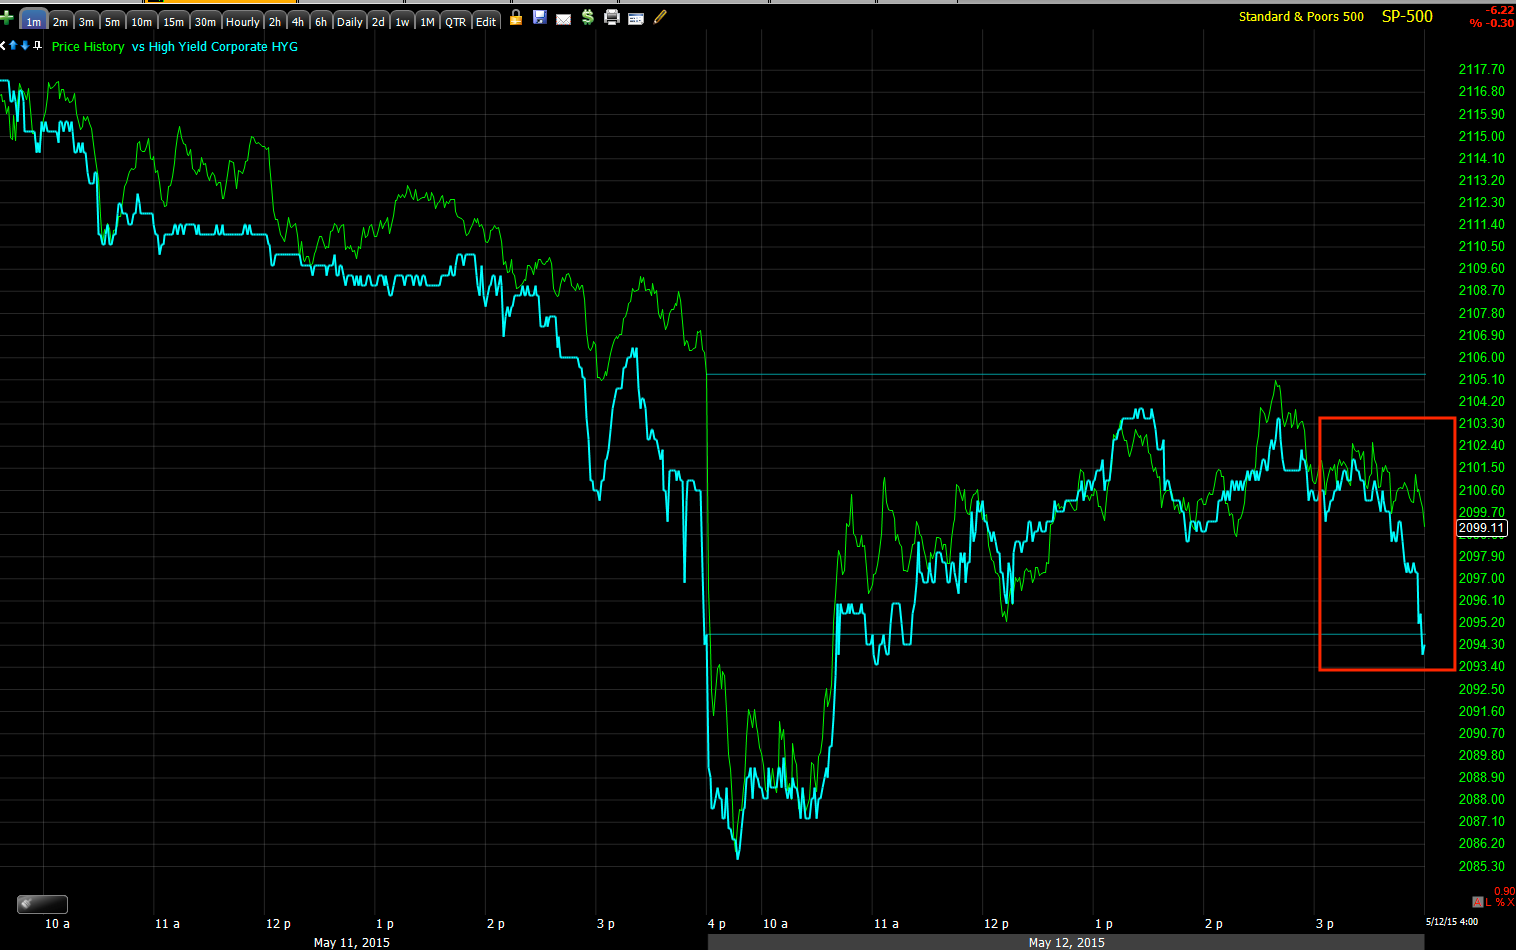
NYSE TICK Internals did not keep pace with the averages today, given the divergences and other indications, it makes perfect sense as far as our pullback in the averages to fill out the shorter term 1-5 min charts with divergences reasonable enough to trust a long trade.
SPY vs. TICK intraday, this is actually exactly what I'd hope to see.

Speaking of internals, yesterday's Dominant Price/Volume Relationship was right on. Tonight's Dominant Price/Volume Relationship is a bit scattered. Like yesterday the Russell 2000 has no dominant relationship, instead almost evenly split between the 4 possibilities. The Dow with 12 and the NDX with 40 are the closest thing to a Dominant relationship with both at Close Down/Volume Up which suggests a 1-day oversold condition or a near term bottom, although not overwhelmingly dominant. The SPX has about 200 in Close Down/Volume Down which is the same relationship as last night and essentially says the market will act in similar fashion as there are no internal forces that are moving strongly short term toward a directional pull. All in all, I'd say it's a net positive toward a bounce developing.

As for the 9 S&P Sectors, this was much closer to a near term 1-day oversold condition with only 1 of 9 sectors closing green...Energy at +0.46% with the laggard being Materials at -1.05%.

Interestingly of the 238 Morningstar groups I track, only 72 were green of the 238.

Both of these sector readings suggest a near term 1-day oversold condition from which the market typically closes green the next day.

As for Futures...

The near term 1 min $USDX looks like it will see some overnight weakness which would fit with the scenario that we were looking for to set up today for a reliable bounce that can be traded. Otherwise as seen above on the $USDX charts, we are seeing more positive near term divergences to go with that larger 30 min indicative of a counter trend bounce in the $USD's daily trend (down).

Gold looks like it will pullback a bit as we were looking for in today's trade set up, GLD / Gold Long Trade Set-Up

However, perhaps most interestingly as you can see my earlier capture of crude futures and you know I only expected a short term bounce, is this updated chart of 1 min Brent Crude futures just captured ....
Look at the leading negative divergence that has developed since the last capture taken earlier as I put this post together, Here's the earlier capture...
As you can see, there has been significant deterioration in line with our expectations of a short bounce of a day or so followed by a decline in crude. THIS IS BY FAR THE MOST INTERESTING FUTURES CHART THIS MOMENT.

As for Index futures, I have no reason to believe the scenario I was looking for to unfold today which actually started unfolding today, won't continue and this should give us some nice short term trade opportunities such as the double digit trades we have been hitting .
1 min ES/SPX futures distribution suggesting the small pullback we need for the charts to right themselves and take new trading positions at better entries, lower risk and the best timing we can get.

Everything looks according to our analysis.

In conclusion  when a carry trade fails, many things change including the legacy arbitrage correlation of the $USD which is the "normal" correlation whereby US dollar denominated assets like oil which are traded the world over in $USD's rise as the Dollar falls to make up for the lost buying power or oil /gold/commodities in general fall when the $USD gains as it has more buying power. 

The simple view of risk-on/risk-off rotation whereby bond selling=stock buying or stock selling = the flight to safety bond buying does not exist in a carry unwind world as there's no rotation from one asset to another as it is all repo/carry funded, not real cash. There are a great many signs that the carry trade unwind is on, but one of the first we saw was something I wrote about over 2 years ago that said (paraphrased) "When the markets are in decline, expect the Yen to be on the rise".

Now as I said, one of the first things we noticed before the $USD failed to make a higher high and made a lower low was some strange price and 3C action on the long term Yen Futures and $USDX, here are the charts which still look similar to when I first posted them, just much bigger now...
 The $USD gained on this daily chart despite QE3 as the carry trade was increased, from my information the approximate amount is $9 trillion $USD in $USD carry alone. The price trend should be enough to tell you something is going on, but this extremely strong 1 day chart/3C signal shows a huge leading negative divergence. $USDs have to be sold and the borrowed Yen returned.

Speaking of which...
 1-day Yen futures. Again, the price trend amidst an ongoing QE program (Japan's QE-Zilla) would not normally suggest any kind of strength and holding laterally in a base-like price pattern is strength, not to mention the daily 3C positive divergence, again, the Yen have to be returned(purchased) to finish unwinding the carry. 

These alone have been significant clues, but the falling bond prices with stock prices, the rising commodity prices, etc. are all hallmarks of the carry unwind. I suspect this is why we are seeing so much correlation.

Have a great night!


GLD / Gold Long Trade Set-Up

In the Daily Wrap, you'll see how this all fits together, but I suspect we get an entry for a long Gold/GLD trade within the next day or so, I suspect at the same time that bonds and the averages are ready to bounce.

I can't answer the longer term question I have suspected for some time at this point, "Is this a long term bottom for gold and is it about to make a new primary uptrend?"

For our immediate purposes, this question is not that important, but if you are looking at additional information and you think my hunch may be right (I only have a problem with it based on the $USD correlation for now, but that may change substantially in the near future), then if you like the trade idea, you might consider choosing an asset that would let you hold for a longer period of time in case this is that moment. In other words, you're not going to capture a primary trend with options. You may or may not be able to capture it with a leveraged ETF like UGLD as the pullbacks will cause more drawdown than something like GLD, that all depends on your risk tolerance and how much you like the trade. I'm just bringing up the issue for your consideration as we will not be specifically dealing with that aspect (long term trend) of GLD in this post, this is about a near term set up-perhaps tomorrow.

And again, I'll show you how this fits in to our ballet that is largely $USD based and likely because the carry trade is unwinding and is exerting more influence on the market and structural damage that will have a profound influence in the near future than most anyone realizes.

The WSJ (I believe or perhaps it was Bloomberg) said that a full 1/3rd of professional Wall Street traders had never seen a rate hike. The last rate hike was 2006, that means a lot of Pro and probably a majority of retail traders (if we consider the global market with the millions of new accounts opened in China every month -sometimes in a week, than we can say the clear majority of traders have never seen ...) A) a rate hike, B) a bear market, C) a Carry trade unwind or D) a "semi-normal" function market devoid of incessant central band tinkering and policy accommodation... This is NOT the norm.

That tells me the one thing I have believed for years is more true now than ever...THOSE WHO UNDERSTAND THE GAME AND ADAPT HAVE THE OPPORTUNITY OF NOT ONLY A LIFETIME, BUT LIKELY MULTIPLE GENERATIONS IN FRONT OF THEM. While the vast majority will be in territory they have never seen, most seem to not even be aware there's such a thing as a bear market. Finally, nearly all of these people say the same thing that has been said at every asset bubble since the Dutch Tulip Craze in 1637... 

"This time it's different" 

I've long been a student of the markets. In fact around 2007/2008, I put out a 5-part video series on market bubbles, which I can only find 2 parts of now. The phrase above was uttered in one form or another in all of these bubbles, that's what they all had in common...

The: Dutch Tulip Craze/Mania, The South Seas Company, The Railway Mania, the Missisippi Company, the Speculative building bubble in Florida in the 1920's (Jesse Livermore was involved), The Roaring 20's (led to the Great Depression), The Asian Financial Crisis, the Dot.Com bubble and numerous real estate bubbles worldwide just to name a few.

Gold was getting like that in 2011. A lot of you old timers may remember a certain hedge fund manager/investment letter writer who was a big gold bug who had asked my opinion of gold in 2011, after being nearly laughed off an email, I never heard from him again, but if you remember that then you'll remember this...

 This is gold during the QE era at #1. Note the near perfect adherence to the trend line and even more so to a 150 day simple moving average until #2 in which price "seemingly" bullishly pulled away from the trend line and the long term 150 ma for a move up on an increased rate of change in price, one of the earliest signals that a trend change is coming. This is a red flag that has me looking to get out of a position rather than celebrating as people often become extremely emotionally attached at that point and all kinds of cognitive biases take over once price turns down that cause them to lose a lot of money. In Dow Theory this phase is actually called the "Excess" phase

We called a top around the very high in 2011 in Gold and this hedge fund manager was a huge gold bug, I don't even know if he owned anything else so he didn't like what I had to say for sure. We forecasted in advance that gold would either enter a primary downtrend or an Intermediate downtrend from there. Just before entering a downtrend, note the head fake move above the obvious triangle at #3. As I often remind, head fake moves occur in every asset on every timeframe. In addition, large triangles like this or the ones we are just loitering around now are NOT consolidation/continuation triangles, they are most often tops or bottoms depending on the previous trend.

At #4 we started to notice some strange signs mixed in intermittently that looked like gold was forming a base to rally from, but they have been on and off several times , each over periods of months. At #5 we have what looks like a stop-run head fake move we'd expect to see just before a trend reversal to the upside. Again, I'm not covering the long term picture in gold right now as there's too many factors with the $USD that skew the interpretation of data.

 This is a daily 3C chart and positive divergence near the apex of the triangle and after a potential head fake move, thus there's still a very good chance that gold enters a primary uptrend,  however inflation data doesn't support that thesis right now as gold is typically bought in advance on expectations of inflation.

This is where our trade set up resides...
 The long term 60 min chart has a clear positive divergence especially since April where/when a lot of things happened/changed.

The 30 min chart is also leading positive.

As is the 10 min chart so at this point we have pretty strong multiple timeframe confirmation of something going on in gold that looks a lot like some deep pockets have been accumulating.

 More recently this 5 min chart is nearly vertical leading positive. I almost considered this a position now just because of this chart, but there are other elements that I'll address in the Daily Wrap.

Interestingly, gold has the same 3C intraday pullback signal that I hoped and expected to see in the market averages today and gold shares a correlation with them recently which you'll see in the Daily Wrap.

I looked at Gold futures as well and found much the same in confirmation...
 "YG" Gold Futures 60 min leading positive divergence like GLD.

 This is the 30 min gold futures leading positive like GLD.

And the 5 min, I didn't draw an arrow, but just compare price and the level of 3C at point "A" and "B".

Intraday on a 3 min chart, gold futures are pulling back like the market, this is our potential trade opportunity (long).

And while less liquid, the 1 min gold futures chart shows the same.

I'm looking for a pullback likely at least to fill the gap just below, but am setting price alerts at all 3 levels, $114, $113.50. $113 and $112 so I don't miss the opportunity.

We just need to see the short term intraday charts show accumulation on a pullback, if we can get that, GLD or whatever derivative asset you decide you like, will likely be a well timed swing+ move, maybe more as mentioned at the top of this post.