Monday, April 7, 2014

Market Update

So far, everything is going just about EXACTLY to plans or expectations. From last Friday after the max-pain pin was lifted (when we get our best signals), Looking Forward to Next Week ...

"...we have positive divergences this afternoon, the chances are VERY high that we'll have positive price activity early in the week (next)....I'm not sold on an immediate move Monday morning, the reversal process in the averages to me looks incomplete, a pop higher immediately would look a little premature so I wouldn't be surprised if there was a little more lateral/sideways work done in the major averages, but that's an opinion, the most important thing for near term trade is there are positive divergences.

Also remember that no matter how far they may have reached, like the IWM out to 10 mins intraday today, it's still only 1 day of positive signals meaning it's a small base/foot print and the best analogy I have is if you put 1 gallon of gas in your car, don't expect to be driving across the state.

As I said, I'm still leaning VERY clearly net short, I'm not worried about a bounce, but if you can hitch hike a little ride and make some extra cheese, why not. The VXX/VIX futures are still KEY to timing our downside pivot."

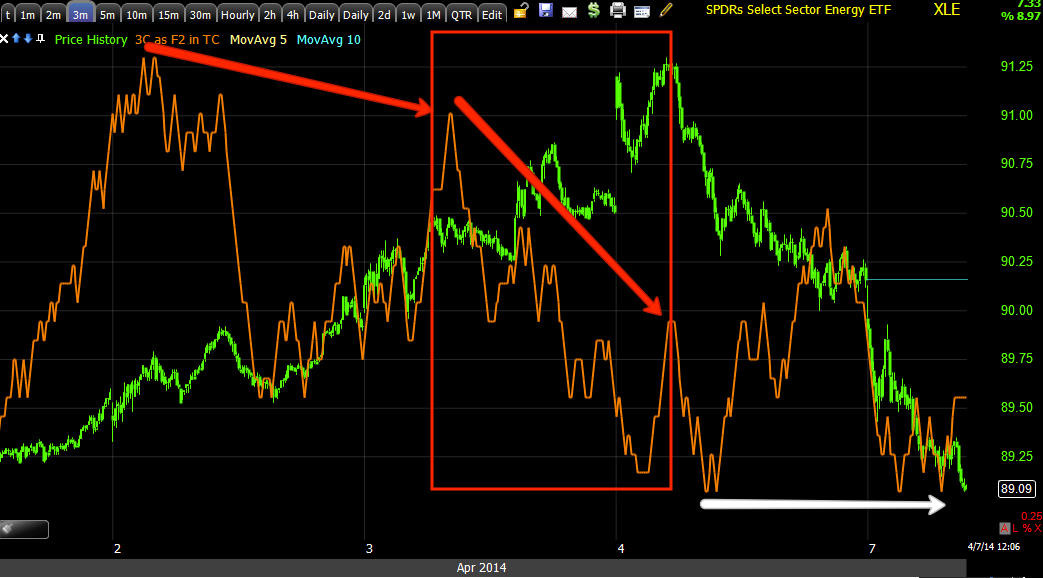
As for the charts, I didn't include the longer term (which I'm thinking should be around mid-week) negatives that a bounce sets up because I included those in previous posts already today, we're just looking at the immediate future for a short duration bounce and possibly a little stronger head fake move as the one from April 2-4 was very weak. 

I didn't notate most of the charts because the divergences are so clean and clear, this is a great time to learn divergence analysis if you haven't already and I don't want to crowd the charts, just remember we were looking for higher 3C signals in to either sideways or lower prices and we want to see some reversal process (sideways movement).

 DIA 1 min

DIA 2 min

DIA 3 min

DIA 5 min... The first thing that is obvious is the migration of the divegrence through multiple timeframes, each looks as it should so we have a solid divegrence, it's not huge, but it will move.

IWM 1 min

IWM 2 min

IWM 3 min

IWM 5 min

 SPY 1 min

SPY 3 min

The SPY 5 min was my least favorite Friday, it did not make it to the 5 min chart, thus the call positions that are open are in the IWM and the QQQ.

What you should notice now is that there's migration of the divergence in ALL of the averages, all 4 averages confirm each other.

The VXX (Short Term VIX Futures) "Should" have nearly the exact opposite 3C signals although there is a bias toward accumulation in VIX overall, however negative signals in VXX would confirm the averages above.

 VXX 1 min

VXX 2 min

VXX 3 min

As far as the flying, leading positive divergences we are looking for in VXX to signal a downside turning point in the market of some real importance, this 15 min chart is showing the collective accumulation in VXX, it needed to be sent lower again into the accumulation zone for the divergences to continue to build, but compare the 15 min VXX leading positive above and now check out the SPY's 15 min chart (it should be nearly the mirror opposite and this represents the larger move...
This is the SPY 15 min with the entire February cycle which started with accumulation on Jan 27th through Feb5/6 and then stage 3 distribution (top) and the leading negative tells us all we need to know, use price strength to short in to.

VXX reamins the timing indication, but they aren't going to chase prices north to accumulate a large position so this market move to me seems to be more about the VXX than a head fake move or bull trap, although they could kill two birds with one stone.

And we are off.

I checked GLD/GDX/NUGT and they are remarkably quiet today, very much in line so as far as I'm concerned, I have no reason to move those positions (UGLD/NUGT long) and they'll remain in place.

Just going to check leading indicators to see if there's anything of interest.

At this point you should already be set for the move so it's just about managing the positions, maybe some opportunities here or there, but the next task will be looking for the end of this move, I'm thinking around the F_E_D Minutes mid-week, and watching VXX for more signals like the 15 min, then moving in to whatever short positions you may still be interested in, although I think most of us have already made those preparations.


We Should be Launching Soon

I'll have charts up in just a couple of minutes, the VIX futures look right, the market averages look right.

QQQ Charts

This one is looking interesting as well, somewhat similar to the early stage 4 volatility shakeout we saw from the IWM last week (staging relative to the February 5/6th rally).

 Note the initial signal that I was looking for after 2 p.m. on Friday as the 3C signals almost always pick up where they left off the next trading day, even if it's a long 3-day weekend.

You can see the initial positive divegrence Friday afternoon starting around 1 p.m., but picking up in to the 2 pm hour through the close, this is what this entire post was about on Friday...Looking Forward to Next Week and these signals have been very accurate for us, calling the accumulation before the Feb. rally, the head fake move before the rally setting up more accumulation, calling the rally and stage 3/top as well as today's action almost if not, perfectly.


Here's the 2 min chart, the reason I suspected and wanted to see a lower low below Friday's afternoon lows is because it hits stops and triggers short orders, boith of which create supply that can be easily accumulated by institutional money, that gives us higher probabilities, better entries, less risk and a strong timing signal as head fake moves (scaled appropriately for the timeframe you are looking at or trading) are excellent timing markers as they occur just before a reversal in most cases.

 The 3 min chart continuing to build a larger positive divegrence, this is still small in the scheme of things and speculative. It doesn't matter if the reversal process is a "W" or a "U" shape, just as long as there's some lateral movement creating a reversal process as they tend to be a process, not an event.

Here we have a solid leading negative signal on a 5 min chart taking the Q's lower and a solid 5 min leading positive, this should take the QQQ calls higher.

We even have 10 min signals with a recent positive, so the Q's have a fairly strong (for the short duration of this micro stage)  signal and thus are attractive over several other assets.

You also have the benefit of liquidity in the leveraged ETF products like QLD or TQQQ if you prefer to stick with equities.

I need not remind you that any upside is speculative, it's just a hitch-hiking trade and the real probabilities remain with charts like this 4 hour which is clearly showing massive distribution and particularly so at the Feb rally's stage 3 area.

Going to Close Out the XLE Puts to Open QQQ Calls

Trade Ideas: BIDU & QQQ Long

These are still short duration, SPECULATIVE  trade ideas. BIDU looks pretty decent for a bounce, I think it needs some leverage, I'll try to get some charts up. I think most everything that has been beaten up lately is going to see some upside action, FB was another I was looking at.

However, if I had to pick just one (that's not already out), I really like the way the QQQ looks right now, I think it's very close to moving with excellent signals. I will get some charts for the Q's out.

I think you could go with something like QLD (2x long QQQ), TQQQ (3x long QQQ) ETFs or a call position in which case I prefer more time than I think I'll need, I'd probably prefer May expiration (standard monthly), although I think April standard calls would work fine as well...I prefer them slightly in the money.


Speculative Call Position Follow Ups

I may add some more, this isn't to overweight a portfolio on the long side, it's more for those who might want to participate, are okay with the speculative nature of the idea, but haven't had a chance to get involved yet, I'm still leaning heavily toward the bearish/short side and won't close any (likely won't unless there's a very good reason) because of a short term bounce.

What you should notice about most of these charts is that in the very short term they still look good for a trade (long), it's speculative and short duration so I prefer leverage, I think most are very close to moving.

However, the bigger trade here is to let price come to you and short price strength, you'll notice the longer charts are in horrible shape and as the bounce ends and the short term charts go negative we'll have a full house of negative charts from short term to intermediate and long Primary trend.

That's the real trade, letting the short come to you, but if you have the risk tolerance, the hitch-hiking trade with some leverage should work great and I think we are very close.

Trade Idea: NFLX Long   from Thursday April 3rd
 NFLX 2 min leading positive on the head fake / stop run move.

NFLX looks like it will get a decent bounce with 10 min positives like this one, but...

The stronger 60 min speaks for itself, this is why I think the real trade is shorting price strength and 3C weakness as the short term intraday charts start going negative on a bounce.

NFLX 4 hour... horrible...

TRADE IDEA: IWM CALL from Friday April 4th

 IWM 3 min

IWM also has a 10 min positive, it appears to be on this chart, 3C needed to lock the divergence in, it still hasn't locked it in so I'm not sure if this is lagging or a positive, I'm leaning toward a lag since it has had time since I captured and posted the chart and still it hasn't locked it in.

The 15 min chart speaks for itself, this is the entire Feb. cycle, remember I said the IWM is the first of the major averages to already hit stage 4?

And the 4 hour chart shows where the real primary trend probabilities are, this trade doesn't  need the leverage.

Trade Idea: AAPL Long from Friday April 4th
 AAPL I mentioned, the 2 min is doing exactly what was expected Friday afternoon as we got the typical clean post 2 pm signals.

We have a 3 min positive in to today as well

And a 5 min so for me this is worth a hitch hiking long, I prefer some leverage, but it is probably worthwhile without it.

And we don't have to go too far to see why AAPL is an asset I'd like to short any price strength whether a new position or an add to and I don't think you need any leverage for this trade, AAPL short on a bounce.

I'll have a couple more as well as a market update as we are getting close.

XLE PUT Follow Up

Friday March 28th we opened some XLE (Energy) April $90 puts, Opening XLE April (Standard monthly) $90 Put.

I was considering closing those out today as a short term bounce would likely send them lower, but I suspect we have enough time to make them profitable as the premium has dropped since earlier this morning.

Here are the charts for XLE, I will hold the position open for now.


 As for the very short term, that's the only reason I'd consider closing the position; we have a nice rounding process, what looks like a little head fake move, a positive divegrence, but this is all still just intraday charts like the broad market tone.

 There's not much migration to the 2 min chart at all, the averages look much better and they are still very speculative.

 The 3 min chart has a relative divergence which is the weakest form, but it's large enough for a bounce, I might consider adding to an XLE short/Put position on a bounce, however if I added to puts I'd want to extend the expiration in to May.

 This 5 min chart pretty much speaks for itself, as far as the bigger trade here...

Any bounce in XLE in my view should be used to short in to, this 15 min chart is one of the stronger timeframes for underlying trend action and this needs no notation on the chart, the leading negative divegrence at a new low is VERY clear.

I think the April monthly puts have enough time considering HOW BAD this chart looks.

Market Update & GS Follow Up

As far as closing the GS April put position, it's tied to our market expectations for early action this week first expressed Friday afternoon in Looking Forward to Next Week (as I look for the 3C signals the last 2 hours as they tend to pick up right where they left off on the next trading day, even over a weekend) and then again last night in The Week Ahead...

First the GS P/L and charts...


At a fill of $5.75 and a cost basis of $4.75 the GS April $165 Puts came in with a gain of +.21% 

Here's why I closed them, remember I (personally) always want to close them in to downside momentum and BEFORE the first hint of lateral consolidation, I can always re-open them. I'm not looking for a lotto ticket gain with options, I'm using the leverage because I think it's appropriate for the position, usually to make the profit potential more attractive in what is otherwise a good looking set of signals, but maybe not a trade with enough duration to be worth it as an equity long trade.

 You can see the 3C leading negative divegrence on the 1 min chart and this morning it moves to a relative positive.

Also look at the difference in the ROC of price, the Rate of Change increases dramatically which "seems" good, but this is often a sign that the trend is about to change and lateral/sideways is a trend and one that usually isn't good to the gains in option positions.

 GS 3 min going from negative to in line to a small leading positive divegrence, these are the 4 stages of a cycle, just on a much smaller trend basis.

 GS's  5 min chart shows the same so the divegrence is starting to gain some strength , thus it makes little sense to hold the puts and watch the premium/profits disappear.


As for the market, if you saw Friday's expectations which were summed up again last night (see the posts linked at the top of this post), then you know I'm looking for a short term speculative bounce, but only after a slightly wider base/foot print is established. I suspected a "W" type base would take shape early today and we'd likely see a head fake move below Friday's lows BEFORE we got that speculative bounce in which we opened several positions Friday, I'll look at more shortly.

 The 1 min IWM confirmed that line of thought as the divergence from Friday (positive) continued today on the open with a positive on the slight pullback.

The IWM also shows the volume indicative of a stop run, which is what I was looking for in the "W" bottom today, that creates supply that can be absorbed and typically happens shortly before a reversal and as such serves as a good timing or reversal indication.

 QQQ 2 min also confirming both the positive divegrence and ongoing widening of the small base as well as the lower low below Friday's low (head fake).

Here we see the same in the SPY, except it has not made that stop run I anticipate,  yet.

Note the leading positive 3C divegrence...

And out to 3 min as the divergence migrates to longer timeframes (building strength) we also have a positive this morning. The SPY head fake move below Friday's lows may serve as the timing signal we are looking for ,  but as mentioned Thursday and Friday as we started putting some speculative positions on, THESE ARE VERY SPECULATIVE,  BIN SOME CASES IF YOU HAVE A LOWER RISK TOLERANCE IT MAY BE BETTER JUST TO SHORT PRICE STRENGTH RATHER THAN TRY TO HITCH-HIKE ON THE WAY UP AS WELL.


Finally the Custom NYSE TICK Indicator shows the same thing, the same story unfolding...
Note my histogram of the SPY vs TICK is ascending as we start moving laterally in what I suspected would be a "W" type base, remember though it's still very small and very speculative.