Chinese PMI comes in at 47.7 on consensus of 49. A number below 50 represents contraction and this would happen to be the biggest contraction in 32 months. What started out as a knee jerk response to China's policy cut has turned in to confirmation of not only problems in housing, but their manufacturing base as well; certainly this is partly contagion from Europe, their biggest trading partner. Just about everything in the report was weak, New Orders, New Export Orders fell and inventories rose a lot.
Corning, a big player in the LCD TV market came out earlier today with a release that hinted that Black Friday was such a success because retailers and producers were selling at a loss, with inventories up so much in China, it's not hard to believe.
Also making the rounds tonight, Golman cut EU GDP forecasts from .1 to -.8 which equals recession. As a reminder, S&P ratings said that would be enough to downgrade France, praise to Egan Jones who downgraded France today, as usual they are ahead of their peers.
The Mid-East conflict also escalated late today with a Chinese professor with the National Defense University saying, "China will not hesitate to protect Iran with a 3rd World War".
I knew the situations from the EU to China to the Mid-East would escalate fast, but I never envisioned this.
ES is vacillating between a point and two points down.
However we have a new leading negative low in 3C.
The Context Model continues to leak lower.
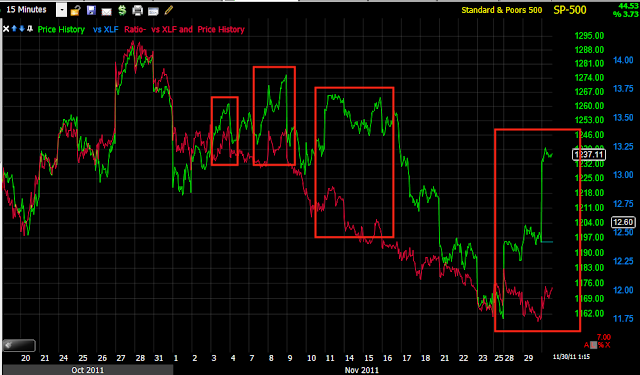
Here are a few interesting charts I picked out tonight.
First we have my Demark inspired indicator giving the first 60 min sell signal that we have seen in quite some time.

MoneyStream is a powerful indicator, it gives few signals, but when it does, they are solid. Here are the negative divergences in MoneyStream - above is the DIA
Here's the QQQ
The S&P-500
The SPY and I don't know where the chart disappeared to, but the entire NASDAQ Composite as well.
Here's a negative 5 min RSI on the ramp close, which I have a feeling is a bull trap, we'll see.
Even though 5 min is enough time, I gave it the benefit of the doubt and it was there on 1 min too.
Here is the real stunner though.
Volume Analysis is becoming a lost art form, but an important one. The rule is stocks need advancing volume for a healthy rally, but stocks can fall of their own weight, volume is never a prerequisite for a decline and a bear market hallmark is in fact low volume. The only caveat to that rule has been when F_E_D intervention by pumping billions of Primary Dealer dollars in the market, kept it afloat during QE periods, however that is over and recent events make QE3 more difficult to pull off, not to mention the F_E_D members are openly disagreeing with each other in same day speeches on the policy tool's effectiveness which other then the "wealth effect" of higher stocks, has been about ZERO, GDP has declined from its peak, unemployment is persistently stubborn, and just about any other metric you choose has shown it can do 2 things effectively, ramp the market and ramp inflation.
Here's a long term view of a healthy rally on increasing volume, note when volume dries up, the market pulls back or tops.
So along that theme, today I put up my cumulative volume indicator which simply adds yesterday's volume to today's and creates a cumulative line, I was using it to look at some price patterns to try to see if they were random or real when I stumbled on this. The S&P-500 over the last 3 days of rally has seen the LOWEST VOLUME in more then a year. That's right, out big price gain came on extraordinarily low volume, you can see the blue cumulator of volume at new lows as well as a 2-day average of volume in white.
In fact, it's the lowest since a minor top, similar to this week, way back in early 2009, the 2 day average of volume goes back to 2009 as well for lowest volume.
It wasn't just the s&P though, the NASDAQ 100, also lowest volume since 2009.
The entire NASDAQ Composite-every stock trading on the NASDAQ network!
And the Dow 30 has had a couple of lower days, both at tops.
So today? Sugar rush, knee jerk response or the start of a strong rally? You know where come down on the issue.
Here's a snapshot of US futures as of 11 p.m.
Pretty darn flat thus far
We'll see what the 3 a.m. EU open brings.


