Tuesday, July 19, 2011

Not Today, but...

This is a must read story. As the MENA region realigns itself politically and OPEC has started to crumble, the Iranians are busily creating one of those little cracks in the glass pane that may eventually spider out until there's a new world oil order and one that undermines the $USD, something Washington and the Fed have already been working round the clock toward.

Here's the story of how Iran might spark a revolution in oil trading as well as the dominance of the $USD.

BAC to bounce?

 Just so there's no confusion, I'm talking about a counter-trend bounce. This daly 3C chart should make clear that BAC is in some trouble for the foreseeable future.
 One hint s the heavy volume today and that BAC was able to move off its lows. Heavy volume often precedes an upside reversal.

 BAC 15 min 3C chart has shown some improvement over the last 2 days, but today's was far stronger, entering a leading  divergence.

The 5 min chart showed the same kind of underlying strength today.

Treasuries

I'm still baffled by the move in treasuries, here's why...
The accumulation period was very short and on a 5 min chart which is not that influential for this type of move. The accumulation period looks like it was from the open to around 11 a.m., then the move up started. This to me , has all the hallmarks of some information that Wall Street is privy to and we are not; otherwise, why is the accumulation period so abrupt, especially for the size of the move? Why did it show no signs of accumulation before this morning? Why such a hurry? If there's something bullish about treasuries and it's important, usually they'd accumulate a larger position. This almost seems as if they were buying in the wide open as prices rose. Volume was impressive compared to recent volume and that could also be a sign of Wall Street doing something t almost never does, buy/accumulate into higher prices.

VERY strange action.

Melt Up in Treasures...

I'm not sure what to make of this yet, but here it is...
 Treasuries largely have an inverse correlation with the market as seen here in TLT vs. SPY (red), but there are times they correlate in the white boxes, right now happens to be one of those times.

 Look at the melt-up in TLT today. I don't know what's behind it, but I suspect it has something to do with the information curve and we'll likely find out shortly.


 TLT 10 min confirmation

 TLT 5 min confirmation

 The SPY is going a bit negative on the 1 min chart, which is not to be unexpected with this kind of gain going into the close.

 The 5 min hart shows a little bigger problem as far as confirmation, but then again, this bounce wasn't expected to be strong like the short squeeze.

 Oddly the 10 min chart is in confirmation of the SPY.

 The 15 min chart is not.

The 30 min chart is.

We may be seeing some migration in to treasuries in advance of an expected drop in the market, or perhaps there's news about to break.

Either way, we're likely to see some profit taking here. The strength in XLF though has me thinking we are not done with this bounce.

USO Update

Remember the last USO update today, I said there's a possibility for a false breakdown before USO takes off, well that probability just increased.

 Here's the bullish bull flag, it's a well known pattern in a popular stock, a shakeout is certainly not out of the question and in fact has been a high probability in situations like this, that's why I mentioned it earlier before I had any proof of there being probabilities leaning toward that outcome.

 The hourly hart is strong and n a leading divergence, this is why I reman bullish for USO's intermediate term prospects.

 However, as pointed out earlier, accumulation is happening in the lower half of the flag and distribution keeps sending price lower when it approached the upper range, we see that once again today on the 30 min chart
 Here we see it on the 15 min chart as well.

 And the 10 min chart...

 And the 5 min chart....

I can't say for sure if this would simply be a pullback from resistance to gather some more support like we saw in yesterday's decline or whether this is moving toward a downside shakeout, if the downside shakeout occurs, I'm almost certainly a buyer, of course I'd check 3C for a head fake, but the way the market has been manipulating technical traders, this would not at all be uncommon, in fact just the opposite.

We'll continue to monitor USO as I feel there's a good long trade there, the entry is the question. Right now, a pullback in some fashion is very high probability.  You might even consider a quick trade in SCO for a day, maybe a few days.

Houston, we have lift-off

 As suspected, the 5 min 3C chart of technology is showing relative underlying weakness when compared to Financials.

 Here are financials on the 5 min 3C chart, note the difference in 3C's character between the two.

 As suspected, XLF cleared resistance.

 And take a look at the 15 min XLF chart, even in an uptrend, it's adding to the positive leading divergence on a 15 min chart! That's no easy feat.

XLK or technology intraday is fading as I suspected it would, Financials at the bottom in green are gaining so there's some sector rotation going on. If you are trading the bounce using leveraged ETFs, I would personally lighten up on the likes of TQQQ, add a bit to UPRO and FAS. All should still perform well so long as the market continues to bounce, but on a relative basis,  think the SPY will show better relative performance gong forward then the Q's and Financials will probably take over the mantle of leader of the bounce. Just to be clear, I'm talking about using these ETFs for the bounce only, I'm not making any long term or intermediate term indications, just short term as long as the bounce is alive.

FSIN Update (short trade)

I'm really happy to get emails from members that got in on great trades. The one thing many of them have in common is that they have a charting system and they set alerts for areas that I mention in updates. A member just went short FSIN.

From my last update on FSIN:

"I would keep an eye on the 50-bar m.a. on a 60 min chart, it may be the key to a reversal here."


And here's FSIN, one of my favorite shorts and if you didn't get in on the entry signal today, believe me, there's plenty of potential downside in FSIN, perhaps the $1 range.


 Here's the long term top, big trouble for this Chinese company, who knows, it may be the next Chinese reverse merger fraud to head toward $0. This has been one of my favorite short trades recently.

 Here's the daily chart of the FSIN break-down almost 10% today. I warned late last week that FSIN had stuck its neck out too far.

 And for those members who payed attention to the last update, the break of the 60-min 50 bar average was the cue to short FSIN.

The 15 min 3C chart of FSIN is clearly in distribution mode and headed for support, which would make for another nice entry or add-to. Conventional wisdom says you can't make more then 100% on a short, that is if t goes to zero, but conventional wisdom is WRONG. When you have a short position, the profits are added to your account without closing out the trade, unlike a long position where the profits are not available until you lose out the trade. This s a huge advantage of being short, not short via inverse ETFs that you buy, but a pure short position.


If you take those accumulated profits as the trade moves in your direction and you add to the trade with those profits, you can in theory and in real life, make more then 100% on a short. There's an article I wrote on www.Trade-Guild.net on the left side bar under "Resources and Concepts", the article is titled, "How to make more then 100% on a short", check it out when you have time. We have to use any edge provided to us and rather then throwing more money at losing trades, consider adding to your winners and cutting the losers.


One last note, if you're gong to trade, you should have a good trading platform that allows you to set alerts. This way when you read an update and I mention specific levels, you simply set a real time alert and you an be in the trade in less then a minute. Telechart has basic alerts for price crossing above/below a level, or news alerts and a few other alerts that can be sent to your email, pop up on your charts and a few other options. The update of Telehart, TC-200 which I love, but doesn't display 3C properly, goes even further, you can set trendline alerts, moving average alerts and many others. There's simply no way to keep track of all of this information so set an alert and let your trading software do t for you, like our member who just caught FSIN.


I have links to Wordn on my www.Trade-Guild.net site, I m an affiliate for them so if you decide to sign up, please let them know that Brandt from Trade-Guild.net sent you, it won't cost you a penny more and helps me keep costs down for all 4 of the charting software programs I run n realtime. TC-2000 also has a mobile application for Android mobile devices and I-Phone, its a free app when you subscribe to TC-2000 and allows you to take all of your indicators, chart templates, scans, watchlists and more and keep them with you right in your pocket. If you subscribe to real time, then you get real time charting capabilities as well. I'm a Worden affiliate because I've been a Worden subscriber for 11 years. Sorry for the pump, but I absolutely believe that a good charting system is essential to good trading.


DUST

Trading systems are not perfect, even the most famous of systems, the Turtle Traders had an entire year in which the system was at a loss, they stuck with the system when everyone else said it was no longer relevant and the Turtles proved them wrong. This is why I have a 3% stop-loss on the Miners system.

Despite the signals, I've posted at least 6 times on the bullish 3C nature of DUST and today we are seeing some dramatic improvements and some milestones crossed.
 Perhaps most important, DUST has broken out of the bullish descending wedge. $37.75 is my target for a strong breakout.

 You've seen these harts, but here again we see the recent underlying strength in DUST.

 The 10 min hart looks great

The 5 min chart is in line with price, or confirming the price trend. There may be an initial pullback as we often see after a breakout, if you are long NUGT, you may want to consider any pullback in DUST or strength in NUGT as an opportunity to exit the position.

Market Update

Sometimes by the time I'm done capturing and annotating charts, uploading them, and posting them, the market has already made a quick and decisive move. In the last post  was looking for a test of the day's highs and for financials to pick up the pace.
 The SPY successfully broke intraday resistance.

Financials picked up the pace at the white arrow, they are now stuck right at two resistance levels, thus the market has paused, we'll see if they can power through that resistance, I suspect t will happen, maybe not on the first attempt, but the 3C charts look strong enough to make t happen.

There goes GLD

This is more of what I was looking for and frankly, 'm surprised t took so long, but there's an obvious risk off trade in gold and risk on in equities.

 GLD breaking down

 Here's intraday support, note the limit orders triggered on a break of that support.

And here's the ascending triangle we saw, the idea was we'd see a false head fake breakout above such an obvious triangle, that ended up being the trigger. If you aren't trading GLD, just make sure you take note of how many times we see these false breakouts end a trend. As GLD moves below that ascending triangle, more and more traders will be at a loss, which has the potential of creating a snow ball effect sell-off.

Market Update

Earlier I was a bit concerned with the market's ability to bounce, we have 1 solid day in, but I was expecting more. I'm starting to wonder if the earlier 3C weakness was due to the market rotting sectors. As you know from yesterday, I said Technology is well in to rotation, it should start to decline and Financials which have been out of rotation perhaps are about ready to roll in to rotation.

Just take a look at AAPL's chart.
This was an exceptionally strong chart until today.

Looking at Tech vs Financials...
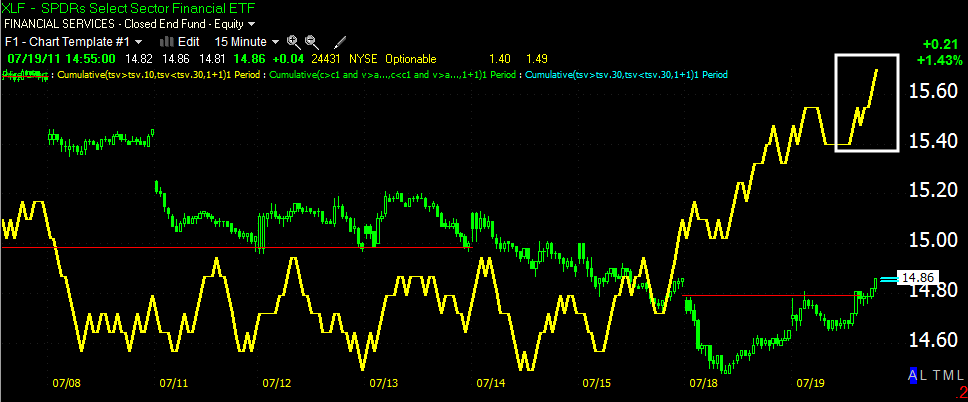
 Here's the 15 min XLF hart, note how strong the leading positive divergence is.

 Here's the same on a 5 min chart.

Meanwhile, XLK isn't doing much. It seems earlier we may have been caught in a transition from declining tech rotation to an improved Financial stance, but financials (although looking strong in 3C) haven't made their move yet, leaving a temporary void. If financials are going to take over, then we can expect some more upside on the bounce and the strength in the Q's today would likely be replaced by strength in the SPY tomorrow.

 At the top, technology is fading in the early afternoon, at the bottom, Financials are seemingly coming up from the depths of a sector that has been out of rotation. The 3C charts implied good strength in financials, but this isn't a 3C based sector analysis, it's based on price movement and until financials make their move, the sector won't show rotation.

 Here's some weakness in the QQQ

 And the 5 min chart shows more.

The SPY however looks like it will test the day's highs, if financials kick in before we hit that resistance level, the SPY may blow right through that resistance.

This is what I believe we were seeing earlier, some temporary weakness based on sector rotation happening virtually right now.

USO Update

Our last USO update there was a bear flag that I said would resolve to the downside, but not before technical traders are head-faked with an upside breakout, USO did that and headed lower yesterday. I still remain bullish on USO and view recent acton as plain old volatility with no special importance on the intermediate outlook for USO.

 Here's the bear flag I mentioned in red, the upside head fake in white and the downside resolution, which I thought would carry USO lower, until I recently took another look at the daly chart.

 It appears that a bull flag has formed on the daly chart, this would be bullish and fit well with my intermediate term bullish bias toward USO.

 Looking at the 15 min hart, note distribution toward the top of the flag's range and accumulation near the bottom.

 Again, distribution near the top of the flag and strong accumulation yesterday near the bottom of the flag, this looks like typical market maker, or rather in this case, specialist manipulation as they fill an order for an institutional client. The client has an average position target, when pries stray too far from that target, the specialist lets out some supply and works the bid/ask lower.

 Even today we see what appears to be accumulation near the lows of the day.

As a general rule, flags and other consolidation patterns typically see 5 points of contact with support/resistance before a breakout, if you look at the white arrows, we are at 5 points of contact. Being a popular technical formation, there's the chance of an HFT manipulation with a false break, probably to the downside, that's just a possibility to be aware of and if we see it, it may be an excellent place to start a long position.