The "Greek Deal Rumor" narrative...

The timing of the comments and the market reaction to the comments seem "odd" and unexpected.
In addition, to pull this move off today, there was a squeeze of the Most Shorted Index not once, but twice.

Today's 2 short squeezes of the Most Shorted stocks today (SPY). Note the second squeeze took place just after we closed the VXX puts, but had waited before entering any assets that would count on market downside as the charts simply were not confirming in enough timeframes to justify such a trade which worked out well considering the market action right after jump started by a second short squeeze.
In addition, the EUR/JPY carry was apparently latched on to by correlation algos during the cash market to get the move underway as well.

ES in Purple vs EUR/JPY in red/green candlesticks. Note the correlation didn't start until the cash open at 9:30.
The $USD/JPY would not have been the obvious choice because of the $USD's recent strength, but if you recall one of the reasons I suspected the $USD put in such a strong counter trend rally was to reduce the losses or cost to close out the carry trade (USD/JPY specifically).
After making a new counter trend rally high (remember the previous 7-days of counter trend rally in the $USD have been the strongest since 2008) in the $USD today, it started to weaken.

However before it did...


In fact, the USD/JPY after our recent monster, strongest 7-day rally since 2008 in the $USD counter trend rally, took the USD/JPY within 7 pips of its highs from 8 years ago.
In other words, if you follow the Greek narrative/rumor, there are quite a few inconsistencies.
However the second narrative is simply following the exact same narrative that was laid out for this week's action in last Friday's The Week Ahead... forecast...
"One of the things that seems to stand out the most is the Igloo/Chimney top and reversal process....We have the Igloo top in place, the last head fake move or Chimney looks like it will take place next week, beyond that everything starts turning very negative. My interpretation is that we will get a head fake move, this is where we should have good entries in assets we have been waiting on for signals like NFLX , perhaps transports, Financials almost for sure."
"It seems to me that soon after the $USD counter trend bounce may start to fail. While there are some positive Euro signals that would naturally come with a $USD decline"
"....this is the clearest signal I have seen that the carry trade unwind that the bouncing dollar has fascilliateated at smaller or no losses should being to unravel again and that makes sense as the head fake chimney move in the market/equities would be in the exact right place for the start of a $USD decline from the counter trend bounce and the selling of carry assets like stocks and bonds."
"Therefore I'm looking for the chimney on the igloo tops I showed in the last post, that's also the entries for numerous trades we have been patiently waiting for to set up. I think the switch from a head fake bounce in equities to a sharp decline will be a very fast one so I wouldn't expect the same lazy market we have sen this week."
The Igloo/Chimney concept has been a steady one, even today's move was expected to be a part of that which was posted in last night's "Daily Wrap". Even the concept of the head fake move which would require a strong market move seems to be in play.
The Euro strength signals were seen clearly today as it was the EUR/JPY that altos correlated to and today's intraday and daily chart weakness in the $USD is starting to become more obvious as seen above.
As for the Igloo Top ((with a head fake Chimney" shown in the previous post on Friday, here it is...
 "The 10 min SPY and this week's reversal process (yellow) with the "Igloo reversal process top" and a deepening 10 min leading negative divergence. I still would like to see 3C make a new leading negative low as I have drawn in on the 10 min chart in red."
This is the same rounding/reversal process or Igloo Top we see right before the final head fake move so often that we have named the price pattern "Igloo with a Chimney" as that's what it looks like.
In yesterday's Daily Wrap the "Igloo Top" and yesterday's price action was the very first thing I wrote about.
This is the QQQ chart I posted last night in the Daily Wrap with commentary below...
 "Look at the QQQ chart above this one from Friday and the normal rounding over , "Igloo top", today it was significantly deformed due to massive market weakness, not just on the day, but severe damage done."
And this chart followed as to what I'd be looking for next that dates back to Friday's Week Ahead, the "Chimney" head fake price action...
"Normally we would look for the head fake "Chimney" on the right side of the "Igloo" rounding top formation, in this case it would look something like this...
 Igloo and Chimney in yellow, the chimney being a head fake move that fails and leads to a fast downside move, but also gives us an opportunity to enter swing / trend shorts at better prices and lower risk."
Since we entered the VXX and TLT puts yesterday for a move up in the averages today, one description has been constant, "A strong move, an impressive move, but a short lived move" and that it be followed by a sharp move down once the Chimney/head fake was complete.
Today the first 2 conditions of that description were met leaving us with this new price pattern as of the close...
 This is today's QQQ 60 min chart, compare to yesterday's expectations posted in the Daily Wrap above. Note the shape of the chimney drawn in yellow where we had no price as of last night and note the trajectory of price at the green arrow. Is this not exactly what we forecasted Friday so far as well as the first thing written about in last night's Daily Wrap ?
It makes a lot more sense to me that to get this move on yesterday's very small base, the market would need help such as the two short squeezes intraday in the Most Shorted Index as well as the EUR/JPY carry correlation with the $USD making a new high that hits the USD/JPY carry trade stops at $124, allowing the carry to be closed at less of a loss or no loss at all, which is why I suspected we'd see a stronger than usual $USD counter trend bounce before it even began well over a week ago!
In addition, certain Leading Indicators are breaking down as we had expected to see and my watch list of stocks that I said last Friday I'd be looking to enter on the Chimney/head fake move are closer, but not quite there like the VXX position from yesterday was or the GLD position I suspect entered today, which was also part of the The Week Ahead forecast from Friday...
"It looks like Gold will move higher, but whether this is a temporary bounce as we initially saw before a wider pullback is now up in the air as gold now seems to be discounting inflation expectations which could continue sending it higher.
I haven't changed the forecast for crude, a pullback followed by a stronger move up."
You saw the GLD charts today...Trade Idea: Swing GLD Long And the Crude "Pullback" is expected to be a large pullback as covered last night in USO / Crude Update, toward the bottom of the range before reversing its primary trend in a trend trade higher.
As for Crude tonight on the API data...
 Not a great reaction to the inventories.
As for Leading Indicators...
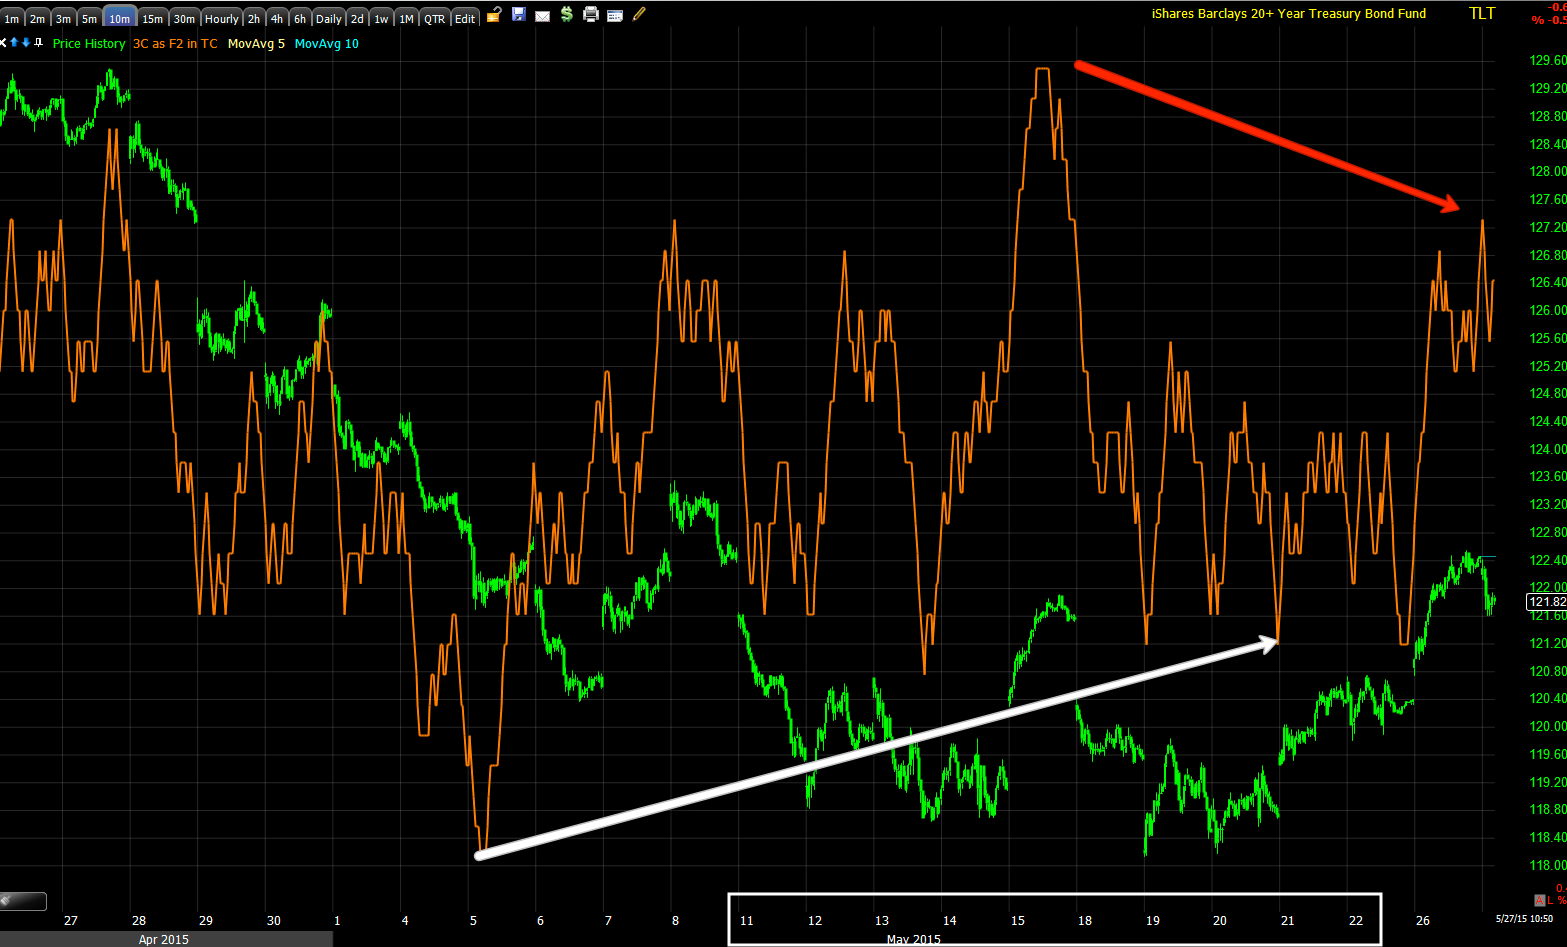
 30 year Yields in red vs the SPX had been moving together, but suddenly today there was a massive change between the two. I'm obviously hoping Yields climb back up with the TLT put, I suspect they may with the completion of a head fake move in the market. Remember though the larger trade idea in TLT/Treasuries has also been a counter trend rally, although it seems less and less necessary if the $USD counter trend rally ends which should lead to a renewed sell-off in treasuries.
Pro Sentiment "had" been in line for a while, but had recently been falling apart at a fairly steady pace, that all changed recently...
 Our Leading Indicator "Pro Sentiment" had been roughly in line through the earlier part of the year and started deteriorating at a predictable pace, then just fell out of the tree. These are the kinds of Leading Indicator divergences that I have been looking for.
As I often say, "The first lever they turn to in order to ramp a market is almost always HYG", today and yesterday were no different, the market needed the help of HYG to pull off this move that seems very well orchestrated if we could see it last week in advance...
 HYG (blue) in line with the SPX (green) intraday until last week and especially at Friday before yesterday's decline, but notice HYG in line again as it is used to help lift the market along with the EUR/JPY and two short squeezes intraday.
However, it's not the short term intraday divergence we are looking for as a Leading Indicator in High Yield Corp. Credit, it's the trend...
 HYG has also fallen out of a tree vs the SPX recently.
And it's not only High Yield Corporate Credit...
 It seems smart money has been very eager to get out of risk assets especially in to last Friday. High Yield Credit which is an institutional risk on asset has made new multi-month lows today.
"Credit leads, stocks follow"
As I said today, I wasn't ready to enter any shorts because it seemed the signals were not consistent enough and looking at the start of the head fake "Chimney" move, it makes sense why, but it also means we should be that much closer as the Igloo with a Chimney is the last thing we see before significant declines, just look at the September highs as they formed the exact same pattern before falling within days to move to the October lows last year.
At this point, it's a matter of watching the market, watching the watch lists and entering the positions as their charts fall in line which I suspect happens quickly as the Igloo was not allowed to finish before falling sharply yesterday, distorting the rounding top (right side) and an immediate move to the "Chimney" portion of the price pattern , but needing significant help to do it.
As for internals which were overwhelmingly 1-day oversold yesterday...From yesterday's Daily Wrap...
"Interestingly, adding to the probabilities of today's new positions entered and a near term / short term market bounce, Internals WERE EXTREME!
The Dominant Price/Volume Relationship was in all 4 averages with an amazing 72 NASDAQ 100 stocks, 27 Dow 30!!! There were 1058 Russell 2000 and an amazingly strong 368 SPX-500 stocks all in the same Dominant Price/Volume Relationship of 4 possibilities... Close Down/Volume Up which is the strongest 1-day oversold condition of the 4 possibilities usually leading to a next day move higher...
Furthermore internals were exceptionally strong with all 9 of 9 S&P sectors closing red with Utilities leading at -.63% and Energy lagging at -1.58%!!!
Of the 238 Morningstar groups I track, an amazingly overwhelming 231 of 238 groups closed RED, this is a VERY strong 1-day oversold condition and especially taken with the Dominant Price/Volume Relationship of the 4 major averages. This CLEARLY suggests a next day close in the green on a very strong 1-day oversold condition.
Tonight we have the almost polar opposite...
The Dominant Price/Volume Relationship saw 17 Dow stocks, 55 NASDAQ 100, 899 Russell 2000 and 271 SPX 500, a strong Dominant reading and all in Close Up / Volume Down, THE MOST BEARISH OF THE 4 POSSIBLE READINGS.
Also in a polar opposite to yesterday's internals, 8 of 9 S&P sectors closed green with Tech leading at +1.89% and Energy lagging at -0.18.
Even more so, of the 238 Morningstar groups I track, a full 222 of 238 closed green.
As much as yesterday's internals were at a 1-day oversold condition that as I said last night, "This CLEARLY suggests a next day close in the green on a very strong 1-day oversold condition.", today's internals are the strongest form of the EXACT opposite, typically seeing a next day close in the red. However whether we get an actual close in the red or not, this shows an overwhelmingly weak tone to the market, especially the Dominant Price/Volume Relationship which is the most bearish of the 4 possibilities!
Index Futures...So far they aren't giving up much, I suspect this is because as I mentioned earlier today, there's not enough chart confirmation to guard against the probability of a move in the area tomorrow or higher. However as it is still early, there are some initial signs that there's deterioration in all of the averages, it's minor right now and just started, it will be interesting to see what it looks like tomorrow morning or maybe later tonight.
 Russell 2000 Futures 3 min with yesterday's positive divergence, today's move higher off that divergence and the start of a lateral range the last hour or so with the start of a leading negative divergence.
Remember it is a holiday shortened week and the max-pain options expiration pin on Friday is usually right around Thursday's (tomorrow's) close. I suspect we may see some signals and signs before the end of the week, but I don't expect we'll see any major downside price moves until this Friday's op-ex max pain pin is over. However that's just opinion and the charts can move very quickly as we saw yesterday. Watching the charts right now is the key to this area of the price pattern and market.
The Igloo/Chimney concept has been a steady one, even today's move was expected to be a part of that which was posted in last night's "Daily Wrap". Even the concept of the head fake move which would require a strong market move seems to be in play.
The Euro strength signals were seen clearly today as it was the EUR/JPY that altos correlated to and today's intraday and daily chart weakness in the $USD is starting to become more obvious as seen above.
As for the Igloo Top ((with a head fake Chimney" shown in the previous post on Friday, here it is...

This is the same rounding/reversal process or Igloo Top we see right before the final head fake move so often that we have named the price pattern "Igloo with a Chimney" as that's what it looks like.
In yesterday's Daily Wrap the "Igloo Top" and yesterday's price action was the very first thing I wrote about.
This is the QQQ chart I posted last night in the Daily Wrap with commentary below...

And this chart followed as to what I'd be looking for next that dates back to Friday's Week Ahead, the "Chimney" head fake price action...
"Normally we would look for the head fake "Chimney" on the right side of the "Igloo" rounding top formation, in this case it would look something like this...

Since we entered the VXX and TLT puts yesterday for a move up in the averages today, one description has been constant, "A strong move, an impressive move, but a short lived move" and that it be followed by a sharp move down once the Chimney/head fake was complete.
Today the first 2 conditions of that description were met leaving us with this new price pattern as of the close...

It makes a lot more sense to me that to get this move on yesterday's very small base, the market would need help such as the two short squeezes intraday in the Most Shorted Index as well as the EUR/JPY carry correlation with the $USD making a new high that hits the USD/JPY carry trade stops at $124, allowing the carry to be closed at less of a loss or no loss at all, which is why I suspected we'd see a stronger than usual $USD counter trend bounce before it even began well over a week ago!
In addition, certain Leading Indicators are breaking down as we had expected to see and my watch list of stocks that I said last Friday I'd be looking to enter on the Chimney/head fake move are closer, but not quite there like the VXX position from yesterday was or the GLD position I suspect entered today, which was also part of the The Week Ahead forecast from Friday...
"It looks like Gold will move higher, but whether this is a temporary bounce as we initially saw before a wider pullback is now up in the air as gold now seems to be discounting inflation expectations which could continue sending it higher.
I haven't changed the forecast for crude, a pullback followed by a stronger move up."
You saw the GLD charts today...Trade Idea: Swing GLD Long And the Crude "Pullback" is expected to be a large pullback as covered last night in USO / Crude Update, toward the bottom of the range before reversing its primary trend in a trend trade higher.
As for Crude tonight on the API data...

As for Leading Indicators...

Pro Sentiment "had" been in line for a while, but had recently been falling apart at a fairly steady pace, that all changed recently...

As I often say, "The first lever they turn to in order to ramp a market is almost always HYG", today and yesterday were no different, the market needed the help of HYG to pull off this move that seems very well orchestrated if we could see it last week in advance...

However, it's not the short term intraday divergence we are looking for as a Leading Indicator in High Yield Corp. Credit, it's the trend...

And it's not only High Yield Corporate Credit...

"Credit leads, stocks follow"
As I said today, I wasn't ready to enter any shorts because it seemed the signals were not consistent enough and looking at the start of the head fake "Chimney" move, it makes sense why, but it also means we should be that much closer as the Igloo with a Chimney is the last thing we see before significant declines, just look at the September highs as they formed the exact same pattern before falling within days to move to the October lows last year.
At this point, it's a matter of watching the market, watching the watch lists and entering the positions as their charts fall in line which I suspect happens quickly as the Igloo was not allowed to finish before falling sharply yesterday, distorting the rounding top (right side) and an immediate move to the "Chimney" portion of the price pattern , but needing significant help to do it.
As for internals which were overwhelmingly 1-day oversold yesterday...From yesterday's Daily Wrap...
"Interestingly, adding to the probabilities of today's new positions entered and a near term / short term market bounce, Internals WERE EXTREME!
The Dominant Price/Volume Relationship was in all 4 averages with an amazing 72 NASDAQ 100 stocks, 27 Dow 30!!! There were 1058 Russell 2000 and an amazingly strong 368 SPX-500 stocks all in the same Dominant Price/Volume Relationship of 4 possibilities... Close Down/Volume Up which is the strongest 1-day oversold condition of the 4 possibilities usually leading to a next day move higher...
Furthermore internals were exceptionally strong with all 9 of 9 S&P sectors closing red with Utilities leading at -.63% and Energy lagging at -1.58%!!!
Of the 238 Morningstar groups I track, an amazingly overwhelming 231 of 238 groups closed RED, this is a VERY strong 1-day oversold condition and especially taken with the Dominant Price/Volume Relationship of the 4 major averages. This CLEARLY suggests a next day close in the green on a very strong 1-day oversold condition.
Tonight we have the almost polar opposite...
The Dominant Price/Volume Relationship saw 17 Dow stocks, 55 NASDAQ 100, 899 Russell 2000 and 271 SPX 500, a strong Dominant reading and all in Close Up / Volume Down, THE MOST BEARISH OF THE 4 POSSIBLE READINGS.
Also in a polar opposite to yesterday's internals, 8 of 9 S&P sectors closed green with Tech leading at +1.89% and Energy lagging at -0.18.
Even more so, of the 238 Morningstar groups I track, a full 222 of 238 closed green.
As much as yesterday's internals were at a 1-day oversold condition that as I said last night, "This CLEARLY suggests a next day close in the green on a very strong 1-day oversold condition.", today's internals are the strongest form of the EXACT opposite, typically seeing a next day close in the red. However whether we get an actual close in the red or not, this shows an overwhelmingly weak tone to the market, especially the Dominant Price/Volume Relationship which is the most bearish of the 4 possibilities!
Index Futures...So far they aren't giving up much, I suspect this is because as I mentioned earlier today, there's not enough chart confirmation to guard against the probability of a move in the area tomorrow or higher. However as it is still early, there are some initial signs that there's deterioration in all of the averages, it's minor right now and just started, it will be interesting to see what it looks like tomorrow morning or maybe later tonight.

Remember it is a holiday shortened week and the max-pain options expiration pin on Friday is usually right around Thursday's (tomorrow's) close. I suspect we may see some signals and signs before the end of the week, but I don't expect we'll see any major downside price moves until this Friday's op-ex max pain pin is over. However that's just opinion and the charts can move very quickly as we saw yesterday. Watching the charts right now is the key to this area of the price pattern and market.