Wednesday, August 3, 2011

GLD Update

Some interesting action near the close.
 Look at that price spike and how quickly the 1 min chart went negative on it.

The 15 min negative divergence is still there.

A Small Victory For Financials

I've been showing this FAZ chart today frequently.

 FAZ breaks support-Now has the potential of a false breakout f t can hold through the close.

Volume jumped on the break, we weren't the only ones watching this level.

SPY Through Another Hurdle

SPY breaks through the LN down channel 

Volume is picking up again.

TICK Data

 The TICK chart is starting to break out of the 1:30-ish downtrend, if it can keep the newly established trend, the market should be challenging its intraday highs.

The effect of the TICK data on the SPY

OMX Trade Idea (long)

OMX is looking interesting here with an ascending triangle.

There's a bit of risk with the stop being under $7.00, unless you choose an intraday level, you may want to consider the trade on a breakout from the triangle and set some price alerts.

Volume Surge

Volume is running very high, ZH published a piece earlier about the volume at 1 pm being 63% above the 30 day moving average and on track to make 1 year highs. Considering the averages are at the break even area, this implies significant churning today.

Some Short Covering?

 IWM break through yesterday's close on volume...

 QQQ break of resistance on good volume, the price action in the white box looks similar to short covering with few pullbacks of consequence.

 The same is true of the SPY

This is the accumulation of the lows that I mentioned in the last post-SPY

USO Update

As many of you probably remember, my expectation for USO after it failed to convingingly breakout, was for a pullback where it would be accumulated to take a second shot at resstance around $38.40-$38.50.

There are some initial signs USO is making a move.

 USO 5 min

 SCO-Ultrashort Crude 5 min

 UCO Ultralong Crude 5 min.

Financials Moving

 FAS-Financial Bull ETF

 FAZ Financial Bear ETF- closing in on the breakout level

XLF like many other averages, looks like the lows this morning were accumulated.

Update

Now seeing more improvement in the SPY, QQQ, DIA and especially the NASDAQ A/D line.

Also AAPL which has been able to hold the line in it's range is showing improvement along with GOOG, BIDU also showing improvement since 12 p.m.,  RIMM, MSFT, MCD, GE, AMZN showing some potential, C, IBM also showing some potential here, YHOO to name a few...


NASDAQ 100 A/D ratio

RIMM Update

As most of you know, I'm no fan of RIMM, however in the last update I thought we should be on the lookout for a Crazy Ivan, first to the downside, and then above the trading range. RIMM is an interesting stock today.

 RIMM trading range, I would like to look at RIMM as a short above the trading range. Note today's gain of nearly 5% and increasing volume. Also note the break of support, setting up a potential Crazy Ivan shakeout.

 RIMM 15 min, this is part of the reason I suspected a Crazy Ivan shakeout and a move above the trading range.

 RIMM 5 min 3C has called all of the moves up. It's now leading.

 The 1 min chart suggests a pullback

 This is one potential target, at which the risk on a long entry is pretty low with a stop below today's lows.

This is the second potential pullback area.

Ultimately I'd like to get good short positioning on RIMM above the trading range.

Market Update

If you caught last night's market wrap then you probably understand the thinking as far as today's action. I've compiled a bunch of charts and in the interest of expediency, they may not be in the order I'd prefer.

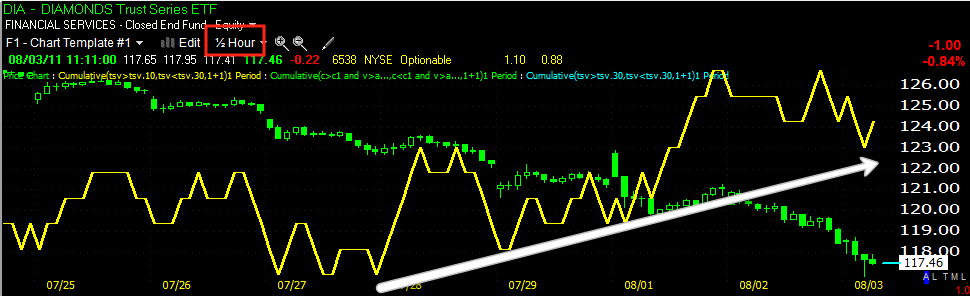
 This is the most important DIA chart of now, being it's positive on a 30 min timeframe, all of the shorter divergences that are seen more or less, if they are strong enough, filter in to the longer timeframes, 30 min is significant.

 The IWM this morning on the dip explained last night.

 Again the 30 min chart is the most significant, you can see where it turned the market down on the last (negative) divergence.

 QQQ is also positive on the 30 min, these charts were not this strong a few days ago.

 This s the NASDAQ 100 Advance/Decline ratio.

 SPY on a long term (55 period) TSV positive into this morning's break of the March low.

 Here's the March low, a signifiant level and one that probably drew in a lot of interest on the short side, this plays in to my thoughts from last night

 SPY 5 min remained positive this a.m.

 A break above the March lows will be signifiant, although I would expect some volatility in the region, it also may not be a bad place to enter long positions on a risk:reward basis, being you have several stop options close by. The red line os the widest of those stop options.

 The sectors are starting to fall inline, Financials, Staples, Industrials, Tech and even Discretionary. Basic Materials and Energy remain to be seen.

 The Tick chart washes out on the break of the March Lows and since has been pretty strong at +1000 readings.

 For Financials, FAZ is an ETF to watch as it made an important breakout, should the breakout fail, FAS will be looking pretty good from a risk:reward and probabilities perspective.

 This a.m.'s 3C on a new FAZ high, this is the breakout level at the red trendline.

 UUP 10 min looks like there's going to be more pressure on the dollar.

 FXE (EURO) looks like it will be putting that pressure on the dollar, despite Italy.

 FXF may not be useful as there was an intervention in the currency since yesterday

To the extent that it may still be useful, it's showing some negative signs.

UUP Follow Up

Yesterday I posted two updates on UUP (as a proxy for the Dollar Index being there's no real tme data for 3C on the actual Dollar Index). Both posts concluded UUP/$USD was preparing to decline.

Post 1

Post 2

Here's UUP this morning...
We'll see if the chart below takes UUP lower as it suggests.

30 min negative divergence, would suggest lower prices for UUP over the coming days.