Wednesday, August 28, 2013

Daily Wrap

Well so far this market is doing what we expect, there haven't been that many moves that are worth the risk of a trade, but a few like XOM that had set up a week or so ago popped, gold miners popped, I think silver is going to drop too.

It's really hard to tell what the market is actually doing other than the inverse H&S price pattern seen today that I doubt was coincidence.

Remember it was a couple of weeks ago (I think) that I said, "We aren't near the big picture, WE ARE IN THE BIG PICTURE" and as such, I like to have a large percentage of my short set ups ready and I have had them ready, a few were closed for bounces like XOM, but I think it has a bit more on the upside, Energy broadly speaking on the other hand looks troublesome as I just posted.

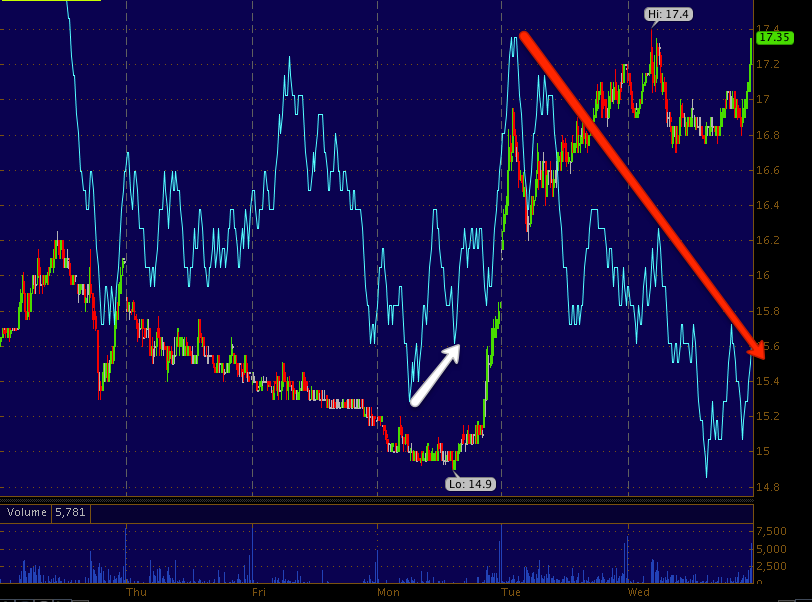
Here's a view of the big picture we are in.
The SPX and a channel, do you recall out behavior expectations for a channel? Usually a break above the channel (yellow arrow), then a quick move to the opposite end of the channel (first green arrow which also caught 100 day m.a.a support), then the "Kiss" of the channel "Good Bye"

The kiss use to be right at resistance or the bottom of the channel before everyone started using technical analysis, now traders still expect that and place stops just inside the channel so Wall St. almost always takes price back inside the channel to knock out those stops as you can see above.

Mow we have another pullback to 100-day support, this is hairy because a break here is a bad break. I'm guessing we head toward that little gap in yellow at the far right, perhaps lower at a gap around $1654, but I'm guessing it will be more extreme.

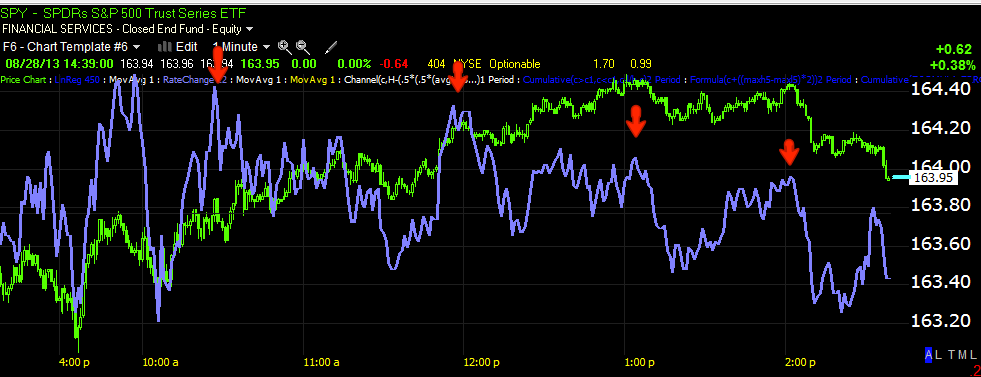
As far as assets and signals today, HYG and Junk credit both outperformed the SPX as did the skittish HY Credit, not only on a 2-day relative basis, but at the close as well.

 This is a larger view of HYG's negative divergence as a leading indicator pulling the market lower, THIS CHART SHOWS US WE ARE IN THE BIG PICTURE NOW.

Both JUNK and HYG have better 2-day relative performance vs SPX and both had a better close in the smaller white box and HY credit as mentioned moved higher again for the 3rd day.

Credit points to a bounce, not much more.

As for VIX futures, they hold a short term and longer term hey (both timeframes relative to the bounce expectation).

 VXX put in a clear positive the same day 1 min VIX futures did, we took the signal for a day trade and made double digits on it, but the "Blah" character of VXX now isn't screaming market move lower, it's more lazy like it could fall with a bounce higher, but likely see strong accumulation during such a move.

 15 min VXX is certainly not looking like the market is ready to break right here and now to the downside, in fact it's much more supportive of the bounce scenario.

It's the 5 min VIX Futures chart that really stands out, that small white positive divergence was HUGE when it occurred, it jumped off the chart and was an obvious long, now consider the size of the negative divergence suggesting VIX futures move lower, the market moves opposite the VIX.

ES 60 min also looks set for a bounce, although noisy still in many other places.
ES 60 min (SPX futures)

Our sentiment indicator HIO made more upside ground today suggesting pros are expecting a move higher, FCT which was in terrible shape is at least now in line and staying that way.

I see a number of trades setting up.they don't look quite there yet, Silver may be an exception and I already started a position there that is in the green from a day ago. This morning before the open both silver and gold were slammed down and then formed kind of a bear flag in futures. I guess I don't need to say it, but I still like the GDX short / DUST long, if I see a pullback that makes sense as a new entry, I'll alert you.

SLV...
 5 min SLV, note the similarity...

 10 min SLV

Ultimately 60 min SLV, I like the open position, but if it sets up again I'll let you know again.

You saw MCP earlier which is close, also UNG which is on track, but not at an entry point.

I didn't want to take chances with speculative positions like the $85 Sept. XOM call so I took half off the table for nearly a 40% gain, however if it opens up a new entry, I'd add it right back.

 The 15 min chart looks like there's a lot more in the tank, but...

The 5 min is looking a little shaky not to take some gains, if it pulls back and the 15 stays strong, it will likely be a new call or long entry for a bounce. I want to get back short XOM as soon as the signals are there.

I think transports are going to set up for a long play, these can be played with options or just long IYT as they are quite volatile,

 2 min

3 min

15 min NOTE today did what we wanted it to, to carry over and continue yesterday's starting 3C strength.

even 60 min? Well maybe because the 16th nis the date accumulation started showing up.

I wouldn't jump in right this second, but it may set up tomorrow or really any time as these divergences are moving so fast since yesterday afternoon.

FSLR is another potential add to/ new position
 5 min, we were looking for additional strength today

10 min

60 min

If today was about solidifying some of the divergences that took hold yesterday after the dump down, today was about continuing that task. Tomorrow would be about getting all of the short term ducks in a row and setting up entries.

There was one thing I noticed early and was happy to see it, stocks here and there are one thing, but the Tech sector is another and I saw strength earlier today, I just checked again and it looks even better, so an entire sector and an important one at that.
 XLK 2 min leading

3 min migrating

10 min leading


And the important 15 min starting to lead today.

This doesn't mean I like AAPL here, in fact I don't but we'll keep an eye on it.

Basically for me most of this right now is about position maintenance like  closing out some of the XOM and locking in the gain, otherwise it's about being patient because not much is happening that I'd want to be real exposed to short term until all the ducks are in a row. As I said above, if today was about seeing a carry through of yesteray's positives, tomorrow will be about either making those stronger and/or getting the timeframes in order to make for high probability positions with low risk.

I'm not going to put out sub-standard trades, especially speculative ones. Like a good wolf-pack, a lot of the hunt is just lying in wait.


ERY / XLE Charts

I don't know what it is about energy because I like XOM and closed out half the Sept. $85 call today hoping I can re-open it at a better price, the P/L broke down like this on only 1/2 the position closed.


I closed 10 of the 20 contracts at $4 with a cost basis of $2.88 so that leaves a nearly a +39% gain.

As for ERY, I wasn't sold alone on ERY, it took XLE as well.

 ERY 2 m, that's an interesting, tight "U" turn

ERY 3 m

ERY 10 m

ERY 30m


XLE-Energy Sector
 XLE 1 min has a clear divergence and an interesting, large rounding top.

XLE 3 min is leading negative something fierce.

 As is XLE 5 min, something is going on here.

Looking at the hourly chart, this is a pattern I look for and see a lot in tops that are just about to take a dive, I call it an "Igloo". It kind of looks like the rounded roof of an Igloo with a little chimney on the side (Head fake moves often) and with this leading negative 60 min chart, those 1-5 min charts look even worse, I thought ERY with its 3x leverage was a good way to play it.

Opening Half Size Equity Long ERY

This is 3x bear Energy

SLV / Silver Still looks good for a downside move

Market Update : Tough Call

OK, so here's what I see thus far and leading toward tomorrow, first of all, all of the averages are solid, they could be in better position, but they are solid right now if they did want to run.

However, short term VIX futures, VXX/UVXY just don't look panicked enough that there's going to be an imminent market breakout right here.

The theme...
 SPY 5 min is not leading, it's not even confirming yet.

SPY 3 min is still suggesting pullback even in to that little pop.

It has formed an inverse H&S, I don't think this is coincidence, but I'm not sure how they intend to use it, it's some manipulation because it's such a common bottom pattern,

DIA 3 min not confirming.

DIA 5 min not confirming

QQQ 10 min looks great, but moving higher in to higher prices is usually lag from earlier accumulation, it would look even better if price pulled back and the divergence stayed right there or better, moved higher.

I stiil think there's another trick up their sleeve, I do have enough short term call/long exposure to make it worthwhile in case, but there are so many that could be added if they just moved a little bit more.

DUST Management

I'm trying to decide what to do with this parabolic move up in DUST adding nearly another 9% today to  a +23% nearly full size position.

I looked at this first chart and the second and decided to stay with the second and hold DUST, if it were profits in options I would probably have taken them as there are different dynamics in play.
 1 min in line

15 min with a huge leading positive, much more on the upside IMO.

Closing Half of XOM $85 Call Position

Indicators

We have the intraday reversal that I've been looking for today, I just wanted to show you a couple of ways you could have predicted this as well without 3C and without the same indicators that everyone else is looking at, if you want an edge in the market you have to see what the crowd missed.

Granted, RSI is a fantastic indicator for this task, but if I'm using conventional indicators, I want confirmation from multiples and in an unconventional way, then I'll show you a simple custom indicator that can be used effectively.

3C showed me pretty clearly an in a number of assets, this is one I just grabbed because I thought I'd stay with the SPY theme, but other averages warned earlier. A positive to the left as hoped for yesterday and a negative intraday to the right as expected today.


My Oscillator Screen is conventional, but in an unconventional way. I use momentum on price, RSI 6 below that which is half the normal RSI setting, then MACD 26/52/9 which is twice as long as the conventional setting and then Stochastics period 50 which is about 4 times the conventional setting.

The trick is to use these in multiple timeframes and you can really start to pinpoint what is a move, what is important, what is part of something else, like this move down appears to be part of an overall bullish move to come so having that perspective gives you a lot different perspective as to how you want to use price movement.

 Of course the NYSE TICK vs the SPY in white and the channel, it's effective, but few know of it or use it.


I created my own custom TICK using NYSE TICK data vs the SPX with linear regression.

 How about this, the long lost and forgotten Rate of Change,  which is an indicator that enhances nearly any indicator you apply it to. In this case I couldn't apply it directly to price, although it does a good job of showing the divergence so I added a 1 bar moving average which is no smoothing at all and added the ROC to the 1 m.a. and made the m.a. invisible.

How about this, a 50-bar moving average on a 5 min chart, then below a custom indicator in blue which is simple (Close-Average Close 50  + Close 1 bar ago minus average bar 50 1 bar ago) and then I applied a 22 bar moving average to the plot, it gives a great reversal signal at the crossover.

This is simply taking advantage of the change in character of price vs its moving average, CHANGES IN CHARACTER PRECEDE CHANGES IN TRENDS.

Any way, I hope this helps get the creative juices flowing, you never know what you'll come up with.

MCP Update

I'm going through some watchlists of stocks that look interesting on a double bottom "W" type bottom which seems likely from today's action.

I see the last time I updated MCP Sept $6 Calls was Aug. 23rd

Ironically the first paragraph of that post said,

"The MCP September $6 call is in the green and so long as we don't form a double bottom (which I think would be too large of a base/too large of a bounce), MCP has a beautiful bottom in place and divergences that show it did pick up strength (like XOM) around the 15th/16th of late last week when bounce signals first started coming in, but the strength of MCP signals show it is clearly a stock that can stand on its own two feet rather than just drafting the market."

Wouldn't you know it!

So MCP is finally starting to look alive on the second half of what appears to be some form of a double bottom base, it's really not an ideal description. There's still some work to do, but that is the point of pulling back in to a second bottom or the lower end of the range, that's where the accumulation happens and I think if we stay on this course, MCP will be a decent looking long for a stronger bounce than expected on the 21st or as an add-to position.

 2 min, even here if you look at volume there's a head fake, new breakout high just before the reversal on a 2 min chart, the concept is found on all timeframes. More importantly for MCP, this chart is showing a solid divergence here where it wasn't before, that's why it has been so long since the last update, there was nothing worth mentioning.

 This is the original base started 8/16 and the 21st we saw upside since that last update, "as long as we weren't headed toward a double bottom", which of course is a much larger base and more capable of sustaining a larger upside move.

The point, we have good signals migrating to longer timeframes here too.

Looking at the bigger picture of what is likely all 1 base, the 15 min chart is leading positive as we move toward a double bottom which means, if a few more timeframes are filled out in MCP, it becomes a very high probability, low risk position.