Wednesday, October 23, 2013

Daily Wrap

Last night it was pretty clear between the signals, the candlesticks, the Dominant Price/Volume Relationship, etc. that today we'd close lower.

All day I've had the feeling that tomorrow we'll see some upside or some kind of trade that is the equivalent of noise, it's the kind of trade that has a purpose and that's usually knocking traders out of positions or sowing confusion and in those situations you are generally best off looking at the trend and going with the trend. In our case we are looking at the underlying trade or 3C trend and it's pretty darn clear so in my opinion, tomorrow can be useful for tactical set ups/trade entries.

Today there was no Dominant Price/Volume relationship, there were a whole bunch of intraday divergences that never grew any more powerful than that, there were a whole bunch of bullish looking candlesticks, mostly like hammers, but this is not the place for a real hammer and the volume doesn't do anything to make it more reliable, but it would fit perfectly with what I would call somewhat meaningless trade, it will or should scare people out of trades and in that sense it can provide an opportunity to set up new positions, maybe a new XLF Put or something along those lines, it really depends on how it develops and how long it looks to last. From the reversal process and the size of the footprint, there's time for a day of fooling around.


Here are some charts, in many ways where it's really important the market saw more deterioration today, where it's not so important, but still capable of moving the market (short term), there were signals that fit the bill, but again nothing that causes me any concern as to close the leveraged equity/ETF shorts, just the option position.

My guess, although I haven't had a chance to study the currencies, is that a SPY Arbitrage is likely to be employed based on HYG/VXX and TLT's potential for a downturn / pullback tomorrow (the signals are there for it).

For instance...
 This is the SPX (green) with price inverted, today's the first day since last week that short term VIX futures slightly underperformed their correlation, VXX would need to move down to activate the SPY arbitrage and create short term bullish manipulation (typically it lasts a day, sometimes less).

VXX also saw 1 min intraday negative 3C divegrence which is why it underperformed above and a slight positive to bring it back to in line, I suspect they didn't want to move it before tomorrow.

This is SPX normal and HYG credit overlaid, it outperformed the correlation today and HYG needs to move up to activate the SPY arbitrage.

However even intraday HYG saw some distribution in to higher prices in its 3-day range.

This chart backed out to scale is leading deeply negative, but that's not the point of the post.

The SPY negative intraday yesterday and in line today, but it never built any stronger to say a leading positive divegrence which would still be weak on a 2 min timeframe, but at least it would show there's a strong chance of a traceable 1-day move, this was kind of apathetic.

Now for what happened on the longer, more important charts today, VXX added to its leading positive divegrence on this 30 min chart which is a very significant timeframe.

Typically accumulation like this takes place in to flat or lower prices so today was perfect for this move on this chart.

HYG was negative on the 1 and 5 min last Friday, then it moved to the 10 min and signs on the 15 and 30 min, today's 10 min stayed leading negative.

 And of course the important chart for the SPY, even here on a 5 min chart where the positive divegrence at the lows is clear, we have a new leading negative divegrence below the lowest 3C low on the chart with price just off the highs making it the largest divergence on the chart, or the largest move in underlying trade.

 Commodities continued to lead the market lower as a leading indicator, they aren't needed for any manipulation or arbitrage so this isn't surprising.

 A larger view of the leading positive at SPX lows and leading negative at highs, you can see how the accumulation/distribution cycle works with leading indicators.

The short term sentiment indicator points to higher pricees (than today) tomorrow, although as shown in the massive chart post the other night, the longer view of this indicator is significantly below the SPX and negative.

Yields also dropped to a new low tooday.

Here's the leading positive at the SPX lows and the even deeper leading negative at the highs, I drew in (yellow) what price might look like, although typically to get movement they need something to create it like a new high which is just a bit above so that wouldn't be surprising and likely would set up some more nice Put trades like XLF today at 20+% for a day.

I'll check futures later tonight, I wouldn't be surprised to see the Nikkei (which is similar to the Dow in terms of points/value) bounce a bit after last night's -2% drop. To me it looks like the yen will bull flag and that should allow the Nikkei a little room, if it continues until tomorrow morning it would help the US markets too.

Still, nothing that's worrying, just opportunities as far as I can tell.

Ultimately I think the most important analysis is that of Friday's and what has happened since.

Market Analysis Part 2, October 18th

Hopefully if you don't remember the feeling from October 18th which went from very dull, just waiting for 2 p.m. to roll around to see some action in the indicators to increasingly strange, small signals that were indicating something was going on suddenly were large signals and extremely quickly.

It seemed like it was the Credit and Bond markets (the better informed markets) that saw this action first and equity markets (what most professional traders would consider to be the least informed market) definitely saw it last.

One of the last updates of the day started like this,

"The Impression I get is that something is being discounted rapidly, something the market is not going to like. Protection is being sough, risk is being sold."

Markets that were effected or at least that we were tracking were VIX futures, Credit, the currency markets and especially carry trades with the EUR/JPY in particular, Yields, other leading indicators and then the equity averages and major Industry groups like Tech and Financials.


You might recall that I checked in with an old trading buddy when I did nothing but trade full-time, he also works for a large investment bank which means I can't say much more about it as they really have strict rules about working for them and placing any personal trades. I asked, "Did you notice anything strange about the market (Friday)?" His answer was words to the effect that If his shorts were not dragging his portfolio in to the red, he'd say we had hit a top Friday. This is not what I wanted to hear or maybe it was, he is a brilliant trader, but uses a completely different system so he doesn't have access to 3C. For me the point was, if this guy didn't notice it, then I doubt more than half of 1% of all retail traders noticed it, but it was a big deal.


The bottom line, something seemed to have leaked out in what I called a Wall Street whisper (based on the earnings "Whisper Number" which is Wall St/'s view, not consensus). Further more it seemed like it was something Wall Street was not going to like and protection was being sought.


Just over the weekend tensions between Japan and China have heated up again over Japan's PM, Abe okaying a plan to shoot down foreign drones over Japanese territory if they refuse to leave after a warning, this after a Chinese drone recently flew along Japan's airspace. The dispute over the Senkaku/Diaoyu  Islands between the two countries since Japan purchased them in 2012 has almost always heated up as a proxy over economic activity, namely Japanese hot money flows causing inflation in China as a result of the gargantuan Japanese version of QE which aimed to double their monetary base within two years. All of these newly created yen are looking for a higher yielding home and most often they have found it in China's real estate market, when this happens, China typically rattles the sabers over the island chain, it's almost as reliable as a clock.

Other "Hot money flows" in to China's real estate market come courtesy of the F_E_D's QE of $85 billion $USD a month. In fact for the month of September, China bought $126 billion Yuan in $USD's to try to sop up some of the excess money floating in their economy.

China's Housing Market is heating or overheating again due largely to hot money flows, the last two days have seen two different reports, 1 report shows that 69 of 70 Chinese cities posted y/o/y price gains and a second report shows Shanghai real estate gained +12% in a SINGLE WEEK!

Last night the Chinese Shanghai Composite closed down -1.25% and the Nikkei closed down 2%, I believe the reason why has its roots in what we saw Friday October 18th.

Overnight Bloomberg released this report...

"China’s biggest banks tripled the amount of bad loans written off in the first half, cleaning up their books ahead of what may be a fresh wave of defaults."

Essentially the biggest banks and one of the most profitable in the world have upped the pace of writing off non-performming loans as fears mount that a fresh wave of defaults is ready to hit the banks.

However what we may have seen Friday, while connected to the above issue is something a bit more unique. Remember Dan Loeb's Third Point just coming out and saying they'd return 10% of client's capital and they've dramatically lowered their exposure to equities amid growing concerns over the "Global" economy". I have a feeling "Global" might indeed specifically mean China who has already been seeing a huge drop in growth which we first identified in 2011 as commodity prices went south, only a few months later and we saw the first contractionary Chinese manufacturing PMIs.

As to what we witnessed Friday...

China's PBoC (People's Bank of China, their Central Bank" injects capital in to the system through open market operations / Reverse Repos by partially off-stting maturing bills.

These operations are held Tuesday and Thursday of each week. The PBoC injected $10 billion Yuan of 7-day reverse repo contracts on Tuesday October 15th and then on Thursday October 17th, the PBoC withheld their 14-day reverse repo on Thursday October 17th (for the first time since last July), this in effect DRAINED $44.5 Billion Yuan from the market last week according to Reuter's calculations.  

The $126 Billion yuan purchase of $USD's in September was an increase of $99 billion over August. 

China's debt is now at record levels, but the problem is it needs to create more credit growth to generate the same amount or even smaller amounts of GDP growth...


"The nation’s debt-to-GDP ratio, excluding central government and financial debt, widened to 207 percent as credit growth continued to outpace productivity gains, Mike Werner, an analyst at Sanford C. Bernstein & Co. in Hong Kong, wrote in an Oct. 21 note to clients. That’s making investors nervous about bad loans rising at banks, he said."


Then comes last night's Bloomberg story of the largest Chinese banks writing off non-performing loans at three times the normal pace, they are seemingly bracing for a massive default on numerous loans as the real estate market once again is way over heated, +12% gain in Shanghai property is a single week!

Overnight funding rates went through the roof last night with 1-day repos up 67 basis points to 3.7561% and the 7-day repo up 42 basis points to 4.0000%.

Essentially what the market realized Thursday (when the 14-day repos were withheld) and appeared to act on Friday was the fact that between sopping up $USDs and withholding massive injections of liquidity, China is suddenly engaging in a tightening policy which essentially is offsetting the US's QE policy. Furthermore there's a credit bubble implosion about to happen as the largest banks are already bracing and to mitigate some of these effects, China is turning to policies that will kill growth as well, Dan Loeb was right on time with his observations.

I have almost no doubt whatsoever that this is indeed what the market (first the smarter money in credit and bonds and lastly equities) was reacting to on Friday, Chinese tightening, a Credit bubble built around housing prices (circa US 2007-2008) and policies that will kill Chinese growth.

If you're not worried about the situation or perhaps don't understand it, all you have to do is look at what we discovered Friday, check the posts from Friday again to see how dramatic the shift was.


Market Analysis Part 1

Earlier today I was trying to get a post together with some very interesting information that reaches back to the very sudden, strong and very odd behavior of Friday Oct. 18th which was another typical Op-Ex Friday (as all are now with weeklies) and we expected the typical Friday Op-Ex behavior which is to say that typically the market opens on Friday and hangs somewhere around Thursday's close until approximately 2-3 p.m. as most of the contracts are wrapped up by that time. Then the market starts coming unhinged from the typical op-ex pin or "Max Pain" in which the most number (or dollar amount) of open interest is pinned to expire worthless.

However earlier in the day there were some interesting hints, not anything big enough for a post, but shortly after things started moving very quickly.

I think it's best to go back and remember the feel of that Friday and I've selected a few posts from Friday the 18th so you can see the mindset, the adrenaline in having seemingly found something that the rest of the market had not seen.

While I finish putting together what I know so far, I'm putting up these few posts from Friday as a sample of what conditions were like , I think the emotional component of what was going on is important and it's very easy to forget, so if you have time, just check out these few short posts to get the feel of later Friday.

First I had put up the GOOG Video from Sunday October 6th, this showed the upside move we were expecting and why, GOOG was used as a proxy for the market, but also the analysis for GOOG stood on its own.

GOOG / Market Video From Sunday October 6th 10:56 a.m.

HYG Update 12:30 p.m.

Quick Look at Leading Indicators 1:30 p.m.


NUGT clarification

In the last post "Quick GLD/ GDX/ NUGT Update" it's more than a little confusing, the post reads...

"My approach to all of them including a NUGT long and GDX November calls is longer term in nature and that goes for Gold/GLD as well. I honestly prefer to just let them do what they will do short term, if in fact the positive divegrence on the pullback looks strong, then I'll likely look for a tactical entry for new positions or add to positions. However as a longer term play, I'm not willing to try to trade around this right now, I don't see any reason to and there aren't strong enough signals to make that chance worthwhile in my view so I'm staying with the GDX November $25 calls and with the NUGT (3x long miners) long position."

However the difference between a longer term or core position and a trading position gets confusing with yesterday's posts, I closed a NUGT TRADING Position around noon for a 14+% gain (these are the two links to each of those posts yesterday).

This NUGT was approached as a trading position rather than a longer term position, this is where the position was entered October 7th with the following excerpt...

"NUGT 1 min or GDX or 2, 3 min charts all show the same in line movement which suggests that although the base is still in place, the tactical signal for a real launch to the upside hasn't filled in yet, these intraday charts usually go very positive before the larger divergence (say the 5 min positive) launches, but this can happen within a day.

For the reasons above, I'm more inclined to look at gold as a longer term core long position with less leverage, GDX / NUGT as a shorter term position, much more like the market."

This is where the trading position in NUGT was established on the same day (Oct. 7th)...

Adding NUGT (3x leveraged long gold miners ETF) as a trading position


This is the exit from that position yesterday...

Trade Action: Closing out NUGT Trading Long

I tried to keep this separate as a "Trading Position", which a is shorter term to ride signals and exited yesterday as a pullback was expected, the pullback from today.

There's 1 core long NUGT currently down about  a little under 7%, this position will stay open along with the GDX calls. Sorry for any confusion, this is why I try to differentiate a trading position from a core position (trending position).


Quick Market Update

The intraday positive divergences in the averages have not grown in any way that makes me feel they are any kind of real threat to positions like SRTY , SPXU and FAZ (3x leveraged short SPX, R2K and Financials). In fact the intraday $TICK custom indicator has declined this afternoon.

The one thing from a behavioral standpoint is the look of a bear flag with the gap down and today being the flag, many traders would be setting up shorts, at least short duration traders. This alone makes me think an upside move from the bear flag would be likely as it would knock out any new (timid) shorts.

Other than that, until I get a good look at leading indicators, I'm not too concerned. The only thing I'm really interested in right now is taking a closer look at short term VIX futures (VXX) and VIX futures themselves, they'd be likely to point to any short term upside "noise" I'll call it, just because the negative trends are so clear and defined, this is how people get knocked out of good trades, they focus too myopically on intraday.short term trade and they miss the bigger trend laying right there and essentially get knocked out on noise. I don't want to be in that group.


There's also some interesting movement in HYG (HY Credit), today's lift saw intraday distribution and it already had a negative trend that set in very quickly and deeply last Friday, but it's an asset that is used to push the market around in short term manipulations in concert with others.

I'll have a lot more for you after I update after the close.

As I said though, for now the longer term trading positions established will stay in place. As far as new positions, I don't see this as a high probability window right now, that can change in a matter of hours as you know.

Quick GLD/GDX/NUGT Update

As far as gold and the miners go, we anticipated a pullback, there are some early hints of today's pullback perhaps even being accumulated, I'll try to get charts up later.

The short term charts have suggested a pullback and so far we've seen a near gap fill in GDX/NUGT, not so much in GLD.

My approach to all of them including a NUGT long and GDX November calls is longer term in nature and that goes for Gold/GLD as well. I honestly prefer to just let them do what they will do short term, if in fact the positive divegrence on the pullback looks strong, then I'll likely look for a tactical entry for new positions or add to positions. However as a longer term play, I'm not willing to try to trade around this right now, I don't see any reason to and there aren't strong enough signals to make that chance worthwhile in my view so I'm staying with the GDX November $25 calls and with the NUGT (3x long miners) long position.


URRE Position Update

The last URRE trade we had was on October 8th and by 10:30 a.m. October 9th we had a +20% gain, some members took profits and some held URRE, I decided to hold URRE as a longer term position.

From what I see right now, I still like URRE for my purposes of a longer trend trade, but if I were to look for a tactical, very specific entry, I don't think UI'd be calling it out at this moment.

Here are the charts with some suggested stops using the Trend Channel.

 The white arrow is where we bought URRE the last time, right at the very low of the downtrend/reversal, the next day, in a trade only a few hours old we had a +20% gain with no leverage at all.

From the looks of things, this tight range is where we typically see accumulation, but it is also so tight and defined that it's just begging for a head fake / stop run (yellow arrow). Personally I'll set some alerts for a move under support at $2.52 with $2.50 being a very obvious level for stops and there's a good chance a head fake move would not only provide accumulation of the stopped out shares, but also an excellent timing marker for an upside reversal.

 The charts that originally interested me in the trade did not include short term charts going positive, it was really strong longer term positive such as the 30 min above which was leading to the upside very impressively and is still in a large leading positive divdivergencegernece. 

The reason I would not enter a new position today is because of 1) the range being so obvious and 2) not having a signal that stands out like it did Oct. 8th, but we still have a very strong signal and I see no reason to let go of URRE.

 There was then and still is now the possibility of a much larger double bottom type of base based on this 60 min chart, if this were the case a pullback might be deeper, but the resulting uptrend (stage 2) would be twice as powerful.

Right now the daily Trend Channel's stop is $2.47, for a position that hasn't made it to stage 2 yet, this seems a bit too tight (these stops are based on a CLOSE below the level. Furthermore if there's a head fake hitting $2.50 stops, it's a little too close for comfort, but this all depends on how you set up your risk management, I always leave it wide for bottoming or topping positions as that's where the volatility is at its highest.

The 2-day TC seems more appropriate to me with a close below $2.38 acting as a stop, if you already have a position and want to use this wider stop, you can always consider lowering your position size to widen your stop.

I'm Back, all is good

I just returned  from picking up my mother, apparently whatever they were concerned about was not a problem, but they found 6 ulcers which she seemed to be relieved about so I guess all is well. Thank you for so many well-wishes, they are most appreciated.

I'm going to get back in to digging around the market and will resume normal posting shortly.

XLF/Financials

I have to run after this, I'll have my laptop with me.

Here's two quick charts of XLF/Financials...
 This is a 3 min chart, the larger feature is the leading negative, but as I said, nothing moves straight up or down, it's just not that simple and since this divergence has lasted this long, it  is more than just intraday and will likely be in to tomorrow so I see no reason to hold the Puts as they can be opened again tomorrow for another double digit or better gain. FAZ long however will stay open.

The larger trend, 15 min again the clear positive at 01/9 lows and the clear negative ay 10/18 and since. I drew in yellow a little scribble, which is largely what I'd consider any bounce to be, I didn't draw any specific expectation, I'm just trying to demonstrate the difference between the intraday signals and the trend.

See you in a little bit.

Closing XLF December Puts From Yesterday

The SPY looks to be one of the better formed intraday positives and it has a lot of exposure to Financials, there's no reason for me not take the gains, especially as I won't be able to watch the market clearly, this is why I also opened FAZ long and will leave that in position.

Market Update

Surprise, surprise, I just got the call to pick her up so it's likely I'll be back before the close.

This is just an example of the short term and the "trend" of this particular leg. I'm going to look at XLF quickly before I go an update that too.

 3 min SPY relative positive and the distribution of yesterday's head fake move.

This what I mean when I say I want to position my "trading positions" like SPXU or SRTY with the trend of 3C, this is a stronger 5 min chart, the difference may only be 2 minutes, but it's actually a big difference as 5 min is about where we first start seeing bigger institutional moves rahter than intraday moves, this is leading negative to a new low below the SPX lows of Oct. 9th so it's pretty serious, that doesn't mean there can't be and won't be shakeout efforts, that's what we are seeing set up on the intraday charts. The Positive to the left is the trend I want to follow on the upside on Oct. 9th and the leading negative is the trend I want to follow now.

Options positions are different as they have a whole different set of influences that create price, with equities.ETFs, price is price, not so with options so they have to be treated differently, at least the way I've found to use them successfully.

The 15 min chart is more trend, lacks detail, but again it showed the accumulation in to the Oct. 9 low and the distribution especially around the 18th where we suspected something big was going on.

All of the other averages are in line with this theme, some look a bit different than others, but the theme is the same, I'd expect short term trade to be noise and I don't want that knocking me out of positions set up for longer trends.

*Market Update and Message

*First it's very likely that at some point before the market closes I'm going to need to head out to pick up my mother who is having a procedure done now. She was getting pre-operation clearances for back surgery and there's some concern about something in her esophagus so they are sticking a camera down there and taking a look, but she's knocked out so I'll have to pick her up, just so you know and aren't surprised. I will have my computer with me so if there's a connection I'll continue posting if I'm in a waiting area or I also have my charting software back-up on my phone, at least enough. I'll still be posting the daily wrap and all of the other stuff after I bring her home.

As far as the market, there's still signals for a bounce in all of the major averages and all of the Index futures, this isn't anything of great concern to me, I figured we'd see downside today based on yesterday's internals and a larger roll over to the downside, but this is the area where there's a lot of chop, a lot of stopping people out or pulling them in, just mass confusion, we just need to focus on the trend and use the short term moves to our advantage.

So expect a bounce at some point, maybe in to the EOD. I will post those charts next so you get a feel, but they will look very much like this post from earlier.

I'll try to address some specific stocks some of you have asked about as well.

I'm going to try to quickly take a look at certain futures and leading indicators, but I'll get some market update out to you, whether I can get LI's in as well or not or if they deserve to be in the post, I don't know yet.

So far I still have no intention of closing yesterday's XLF put which is now up +22% for a December contract, I entered FAZ as well as SPXU and SRTY exactly for this kind of market in which sometimes you need to take option positions off to protect profits, but the draw down in choppy messy trade (which is all this looks to be- to sow confusion) is much more manageable in these 3x leveraged products and they can stay in place and in line with the 3C trend and not worry about the intraday mess created.

If I had shorted expiration XLF puts like November, then I might consider taking profits, I'll check XLF/FAZ once again before I say anything about taking profits in shorter expiration options.


DE Core Position Follow Up

Last week I was debating whether to cover the core short DE as I was looking for the market rally to take numerous stocks (short set ups) above their nearby ranges, DE has a wide trading range and a possible move above it was why I was considering covering and adding it back at better levels.

This is the last update posted for DE, you can clearly see what we were looking for, this was posted October 17th (last Thursday). If you are serious about DE as a core short (and I like it, it has done very well for me thus far and is not even close to fulfilling its downside potential), then I'd take the time to read the last update linked just above either now or later (after market).

DE DID NOT make the breakout and CAT (which looks nearly identical to DE) missed today's earnings on both Revenue and EPS and even worse, they guided lower which is all the market really cares about (not what you did, but what you expect or they expect you will do moving forward).

This obviously changes our DE short set up or the possibility of it as I still wasn't convinced and thus did not cover the core position (short).

While CAT is down over 6% right now, DE is down a fraction of a percent, I believe this is because of what I'm going to tell you later, although the two companies are in the same Industry and sub-industry group, CAT clearly is more geared toward large construction than DE and as a company with more of a world-wide reach, CAT will suffer more for what we've found.

Bottom line, DE can still set up a nice core short entry, but I want to give some alternatives as well, I will continue holding DE for now.

 These are the head fake areas in which DE would have been looked at as a core short position, the best was the head fake move outside what looks like a large bull flag (the second yellow circle) and we entered near that price point as DE is in the green and has been for some time,.

The reason I was considering covering and adding DE back was the range and the probability (like GOOG) for a breakout above the range which sets up a head fake /false breakout and an excellent, low risk entry. The eventual move following that would be expected to continue a primary trend to the downside.

This is the Distribution on a daily chart of DE, with Money Stream...
You can see the accumulation at the 2009 lows, distribution at the new 2011 high, a double top head fake move and the continuing distribution in DE to lower lows in Money Stream.

 This is the 15 min chart with two channels inside the larger trading range, today's move "looks" like a classical short set up, a break below support, a rally that fails at support. Traders shorting DE as they are likely to do with the CAT earnings, would be placing their stops just inside the channel, so a shakeout move inside the channel is likely.

Some of you may recognize this pattern as a small Channel Buster, the initial move (down) is typically followed by a head fake move that moves the opposite direction, shaking out new shorts.
 This is the hourly chart, you can see this large descending channel that I compare to a large bear flag on the first chart, the yellow circle is the head fake move and ideal short entry, but this 60 min positive divegrence in the trading range since is why I thought DE had a good chance of a head fake move above the range, setting up a better short entry and thus the reason I considered covering to add the short back at higher levels.

The 30 min chart is more detailed and seems to show a failure in the divergence, it may have been a CAT earnings leak or more likely just an understanding of the global economy (tonight's post will make much more sense here). In any case, the positive to negative may be what held DE back from making that upside move.

The 5 min chart shows the same exact thing and the 18th plays prominently in this scenario as well.

So here are my two trade setups I'm looking at, the first (1) would be the same as what's in the last update, a breakout above the range which is an excellent head fake set up, I'm surprised Wall St. would let it go by unless CAT is just too heavy an anchor as they trade nearly identical. We'd double check for distribution before entering a short above the range, but it is the best entry right now and the lowest risk.

The second entry (with the new situation -CAT, etc.) would be to look for a break down below the range, this will draw in the early shorts and they are almost always shaken out, their stops would likely be just inside the range , but only AFTER prices break below the range. Wall St. knows where they'll put their stops and they can see them as well so a shakeout move back inside the range would be the second short set up.

You may ask, "We;; we are essentially at the same area as entry #2 would eventually be, why not short DE here and now?" There's no reason you couldn't, I just see the timing issue as causing opportunity cost. The real move we are looking for is a larger downside trend, likely a primary bear trend, if you enter here and entry #2 plays out, in a month or so price will just be back at the same level you entered at today as those shorts will almost certainly be shaken out, so essentially unless you covered on the break below and took profits and re-entered in the channel, you'd just have a month or so of opportunity cost where those funds could be used to fund other positions that have a higher profit potential.

There is something to be said about having short exposure in place as things are changing in the market quickly, the Black Swan or SKEW Index is rising, we have numerous troublesome signals, but that's more of a personal "Risk tolerance" and potential opportunity cost that is really a choice each person has to make for themselves. For now since I already have a better entry level in DE and it's green, I'm just leaving it in place.


Market Update: Charts

This will hopefully put an intraday divergence in to perspective for you. For late, please concentrate on the 18th in the charts that show it. 

Most of you know that I'm not a big fan of leverage, but I do believe in using the right tool for the job and in many cases when we have a good signal, but the duration of the trade isn't long enough to make the risk/reward ratio worthwhile, leverage often is the only way to make the trade work, that changes as we get in to a more certain , trending market. The point being, you know that I'd normally have taken the +22% gain from yesterday's late afternoon XLF puts by now, I'm so unconcerned by this intraday positive (maybe a gap fiill) that I'm not even taking the gains from the XLF put because I believe it will do much better.

It's hard to explain and weight the information I'm giving you without knowing what I know about Friday and that is very hard to summarize beyond what I already posted,  it will take some time so beyond the earlier post with links to last Friday, I'll have to get the full story in after market, but suffice it to say, on Friday when it was said, "it looks like the market knows something we don't and it doesn't like it", it did.

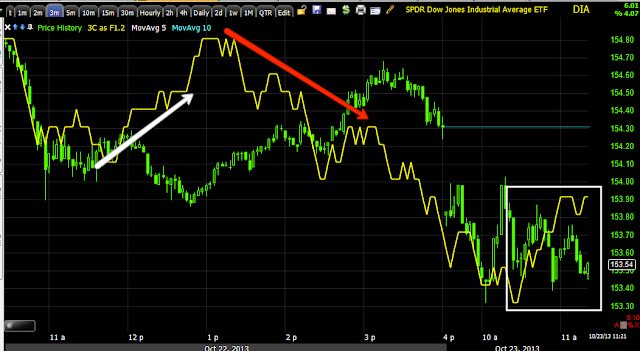
 DIA 3 min with a slight positive divegrence out to 3 mins, this is intraday, but a gap fill would be an easy target, often an initial shakeout of new shorts is on the menu too.

This is a much larger view of the DIA, but one that shows how much distribution went in to the last run. The price above the orange trendline is a head fake move before that top reversed down.

IWM 1 min has its head fake move from yesterday above the yellow line, you can see on this chart how 3C's character started deteriorating at the 18th. We have a small positive "relative " divergence which is the weakest kind, it's within a larger leading negative as 3C is leading negative since about the 21st here. In other words, the current positive can move the market intraday, but it has a sort of roof on the move in the stronger leading negative. Nothing moves straight up or down, it's a series of corrections, pullbacks, gap fills, etc.


 IWM 15 min chart shows like the DIA just how much distribution was in this last leg, but again I don't think it had anything to do with the actual level of the averages as we are not near window dressing, it was as I initially suspected, more of a utilitarian move to get other assets in to position.

 QQQ 2 min leading positive...

And the same chart zoomed out to the trend view, so you can put that in perspective.

SPY 1 min leading positive

And the 5 min chart leading negative, again for perspective.

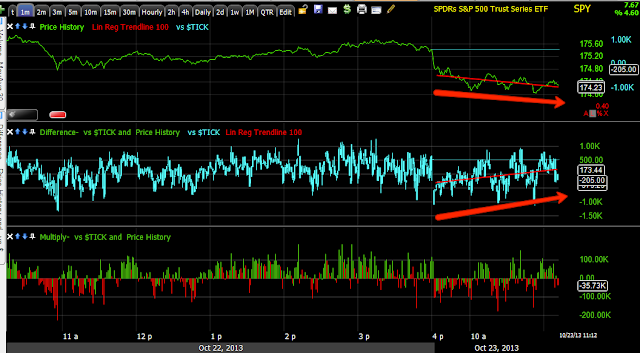
This was the TICK chart earlier, I'd expect a break above the channel when a move is about to start.

My custom indicator for TICK is meant to lead and it is hear if you look at the SPY and the TICK linear regression lines.

Index averages.

ES with a 1 min leading positive divegrence.

NQ with the same

TF with a weaker, but still intraday positive-all of these are 1 min. I didn't want to include every longer chart so just as a reminder...

The TF (R2K futures) 60 min with the reversal process up and down and the head fake movers in yellow, the leading negative on this very strong chart (60 min) really kicks in at the 18th.

So I'll hold current shorts, I may add to them or it may be an opportunity for you to start some positions if you didn't already and want to,  at a better price point with less risk.

Market Update, intraday bounce coming

I'll have some charts up in a minute, we should see this intraday bounce soon, maybe a gap fill, In my view it's nothing to be concerned over and I may even use it to add to some ;leveraged ETF shorts like FAZ, SRTY, SPXU, SQQQ or SDOW.

Asian Markets

The larger post of what happened on Friday and why that was exactly what we suspected, the market with advance knowledge of something that was not out in the news until overnight and something the market feared may have to either come in pieces or wait for the daily wrap as there's just so much to it.

However the main point being Friday our heads up may  have been the only one in retail land, write me if someone else knew or saw what we saw Friday as it caused the market to top, to put in a head fake move yesterday as we expected as we see them in 80% of all reversals and of course we are lower today with numerous other oddities coming this week like Icahn's sale (I think there's a reason he had to start now), Loeb's "concern for the global economy " so much so that he'll lose billions in income to return money to clients as he doesn't think there are investments out there that are worth taking so that he may keep his fund's performance up.

Last night The Shanghai Composite was down -1.25% and the Nikkei was down 2% as I suspected because of the Yen...
 This if Russell 2000 futures overnight sliding which wasn't a surprise after yesterday's chimney on the igloo.

From last night's Daily warp...

"I'll say that between the internals, the dominant Price/Volume relationships, and most of all the candles on volume, I think we're likely headed for a lower close tomorrow. That's not what's really importnat, however it could be the start of something really important because as I was looking for last night and yesterday in Financials and the market in general was a head fake move, that Igloo with a chimney" and we saw a lot of those today."

 This is the 15 min negative divegrence in the Nikkei, I can find the article this week in which I thought the Nikkei falls on dollar strength, but you can find it as easy, it's not that important. This is the distribution in the Nikkei and the overnight loss of 2%.

The reason I thought the Nikkei falls and this same reason negatively impacts our markets, the Yen which has been beaten down to support the 3 major carry trades that support the market, it was just Monday I said I thought the yellow arrow was a bull flag and the Yen would be up soon and the Nikkei down as well as the carry trades that support US markets in this post.

Other interesting posts:

"Among All the Other Oddities Today", from Friday October 18th...
"And I truly mean odd, actually not in the sense of scratching one's head and saying, "That's odd", but in the sense that one thing after another all day, all connected, all moving toward the same direction of overwhelming fear and VERY sudden at that. I detailed the events in the last post, but through most of the day there were beginnings of this behavior and then extremes. Whatever it was, I'm guessing it started pre-market and it seems as the Wall SAtreet Whisper made its rounds, first institutional assets saw these strange, rapid fear-based events and finally the dumb money which is generally considered to be stocks (Credit and Bond traders being some of the best informed, currency and futures traders and then stocks)."

Also from Friday Oct. 18th, 

"The Impression I get is that something is being discounted rapidly, something the market is not going to like. Protection is being sough, risk is being sold.

The other interesting thing (which I'll demonstrate later) is that distribution is already in effect in most assets, it's the short term charts, the ones that move the market near term on the upside move we had expected as the GOOG video makes clear 3 days before we got the start of it, that were positive. It's these same charts that are going negative so quickly, the implication being, they just found out something as well and are reacting violently and quickly."

And Sunday's post puts it all together, "The Interesting Stuff"

If you are not familiar with what happened Friday, these posts will get you up to speed, you'll need to understand them and understand what we saw that the entire retail market missed to understand the importance of what is going on right now, book mark this for later if you don't have the time right now.

Market Update for this a.m. coming next...

You'll Have to Forgive Me...

I'll be joining you in just a few moments, our SPXU and SRTY positions are up nicely this morning and the FAZ long from yesterday and XLF puts from yesterday are also up nicely (all trading positions).

You may remember last Friday, October 18th. We saw something that I doubt many other retail traders saw, I confirmed this in asking one of the better traders I know who works for a large investment bank as I mentioned earlier in the week. I didn't know what it was at the time, but between Loeb yesterday, some other funds movements, some military conflicts heating up again and an overnight article in Bloomberg, I think I know exactly what it is and why Loeb is so scared, why we saw what we saw Friday and why we are down today as expected last night. This may be a much bigger deal than it seems on the surface and I'm trying to prepare it with you.

I'll also admit that my mother is going in for some back surgery, but in their pre-surgical tests they found something that may need to be checked out immediately, that's not interfering with my day right now, I'm concentrated on putting together the pieces opf this bigger market event which I'll have out shortly as well as market updates and position management. I just want you to know I'm here, I just want to make sure I have my facts correct before presenting them, but it seems we saw something I think few if any other retail traders saw Friday, if you like go back to October 18th in the archives on the site to the right and listen to the tone of my posts, it was big when I saw it and its even bigger now. Loeb yesterday was right on time for this story.

I'll have that as well as position updates and market updates shortly. I just want you to know I'm here, just fact checking.