Wednesday, March 9, 2011

USO UPDATE

The first 3 charts all confirm that there has been a negative character to USO as expected most of the day, but late day we are seeing some positive divergences, most likely for a bounce as the 4th chart, the 15 minute, which warned us of a USO downside move is still negative.

3C 1 min

3C 5 min

3C 10 min

And the 15 minute remains negative suggesting at this point we will see an upside bounce tomorrow, maybe a little bit into the close here. I do not expect to see much more then that at this time judging from these charts.

A Member's Question

"What do you think the most likely outcome is for the rest of the week?"

My first response was you have to assume the trend of lateral volatility will continue, but on second thought.

Look at charts like these...

GOOG has broken down, we know it is HIGHLY likely we'll see a false move above resistance (former support that broke) as we almost always do.


AAPL is not as good of an example, but it's been down and one last false move would be great for the locals to set shorts, especially given the position of charts like GOOG and there's a bunch more like that, I just want to get this post out to you.

Here's the market..

IWM with a slight positive divergence

And here's how close it is to a new false breakout

QQQQ showing a few positive divergences

This one probably won't make it to a new high

SPY with a few positive divergences

And this one is very close to being able to put in a new high

While there are no positive divergences in DIA, it's close enough to put in a new high.

So looking at some bellwether charts and their recent breakdowns, knowing how the market reacts after those and how close we are or the locals are to being able to put in a new high on a false breakout to slaughter the longs, I'm starting to rethink my original answer and thinking that this week is as good as any for the locals to go ahead and shoot the market to a marginal new high. This isn't something I'd buy, it's the strength I've been talking about that I'd use to enter shorts. The overall market looks horrible and they know it too. If they can use a new high to establish shorts and naked shorts and then use the "Buy the dip" herd of sheep to go along, then they can set up a drop in the market with ZERO effort being we are so close in most averages.

I think I'd be on the look out for that the remainder of the week, I doubt they'd want to hold long over the weekend so maybe even tomorrow. I personally would use the event to get my shorts lined up, or at least get my toes wet and as I've been saying, just like Bill Gross, I'd be raising cash , getting out of longs, getting off of margin and just being patient and understanding much of what you see in the market is a lie.

Hows that for timely analysis?

This story just ran 30 mins ago, contrast that to my warning on a revolution in Egypt earlier today in the USO update at 11:11.


It just so happens that world events is another one of my passions. In any case, what is being said by the military regime about protesters being former Mubarak supporters is absolute bunk. They are out and if they want to keep their heads or any place in a new government, they keep quiet as anyone in the Egyptian government knows Mubarak was forced from power by the military and not because of the protests-that was a convenient cover. It was because ever since Nasser, the military has been the regime in Egypt. All leaders are chosen by the military and they come from the military-Mubarak was an air-force general (the air force being held in high esteem). So any pro Mubarak protesters who were former associates is a plain outright lie to try to cover for the fact that the street is starting to rise. It's a little more realistic version of Gadhafi's "The protesters/rebels in Libya are Al Qaeda and those they slipped hallucinogenic pills". On the outside Gadhafi's claim is much wore insane, but for those who understand how Egypt works, the Egyptian military's claim is just as ridiculous. They are trying to prevent the spread of another popular uprising, especially in light of events in Libya. 


Remember the ETF, EGPT.

VICL Trade Alert (long)

This one just triggered, taking out resistance. Remember, under $5 is a speculative trade, s make sure your risk management and position sizing reflects that. These are not buy and hold trades. If you get a double digit return in a day or two, I'd be taking partial or complete profits. You can email me anytime for a 3C update.

AAPL Follow Up

From yesterday's AAPL analysis

Today, we have follow through selling in AAPL.

Take a look at the bearish ascending wedge and notice the 1-day false breakout that I've been talking about as being so common place before a reversal. THIS IS 100% BECAUSE TECHNICAL TRADERS KEEP DING WHAT THEY'VE LEARNED IN 100 YEAR OLD BOOKS AND HAVE NOT ADAPTED TO THE FACT THAT THE MARKET UNDERSTANDS EXACTLY WHAT THEY ARE THINKING AND WHAT THEY WILL DO WHEN PRESENTED WITH ANY NUMBER OF TECHNICAL PATTERNS. In the red box, we have a signal candle violated triggering a short signal in AAPL.

The Linear Regression chart (if you can't see the blue lines, click on the chart for a larger view). When this channel breaks, we will likely see a surge in volume. There's a good chance we will see a bounce too unless the entire market breaks down. This is a trade that is well suited to longer put options and t phasing into the trade in the same manner institutional money does (if your commission structure will allow for it).

The 3C 15 min chart is where we see swing reversals and we see that here on the red negative divergence. Recently the 15 min 3C chart has put in a leading negative divergence which is the worst or most powerful type-it leads price lower.

The 10 min chart shows an attempted false breakout to be exactly that-false. While many technical traders have been taught by books to buy such a breakout, smart money knows this and they use the false break out, the subsequent drop to use the trader's own losses to enhance their short position gains. Just look at the gains they've made alredy from longs selling at a loss. It requires no additional investment from intitutions, it works every time -why not do it? This is why we have to adapt.

I might look for a bounce to short into strength, ideally though I'd like to pick up some shares now in case the market falls apart and we never see that bounce.

DIA/IWM Moving Away from confirmation

DIA negative divergences-1 min 3C


IWM negative 3C divergences including a small leading negative divergence.

The Q's and the SPY are not moving in lock step, they are off on their own. I'm going to try to see what that's about.

Mark Twain Said, History doesn't repeat, "it rhythms"

Here's a kind of part two to LAST NIGHT'S WARNING POST. It's best if you read last night's post first so it's fresh in your head, again THE LINK

Now, here are some charts from April of 2010, the last really significant sell-off we saw which averaged about 15-16%. However, if you have caught my videos I have posted recently on how the market's structure has been seriously and progressively compromised and the effect it will have on any future downside event, you'll know that the next one will be more dangerous then anything we've probably ever seen.

Here's a link to my video channel (see the videos titled "Stock Market Bubble") and the last 5 or 6 videos have touched on the subject to varying degrees. Here's another link to all my videos.

Now, here are the similarities between the last major sell-off event and now...

The DIA-MAY of 2010-note the volatility in price and the large volume, it's even worse now.

The IWM at May, 2010 and again it looks worse now

The QQQQ at May, 2010-also looks worse now

The SPY at the same time

Here are the results-a 16% approximate decline. Remember, the market structure is severely impaired now and the QE/POMO melt-up has made things worse, I touch on the reasons why in the videos.

The VXX back then in May of 2010-look familiar?

The VXX now.

Remember I said to watch what Bill Gross does as he has acted as a Fed mouthpiece, telegraphing the Fed's intensions.

Here's some news out today...

PIMCO Drops ALL Treasuries and Raises the highest levels of cash seen. I hinted the other day that indications are that QE3 is a non-starter, this story would seem to confirm that and my advice to raise cash seems to be good advice, after all, Bill Gross just raised record levels.

With no QE3, which has been the ONLY thing supporting the market as the fundamentals behind the headlines continue to be horrible and independent sources are having a major disagreement with everything the government puts out, it would seem there is no more reason to stay long equities. In fact multiple asset classes that have been bought on speculative -nearly free money, should all decline. This may very well include precious metals. Oil is a different story as the fundamental story continues to unfold there. While I'm not saying "buy today", I do think there will be a time (probably sometime this month) to start loading up the truck in this asset class.

There are some other interesting news items out today as well...  

"U.S. markets opened mixed a day after a prominent hedge fund manager said he would divest himself of outside investors in anticipation of a downturn.
Maverick investor Carl Icahn said he did not predict a downturn, but would return about $1.76 billion to investors due to the possibility of a market crisis after a sharp run up in the past two years."

It's been about a month since I started saying, "Something in my gut tells me this market is just not right". Ever since then, we've seen nothing but confirmation of that gut feeling. Don't panic, start putting your plans into place and into motion. Stay conservative, protect your portfolio, any drop will have significant opportunities, even if you miss the first leg.

NFLX-A Bellwether-Trade Idea

That's an understatement. In any case, the action in NFLX is indicative of the market's health and it isn't pretty. There's a trade here, especially for options players, although I'd be looking for the longest expiration date I could afford as close to the money on a put. For traders shorting NFLX, take a look at the charts, I'd wait for a bounce or phase into the position with a little here and add on a bounce to about 50% of the intended position, the rest I'd add on a new leg down.

Check out the channel busters in NFLX and what has happened after the channel has been broken to the upside. This is a variation of the snowball effect of losses incurred by longs buying the channel breakout. It works every time. However, this most recent channel break may be the last in the uptrend.

The red square is the most recent channel break to the upside, the 15 min 3C chart shows the negative divergence which is most likely institutional money going short/naked short. You ca see what happened to price after, however we are approaching an area where profits will be taken and a reset for a new leg down should begin with a bounce attempt.

The 1 min chart shows a positive divergence suggesting that the bounce attempt is already under accumulation, so if it were me, I'd show some patience, maybe short a little here just in case the broader market tanks, but for the most part, I want to short into strength.

The 3-day trend channel has held the entire trend and is the stop that I would choose for my initial position around $220-$225, keep that in mind for risk management/position sizing.

The 2-day TC has held most of the trend, you can see in white in mid 2010 where it stopped out, but if you want a tighter stop, this is as tight as I would go for a position/trend trade and it's pretty close to the 3-day anyway-around $215-$220.

Look for the bounce, if you like the trade idea, keep in touch with me and we'll look for the distribution cycle to begin, that's where I'd start adding seriously.

UUP Update

Yesterday I updated UUP. We saw a move up in price, but 3C slipped a bit, today it's starting to strengthen, I'm guessing the Libyan problem which is causing gas to rise to absurd levels is starting to be discounted in the euro-Zone.

Here's the recent charts and here's yesterday's broader analysis.

UUP showing accumulation on today's slight dip

Confirmation as the Euro shows distribution on its slight pop.

Market Update

That's 3 for 3. What I'm referring to are the market calls for reversals based on oversold/overbought conditions in the market, 3C has been 1 component in showing us this and the Price/Volume relationships have been another.

The IWM perhaps illustrates this the best.

This may look like a consolidation. It's not, the volume is completely wrong for a consolidation. It's an extreme zone of volatility and we have called 3 oversold/overbought reversals within it. I talked about this last night HERE

Yesterday's negative divergence taken with the dominant price volume relationship=reversal

Here the Q's show a near breakdown from the volatility zone. Any traders that can't keep on top of these daily changes are getting chewed up through the meat grinder. This is why we have to look at the bigger picture and keep stops wide right now along with reducing leverage, especially on shorts and raise cash for opportunities. Once again, the volume, which should decline in a consolidation, is just random and huge along with the daily candle body size plus the wicks. This is an extremely volatile environment-very typical action for tops. Make sure you read the link that I provided under the IWM section from last night.

The Q's in a negative divergence yesterday. Most averages today are pretty close to confirmation.

The SPY looks like a consolidation triangle, once again, volume shows it is not. In my opinion, the trend has already changed and it is a mistake to believe we are in a consolidation. However, a break below any of the average's support trendlines should be acted on (add to shorts and inverse ETFs).

The SPY yesterday signaling a negative divergence. Even before the close it was obvious that volume would come in light and with the price gains our dominant relationship would be price up/volume down, which is the most bearish of all 4 relationships and last night it was very dominant.

Right now there's no real edge in 3C short term as we have a lot of confirmation, we'll watch for that to change, but watch price around support as it could change quickly.

USO UPDATE

Just to be clear, I'm intermediate to long term bullish on oil/USO, I think the events in the middle east will reshape the middle east and create many power vacuums. The first domino to fall, Tunisia, has already seen radical Islamic movements start to grab for power. Egypt will be a big prize (although not the biggest) and protest continue there as the people are realizing what was said here weeks ago, the regime wasn't Mubarak, he was chosen by the regime, the regime is the military and they gave themselves 6 months-enough time they hope to let things cool down, make minimal concessions and keep the status quo which is the military regime retaining power and no real change in Egypt. EGPT is an ETF I like for this very reason. I believe at some point, the people of Egypt will come to blows with the military which is organized. It would be an ugly revolution and I do believe that the Muslim Brotherhood with the help of Hamas is organizing and preparing for such an eventuality. It's not the democratic favorite who wins, but the best organized so Egypt alone is a template for the seeds of revolution that are being sown throughout the region. Overthrow of a government is the first step in a much larger chess match and a much more dangerous one. Thus I'm long term bullish on oil and I think the US inventories report this morning shows that the US is aware of this as well as the strategic reserves will likely be filled to maximum capacity ASAP.

Here's USO, which in the short term, I think may see some downside. There are various reasons I could give for this, I just don't know which is the real reason/reasons.


USO's price pattern is wedging, this is a bit bearish here.

An hourly negative divergence on 3C

An important 15 min negative divergence

A 5 min negative divergence on the news of the inventories report this morning. Price did gap up, but it seem there's some profit taking into the gap.

The 1 min chart confirms the findings of the 5 min chart

Whether we retrace the entire wedge or not,  don't know. I kind of doubt it at the speed of the news cycle, but who knows if we actually get boots on the ground. 

JPM vs Silver

By now, you've probably heard about the internet viral campaign to sink JPM by buying physical silver as JPM inherited a large short on silver from Bear Stearns. Now I don't know what's real in this and what isn't. Originally the line in the sand was $30/$32 or so for silver and it was supposed to shoot up to $50, now the line has moved to the $36 area or so. A reader sent me some information about the connection so  figured I'd post both charts. I'm not sure I see a whole lot of correlation here, but I may be missing something so I present them for you.

Here is yesterday's SLV analysis (since I can't analyze COMEX with 3C I use SLV).

Here are the JPM and SLV charts:


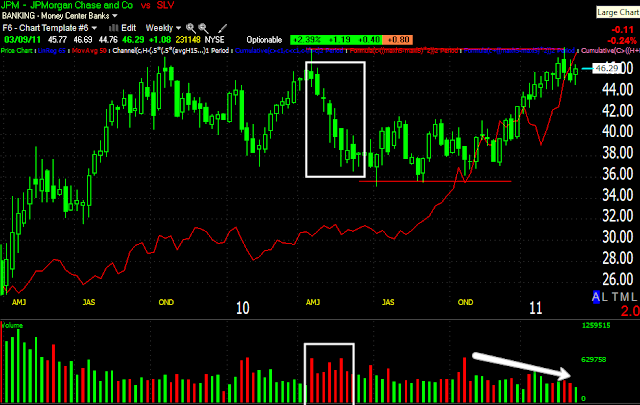
JPM with SLV compared in red on a 5-day chart. JPM is tracing out a double top as SLV moves higher, this would be interesting if the Money Center Industry Group that JPM belongs to didn't look exactly the same-see next chart.

There are 55 components in the Money Center Bank Industry, JPM is obviously a heavy hitter, but there are several other big banks in there as well.

JPM 30 min chart shows the most recent top (second top of the double top with a negative divergence), but right after we have a slight positive divergence. I wonder if JPM will make another run for resistance around $48 and if so, dos that say something about Silver?

We see the exact same situation on the 15 min chart, with the same question.

And here's the close up on the 5 min chart of the divergence.

On a 1-min chart we do have a negative divergence. If this 1-min negative continues to build, it will effect the 5, 10, 15 min charts, otherwise it may just be reacting to today's market conditions thus far.


SLV
SLV is in a correction, remember, equities can correct through price and through time-a rectangle is a perfect example of correcting through time without losing ground in price.

Here's the 60 min 3C SLV chart indicating a negative divergence. It's not VERY strong, but it's enough for a correction and it could build. Remember my analysis yesterday, I'm not of an opinion one way or the other, just looking for the high probability/low risk trade.

The 30 min 3C chat looks a bit worse, which can effect the hourly.

The 15 min chart looks very bad the last two days, especially as today tries to stay in the same relative price zone, 3C has dropped into the worst kind of divergence, a leading negative divergence in the red box.

We can see a positive divergence yesterday building for the gap up this morning, but that gap on the 5 min chart saw a quick negative divergence right off the open.

Finally the 1 min chart illustrates the failure of the gap on a 3C basis this morning.

I think we'll need to see more data before we can say there's a definitive correlation between the price of SLV and JPM, I have not been a fan of JPM and believe SLV or not, it's in some trouble, but the question re: silver remains open. JPM has significant resources and they are not the only ones in the short silver trade. Could they be setting up the mother of all bull traps?