Thursday, October 3, 2013

Futures at the Close

It's not the norm that futures are clearer than equity assets, but considering the size of some of the contracts traded, I think it is a bit more meaningful when they are clearer.

As for the Index Futures...
 ES 5 min chart positive

NQ 1 min chart positive (after having shown nothing positive for the last week or so.

TF 5 min futures are positive and especially so at what could be considered a channel buster.

Precious metals... As you know, these have not been very clear, to the point in which I wouldn't post charts because I didn't want anyone studying them so close as to try to justify a position when the charts said absolutely nothing; so this is clear improvement in both silver and gold.
 Gold 15 min. futures showing a negative before price fell, a positive before it rallied back up and a leading positive as it is flat.

Silver 30 min futures makes me wonder if the break on 10/1 should be considered a head fake move being the range before it was pretty defined, in any case, a positive general outlook there too.

Finally, Crude...

Crude oil 30 min positive which doesn't surprise me, I've been waiting for the set up to get in to good tactical position and just missed it by a half a day, but I think it's still a good set up and it has a function to perform for Wall St. so I like it.

More to come, I will check futures again later tonight and see if there is anything significant as the last several nights there hasn't been much.


GDX Breaks $24.30 5 Seconds Before the Bell

I would NOT but NUGT or GDX in AH because it broke the level I was looking for as per this post.

The break below is the movement and the stop-run as well as the short trigger, but that's just the movement that allows us to look in through the window as it was made clear in the linked post above and specifically this chart and commentary from that post.

"This is what the positive 3 min chart would have to do, price below local support and 3C making higher leading positive readings."

As you can see from the chart and comments from the post on GDX/NUGT, price would have to break that level, while 3C gave proof that the break below that level was accumulated, we don't want to buy a break lower, we want to buy a head fake move and the only way to tell is to look for accumulation which would not register in 5 seconds or an actual price reversal back above the $24.30 level, although the former is a much better indication than the later.

Volume did swell on the break and that is why the head fake move is run, so that is a good indication that the area will see accumulation and make NUGT or GDX a nice long there. So we have the set up we were looking for, we have the reason such a set up would be run verified by volume, we just need the proof the volume was accumulated and I think the probabilities are very high, but I rely on objective data, not guessing or handicapping probabilities.

USO Post Correction

In this post I listed DTO as a possible ETF, scratch that, it is an inverse or short oil.

GDX / NUGT Trade Set -Up & Follow Up.

With gold acting noticeably better, I'd assume the fairly tight correlation between gold and miners will be beneficial to GDX / NUGT longs.

Being that I already have enough exposure to GDX calls, I personally would use this set up to add a NUGT long to the equity tracking portfolio, meant to try to capture a longer trend than what I typically capture with options.

Here are the charts and the set up which is close and lets the trade come to us at the best price and lowest risk as well as increased timing probabilities.
 5-day view of a large complex H&S top with a break below the neck line bringing the shorts in and a recent volume surge reminiscent of a capitulation or exhaustion event.

Typically these H&S tops are shaken out around this area with a move back above the neckline squeezing shorts who expect the neckline to hold as resistance.

 A closer daily look, we have what looks like an inverse (complex) H&S bottom.

With in that on a 60 min chart, the failed F_O_M_C knee-jerk reaction, then a bear flag that fails followed by a bull flag that fails and a current bearish descending triangle with price just under support as a possible/probable head fake move and the apex very close meaning a move would have to be sooner than later as they typically move before passing the apex in time.

3o min leading positive @ the descending triangle is interesting


 As is the 15 min leading positive

We also have a 5 min leading positive.

For me, the decision as to whether or not to add NUGT long would depend on the near term range at $24.30 being broken to the down side and clear evidence it has been accumulated, then I'd add NUGT long, but if I didn't already have GDX calls, I'd consider adding calls there instead.

This is what the positive 3 min chart would have to do, price below local support and 3C making higher leading positive readings.

I'd set some [rice alerts if the position interests you.


VXX Follow up and P/L

There has been a lot of fooling around with the VIX this week as we saw early in the week and now again, this is the asset of choice rather than all of the momentum stocks, I imagine it's a lot cheaper to move 1 asset than to move the market with a number of momentum assets.


The P/L on this position isn't great, I'm really more happy just to be out of it without taking any losses.

At a cost basis of $1.22 and a fill of $1.36, the P/L is a gain of +11.5%

The intraday charts were looking troublesome earlier, this is worse, I tried to take advantage of a little positive divegrence to sell in to a little strength.

The migration of the divergence is clear at the 2 min chart and this fits with everything else we are seeing today.

The "Reversal Process" in the asset, note how bottoms are larger here than tops, but they are still both rounding as a process and not a "V" shaped event.

The 25 min leading positive has a recent relative negative which is what is being seen intraday making its way to this longer term chart.

USO Follow Up

I probably don't need to go over this again as the set up has been explained for about a week or more.

I would have preferred a deeper pullback for an entry, but you have to work with what you have and make the best decisions you can with the information you have at the time.
 USO's reversal yesterday with a head fake move as they occur on all timeframes, the market's behavior is fractal because the same emotions that move a 2 min chart move a 2-day chart.

I have recently explained a topping process as an "Igloo with a chimney", that's the rounding top with a head fake move just before the reversal and you can get an idea of what I meant here. The 2 min is leading positive right now, it could pullback for a stronger base, but I'm not too concerned with a little delay if need be.

 The 3 min chart also positive intraday and leading

The larger 30 min shows the grand plan, the first is to catch the long move that will shake out shorts, note the positive divegrence out here at 30 mins so it looks VERY likely and I would have guessed it without 3C just because of the price patterns and the way technical traders think and trade.

 The 4 hour chart shows where the trending trade is, so what do I want to do with near term price strength to take advantage of the highest probabilities for the largest trade as depicted on the chart above?

I want to sell short in to price action higher, but only when and where it makes sense.

It makes sense at 2 areas, the first is inside this parallelogram which is NOT a flag, that will cause some shorts to cover and demand to rise, "IF" we can get above the pattern, that is the ultimate entry with the lowest risk, the highest profit potential and the highest probabilities, although they are already super high.

You can see by the red arrow where the chart above this one suggests price is going as the primary trend.

Closing VXX Oct. $14 Call

Trade Idea: USO Long

I'm opening a USO November $37.50 call, although you could use the leveraged ETFs like UCO or DTO, they don't have a lot of liquidity, the 3x leveraged UOIL and the WTI (USO) based UWTI have almost no liquidity at all.

I'll get charts up soon.

Important Market Update

This post late yesterday after watching market action seems to have hit the nail right on the head.

"The one thought I keep having centers on the IWM. We had two good days up and not the kind of breakout that it needs to get retail pumped. I've seen this a lot of times, it's kind of like trying to get a car out of the sand in which you have to generate momentum by putting it in reverse and then drive and then reverse again to get a head start on the next swing forward.

To me, it looks like the IWM needs to put it in reverse before it can make another shot at forward or up in this scenario."

The evidence?

Ot started building on the last market update, it has continued and I don't think this is just for a closing p.m. ramp.

 DIA 1 min intraday with a leading positive 3C divegrence, this needs to base a bit more, but we will soon be ready to enter new trades in my opinion, likely later today.

IWM relative positive divegrence

Even the QQQ which has had the worst underlying 3C performance for over a week is showing a leading positive 1 min and...

There is migration to the 2 min chart so the divegrence is strengthening, it appears to be the real deal and not just some intraday move. As I said, they may not want to invest much in this cycle and who can blame them, but I doubt they'll let it slip by with so little ground to cover before they reach their target.

SPY has migrated all the way out to the 3 min chart.

Even the Index futures (as per the last update stated) are seeing positive divergences.

 ES (SPX Futures) 5 min

NQ (NDX Futures) leading positive 1 min

TF (Russell 2000 Futures) 5 min

HYG-High Yield Credit is sloppy in many timeframes, but still holding at the 5 , as we saw with the market, we see with HYG, last Friday is where accumulation picked up, it is leading positive.

And the VIX Futures are starting to go negative intraday.

If the SPY Arbitrage trade is activated as HYG and VXX are starting to suggest, then out intended TLT trade would be in the perfect place being the 3rd asset in the arbitrage.

FSLR Update

If I was managing this as a long equity, I probably wouldn't take any action, as a long option
(Call), I'd be out by now, if I was looking to enter or add-to, I'd be patient.

There's still plenty of upside in FSLR, I just don't think right now is the time to add.

 30 min leading positive, rounding base and head fake at the bottom.

The small divergences on the 10 min have been 100% accurate, we have a negative now.

The intraday appears to be in line and not such a big deal, but...

It's this 3 min that concerns me and makes me think a deeper pullback/consolidation is likely.

I'd like to see the intraday charts screaming positive before entering a new position or adding to, but otherwise, I think that 30 min chart shows FSLR is just getting started.

***Market Update

All 4 major averages as well as the Index futures are showing stronger divergences now than through most of yesterday, all positive.

They are so strong in many cases, they look like they could make a "V" reversal, although I still think a reversal process of a little more time is more likely and a better entry.

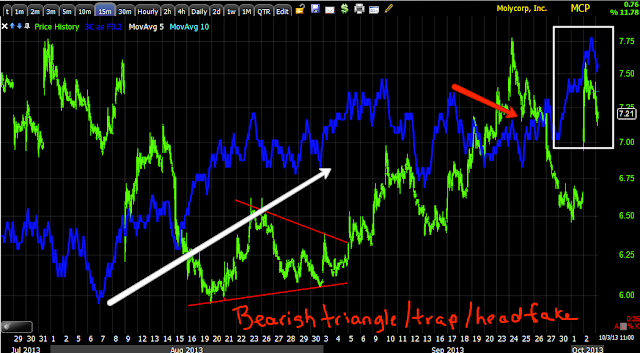
MCP - ANOTHER SCBO

Yesterday we closed Tuesday afternoon's MCP Nov. calls for +38% and +58% for an average gain of +42% for a day.

As of yesterday we were looking for a pullback close to the 60 min 10-bar chart and signs of accumulation and thus far this morning, MCP is not disappointing.

 Above you can see where we entered around 3:15 on Tuesday and where we sold the first batch of 40 calls  ad the second batch of the remaining 10 calls. We were then looking for the pullback move to re-enter for a new trade.

This is the 60 min X-Over Screen and I suggested the $7.20 area would be where the 10-bar moving average would be found when price and the average met, so far so good except this "reversal" needs more time so I'll be watching it.

The 15 min chart shows accumulation in to a bearish continuation triangle that would have fooled any shorts in to a loss, the point is it still leads positive so we just need an entry point with lower risk and a better entry.

The 3 min chart shows the 3C signal suggesting a pullback, I think when this chart is more positive looking, we'll be close to that entry.

Crude / USO Giving us a SCBO

For nearly the last week I have thought crude would break down and then make a move higher, I missed calling that move out by a half day, however yesterday I felt we'd get a Second Chance Buying Opportunity (SCBO).

Oil this morning and the overall game plan...
 An early gap up/head fake is looking like it will give the second chance entry I was thinking was likely yesterday. If you are interested in this leg of the trade, I'd set some alerts at lower prices, but not too far, I'd consider this a correction.

The 30 min Crude Futures chart suggests oil / USO moves higher, this is the first trade in the game plan, the one I wish I had entered late Tuesday, but will hopefully get a second chance.

I have thought that USO would either enter the false flag and shakeout shorts or if we really get lucky, move above it and shakeout shorts and suck in retail longs.

The oil Futures 4 hour chart shows which direction oil i s ultimately heading so any entry in the false flag or especially above it, would be an excellent core short or at least a position trade. So we have two trades, both are set up, it's just a matter of a decent entry.


A New Day and New Type of Fence Sitting

Imagine you are the market, one sentient being rather than the tri-polar masquerade that is millions of different voices all screaming in one's head at the same time (the market as it is). Yesterday you're sitting on the fence and leaning toward jumping DOWN.

Watching the futures for a second night and morning, there's a different feel, not one so much of useless information, but one of a very tight correlation of "sitting on the fence" purposefully, but today you could say it looks better or perhaps it's just better to leave, "Better" out and say, "It doesn't look as bad".

As we saw Tuesday and Wednesday and this is why I chose not to hit the panic button yesterday as mentioned in a late day post, "A day a trend does not make". However,  this can change in a matter of a few hours so I wouldn't grow attached to it, but for a feeling of what I'm talking about, look at the Index Futures.

 This is a 1 min overnight chart of ES (SPX futures), there are two divergences, but I don't remember any recent overnight charts that were this tight with price.

The same goes for NQ (NASDAQ 100 Futures), there's almost no divergences, almost perfect confirmation...almost

However if yesterday had a distinct negative feel which it did, today has a slightly more confident feel.

 To the left the 5 min ES (SPX Futures) shows 3C lagging and the negative feel, in white it is at least in line and slightly leading, this does matter because the IWM is so close to a breakout event that can reshape short term trade, looking back historically, it would be an unremarkable moment on a chart, but in the here and now it would be one of the most important moments, probably the second most important for the overall market for the foreseeable near future.

We shall know with greater certainty shortly as regular hours volume should confirm or deny.

 Note the positive at the left in the benchmark 10 year Treasury and the in line status that confirms what I'm saying about the Index Futures above.

Crude as I have been predicting, but missed the bottom, is still telegraphing strength for a move higher, hopefully we can get involved. I'd guess this is a discounting of fears of a lower dollar due to the Debt Ceiling, but I think it's a transitory rally that fades to a decline.


Strangely for a market that is very scared of US debt default on the failure to secure a Debt Ceiling deal in time before the first interest payment comes due after the Treasury runs out of money in only a few short weeks at best, the $USD has an odd positive divegrence.

While the 1 month Treasuries are hitting near 5 year highs on the fear that Congress won't tackle the Debt Ceiling (this is a higher rate than that of the 2011 Debt Ceiling), the $USD seems to be telegraphing that the fear may not be as real as the much watched 1 month treasuries suggest.

This is a 60 min USD chart.