Tuesday, April 24, 2012

AAPL AH Update

I had several resistance zones marked, looking for a move in AAPL, $575 was an important support zone that had been broken, $600 was another as a centennial mark, which is psychologically important. The final area would be above the downtrend resistance just over $600, AAPL is now trading at $602.40, should this hold up overnight (the guidance may be an issue, if not now, probably soon), AAPL will have accomplished the volatility shakeout of numerous shorts we have been looking for.

As AAPL has the power to move the market, the level I'd like to see in the SPX would be in the $1400-$1410 area, currently the SPY is around $138 or $1380 SPX.

Oh... Earnings may explain these two charts of AAPL

 The more important AAPL 60 min has been in an ever worsening leading negative divergence, this is one of the fastest, ugliest 60 min leading negatives I've seen in a long time.

The shorter term 15 min which is leading positive represents the near term, typically swing trade length. The 60 min in the condition it is in, represents a reversal of AAPL's trend.

This may make some sense upon first look at earnings (try to recall the earlier post about earnings/guidance/sentiment).

AAPL beats on revenue and EPS, pretty solid.

  • APPLE 2Q REV. $39.19B, EST. $36.87B
  • APPLE 2Q EPS $12.30, EST. $10.02
  • APPLE SOLD 35.1 MILLION IPHONES IN QTR, EST. 31.2M   
  • APPLE 2Q IPOD UNITS SOLD 7.7MLN , DOWN 15%            
  • APPLE 2Q IPAD UNITS SOLD 11.8MLN                      
  • APPLE 2Q GROSS MARGIN 47.4%, EST. 42.8%              
  • APPLE 2Q MACINTOSH UNITS SOLD 4MLN , UP 7%            
AAPL Guides lower.... 
  • APPLE SEES 3Q REV. ABOUT $34B, EST. $37.49B
  • APPLE SEES 3Q EPS ABOUT $8.68, EST. $9.96    
AAPL is well known for conservative guidance, this however may be the perception that changes not only AAPL, but the market.


There she blows

 While I haven't read the AAPL earnings, there's the bid/ask above $580 after earnings were released for AAPL-maybe we get our tech rotation after all-Finally.


 ES pops at 4:30

It seems the chart with the least noise (other than the 60 min chart which is as you know, very ugly) was the correct chart.

All of the averages are up in after hours, the Dow optically looks to be the laggard.

More coming...

ES Update

Something interesting happened right at 2:30 in ES, if you didn't already know that AAPL had broken below yesterday's support and then crossed back above it at 2:30, this may night be as interesting. It seems the market has all of its near term hope pinned on AAPL.

 While 3C still remains locked in a negative divergence (as explained earlier, the only time 3C on ES shows persistent divergences is during bounce attempts that have failed, otherwise it is an excellent intraday movement indicator), ES found a bottom right at 2:30 as AAPL crossed back above yesterday's support.


 ES had a brief struggle at VWAP (this is where institutional orders are targeted for execution). Since the close, ES has gained even more ground.

While we haven't looked at our own version of CONTEXT, the risk asset layout, as mentioned earlier today the underlying credit, rates and fx components that make up the model have been supportive of ES moving higher, as the histogram shows, that has increased throughout the day.

I'll be looking at our own, more detailed risk asset layout shortly.


Energy and GDX/GDXJ

No charts for the gold miners, my position is still open, they are showing end of day positive leading divergences that look great.

For Energy
 1 min largely in line, financials look worse, this could certainly be the Euro repatriation effect as energy has a strong correlation to the $USD (Euro is just a proxy).

 One of the best head fakes in the last week in yellow, this is the morning I sold my USO calls right at the top. 2 min is in line, financials look worse as far as relative performance/rotation moving forward.

 That beautiful head fake move, note it made a higher high and failed spectacularly, this is why I love the head fake trades.
 5 min showing some weakness -not in line currently

15 min Energy, again, beautiful head fake move, good money to be made on those. 15 min is in line, not nearly as strong as tech.

Financials

About that rotation...


 XLF 1 min leading negative

 2 min leading negative and note the flat area, this is where divergences are most commonly seen, the reason is simple, filling institutional orders at the VWAP.

 The 5 min leading negative

At this point, I would consider shorting financials here and now, the only problem is that the market tends to move together. This would suggest if Tech can take the market higher, financials will move in the same direction, it is just their relative performance that would lag.

The all important 15 min is only in line. Again, this is not very positive for financials, but I would not be taking large bets against a directional move, even if it is a relative weak performer.

Technology Sector Update

I'd like to compare Tech, Financials and Energy for you as well as sector rotation, but I want to get this out quickly, I'll add the others after.

 Tech 1 min, it ha been in line since yesterday mostly, look at the leading positive divergence, where did it start? The same place as AAPL's dip below yesterday' support and recovery.


 Tech 2 min -same divergence, same place

 the 5 min has been holding up, not confirming the downside move in Tech

Again, the important chart, the 15 minute, leading positive.

You know I've been looking for the Tech rotation, this is probably the last best chance for that to occur.

AAPL Update

As you know, the indications have suggested Tech wants to rotate in, despite having some fierce head winds for reasons I mentioned in the last post and because of NFLX's guidance. How is NFLX connected to AAPL? It seems to be more of a disposable income issue more than anything. If NFLX is going to hurt on subscriptions that aren't very expensive, than how does that play in to expensive AAPL products?

On the other side of the coin, at least while Steve Jobs was alive, who I suspect learned some very fundamental business practices from watching Scotty on Star Trek ("Kirk: Scotty how long until the warp drive is fixed?" Scotty: I'm giving her my all, I'll need 15 minutes"-Scotty fixes it in 5 minutes, which he knew he could and looks like the hero), everyone knows and has known forever that AAPL guides VERY conservatively, therefore the easily beat-except once not too long ago.

The market is most likely sticking with the trend, AAPL guides low, comes out with a head line beat, Wall Street takes apart the earnings report and everyone realizes after a few days that AAPL growth is probably not sustainable at the past pace. Thus if there's a volatile short term bounce, which industry group is likely to lead it? Tech.

As for the AAPL update...

 AAPL did break just below yesterday's hammer support, but let take a closer look.

 The break did not draw in large volume, that' because there aren't a large cadre of longs to be stopped out, however on the move back above volume pick up.

 Where exactly is the clearest 2 min divergence we have seen today? Right at the break below support, cheap shares.

 2 min is in line.

 5 min has a relative positive divergence and in line

This is and always has been (so long as it has been there) the great hope pinned on AAPL and thus a tech led bounce, a 15 min positive leading divergence. The 15 min timeframe sounds smal, but it is very influential and has moved more than just a swing trade.

This is where it seems hopes are pinned.

Market Update

I'm going to go ahead and call this a change in character of the markets, I can't remember the last time I saw so much noise on short term charts. Back on April 10th when the market hit its low and and I thought we'd see a very volatile move up from there, I also thought AAPL would underperform. The reason I thought AAPL would underperform the market, which it has, is that I think instead of the normal flocking of hedge funds, there's a realization this market is in real trouble and there's what I've been calling, "An every person for themselves" mentality.

In essence, I would describe this as FEAR, the hedge funds that normally would flock together are getting scared, scared that they may be holding on to some shares of some large positions like AAPL, scared that they won't be positioned for the crack in the market that every underlying and leading indicator is aggressively moving closer to. I'd compare it to being way out on a very thin ledge and not knowing if the next step is going to be the one that is the last.

With AAPL's earnings tonight, there's major event risk, even if they beat, it's all about perception. Perception is shaped by guidance and if you look at NFLX since after reporting last night, guidance gave the perception that no matter what NFLX reported, which was a revenue and earnings beat, second quarter guidance spooked the market.

I probably don't have to say it, but we've all seen stocks that beat and sometime beat huge and still get sold off hard or stocks that miss huge, but rally hard. Why? Guidance.

Earnings are not so much about what you did (except for retail-that's all they understand is the head line number), but what the perception is regarding what you will do moving forward. So even if AAPL posted it's biggest blowout quarter ever, the concern Wall Street has is, "Can they do better next quarter", which often makes blowout quarters a bearish event as the perception is, "This is as good as it gets, time to sell".

In any case, 3C is showing that trepidation, it is showing the hedge fund herd moving in all different directions in a sort of panic. We expected to see this at some point before the market cracked, but we still have tomorrow's F_O_M_C event, this is weighing on the market too. Should there be a dovish hint or even outright QE, the market will go nuts to the upside, should the policy statement be relatively unchanged, the market will kick and scream like a spoiled brat that they didn't get their QE candy.

Here's a look at the chaos in the market right now...

 I need to do an analysis of small cap, mid cap and large cap, I have suspected large cap would be coming under more pressure than the other two, so far we have seen several examples of that.

The DIA 1 min shows selling in to strength early, although the Dow was a bit ahead of itself, presumably on the repatriation effect on the EUR/$USD.  There's one leading positive spike in white, but this chart is really noisy, I wouldn't make any short term forecasts from here and I believe it is a reflection of the Fear and chaos among large funds.

 Moving to a 2 min which should have less noise, there's a relative positive divergence, this in my view is what the market wants, one more chance to sell and short in to some strength, on the other side of the coin, fear is fighting with that possibility.

 This 5 min chart in the Dow looks bad, it may be a reflection of large cap weakness/rotation out, there' a slight relative positive divergence that is being fed from the  2 min chart above.

 Looking at the same 5 min chart, just zoomed out to see the trend this looks bad. The last negative divergence like this to the left sent the market lower.

 The 15 min chart is barely positive, compare where 3C is now and where price is vs. the last white trendline, this is a slight leading positive divergence.

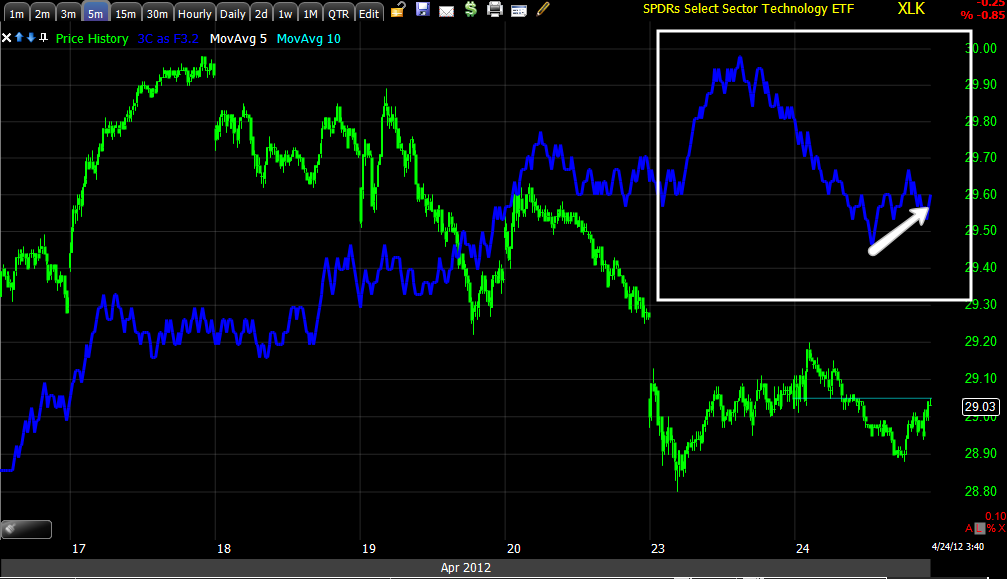
 QQQ has seen a lot of volatility today intraday, all strength yesterday seems to have been sold short term, this "could " be an effort to keep the Q's low in an accumulation range as mentioned yesterday. There is a positive divergence developing now.

 The 2 min chart shows the enthusiasm of the 23rd with a leading positive divergence early on in the day, some negative and now a relative positive. Overall the placement of 3C here is still in a leading positive position, despite the intraday jiggles. It really looked like tech wanted to rotate in and probably still does, NFLX didn't help though.

 Q 5 min has been in line, a small negative sending it lower and as I kind of suspect, it appears to be under accumulation near those lows. Of course smart money wants to buy as low as possible to make as much as possible and to mitigate risk. This accumulation though is ONLY short term, as in bounce.

 The QQQ 15 min is still holding up as the strongest 15 min chart.

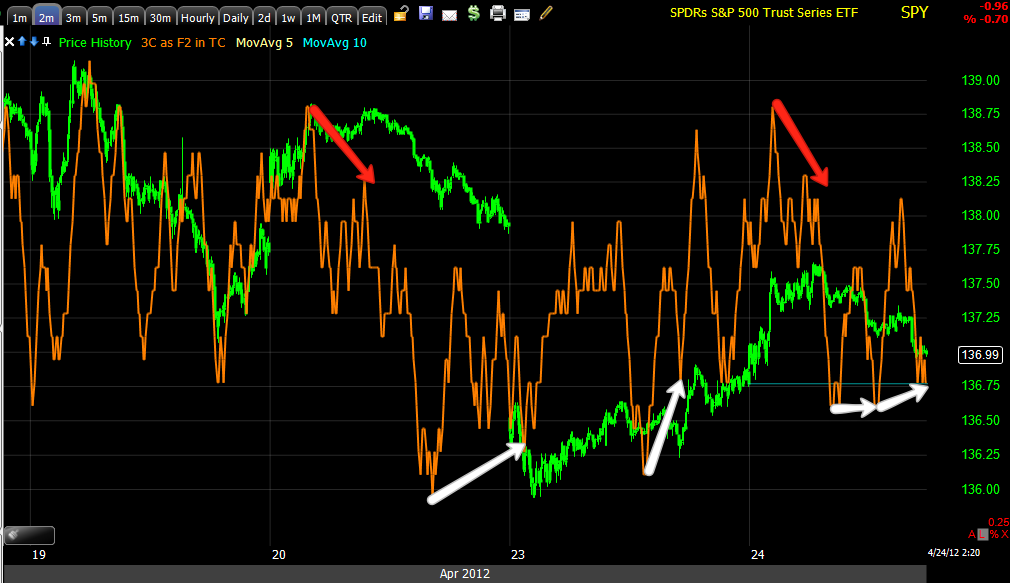
 SPY 1 min is very noisy , some small rounds of positive divergences and when the SPY moves up too high, distribution. Again, this would fall in line with the need to accumulate as low as possible, especially with all of the event risk today after market and tomorrow round noon.

 The 2 min chart shows more or less the same thing, it's a bit less chaotic.

 This 5 min is kind of out of nowhere, there was good confirmation here and since a leading negative bringing the SPY back down. Again, this could still very well be the attempt to buy as low as possible to get a bounce moving without taking significant risk.

 The 15 min chart is slightly more positive than the DIA 15 min, again note the relative areas marked with white trendlines, price is lower than the 20th, 3C is a bit higher.

 ES shows strength being sold at every opportunity, but 3C ES seems to work different than on the averages, we tend to see persistent negative divergences that ES can still climb in to, but this only happens when we have price strength that is being sold, this would make the 4th time we have seen this, the last 3 times were on legitimate bounces that failed.

The CONTEXT model is showing ES lagging behind the underlying fundamental risk assets that make up the model, translation: CONTEXT says ES has room and the conditions to move higher in the near term.

These changes in 3C are showing the chaos behind the scenes, the flock dispersing and that only happens when they are scared. It is my plan to use any strength, even if it comes on a dovish F_O_M_C statement that send the market 4% higher in a day, to short in to. The only way I would not short in to that strength is if the F_O_M_C makes a clear statement about additional easing. I don't expect that with gas and food inflation running high, but you never know what they will say or do.

As always, watch out for the initial knee jerk reaction to an F_O_M_C statement, it tends to reverse within 30 minutes to a day or so.

Bottom line: There are changes in character in 3C/the underlying trends, they look very fearful.


CMG Chart Request

I found CMG an interesting stock and I think there are some concepts and lessons that can be learned from it, maybe eve a trade.

I haven't had time to find out what happened or what the catalyst was in CMG, but whatever it was, it was known in advance.

 First a weekly chart, this qualifies as a parabolic move, the lack of pullbacks/corrections through 2012 is disturbing (much like the broader market through the same time period. Any healthy move should see the excesses wrung out with consolidations and pullbacks, when they are absent, it's almost like a stream pressure cooker, something eventually goes wrong pretty big.

 On a daily chart, here's the linear regression channel, CMG popping out of the top side of that channel always looks bullish, it rarely is. A change in character is always something to take note of and when that change is a big increase in volatility, you can't rule out a blow-off move.

 Since 2012, look how linear the uptrend has been, virtually no corrections at all, the break through the upside of the channel itself was a volatile move that should be concerning to CMG longs, unfortunately they just see price percentage gains and tend not to look at what the change in character actally means. If you look close, CMG is VERY similar to the market during the same period moving up, very small, but very consistent days up, note in April how much bigger the daily ATR became, you can see it clearly by looking at the size of the daily candles/range when comparing February/March to April. When volatility increases, it is usually a sign of a top. For example, most of you who have been trading for a while will probably have some vivid memories of this period in the NASDAQ 100.

This is the tech bubble, I've color coded the risk by way of volatility and as you can see, increasing volatility is rarely noticed at the time, it's always "This time is different", but changes and huge increases in volatility are very dangerous, we are living through an increasingly volatile market right now. I'm not saying you shouldn't ride the ride, I'm saying you should be aware of your surroundings and know when it's time to start taking profits and reducing risk.

 On the daily chart (remember divergences flow from the shortest timeframes to the longest if they are strong enough), there's a relative negative divergence right as CMG was breaking out of the linear regression channel. For a divergence to make it to a daily chart, it's already pretty well established. Also note Stochastics, which I use the opposite of everyone else, I use a longer period and while they are embedded, I do not view this as overbought, although it is (there's no level in which you can identify "too overbought"), I view it as strength and have designed trading systems to stay long so long as the longer term Stochastics stay embedded, the first sign of a negative divergence in Stoch. and it's time to close the trade, if you look closely, Stoch. went to a negative divergence right at the very top.

 The 60 min chart shows confirmation in 3C as it makes a series of higher highs with price, then we see the first signs of distribution in a rather weak relative negative divergence, by the time it turned in to a leading negative divergence, that party was over and it was time to be out of CMG, but this should give you some idea of how Wall Street distributes, they sell in to strength, by the time it is leading negative, they are likely already short the stock.

 As the shorter timeframes feed the longer ones, the intensity of the negative divergence can be sen on this 30 min chart, whatever the catalyst was in CMG, Wall Street was moving out of the position, selling in to strength months before.

To short CMG here is to chase it, it may give you some decent gains over the next couple of days, but the risk of a snap back move is too great for me to want to even consider shorting it right now, I want to short it on the snap back move. The 2 min chart which has been in line with the downtrend is just starting to show some short term positive divergences, these are probably the start of what will be a snap back move and with volatility high, I would expect a pretty strong move.

As for potential targets...

 With the break of the 50-day today, shorts are in place, it's a decent time to start looking for that snap back move. The 10-day moving average is a typical area to watch, so the $425 area would offer a better entry with much less risk.

The Trend Channel held the entire move, you can see where the trend broke at the red arrow, the Trend Channel would also suggest a target area somewhere between $425 and $430.

I would let the trade come to you, just make sure to set some price alerts so if it doe, you don't miss the opportunity.