Thursday, May 22, 2014

A FEW EOD CHARTS

Last Friday in laying out some probabilities for this week in the post, Market Update and Some Probabilities I had said...

"Now that we are getting more data in since we saw the first positive divegrence yesterday after the move lower, we are starting to get a few possible scenarios , which I like to try to put out there as it may help you with closing or opening certain positions, whether they be short term option trades or core positions entries/exits....If" this were a real bear flag, I would not expect to see positive divergences in to its formation, I'd expect to see distribution in to the correction to the upside, thus the case for a head fake move above the bear flag just got stronger."

and...

"the point here would be, the appearance of a bear flag alone suggests a high probability of a head fake move which would be to breakout to the upside first, however while they can manipulate short term trading action, they can't hold the manipulation long, there's a reason there's a bear flag forming and that's because of the strong sell off of the preceding couple of days, that trend almost always re-emrgers despite a head fake move, thus they are excellent to use as entries, in this case we'd short in to the head fake breakout above the bear flag."

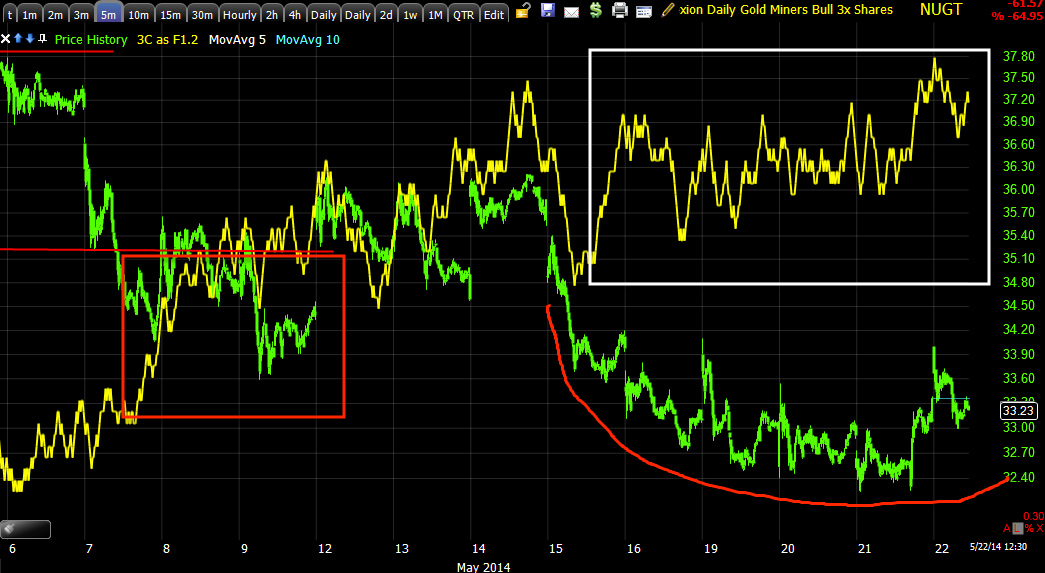
I was talking about this area...
The probabilities as of Friday afternoon were lining up for a move ABOVE the bear flag for this week, this isn't a long range forecast, it's really still noise within the multi-month range/top, but still movement.

Also from the same post last Friday...Market Update and Some Probabilities continues...

"this is also introducing a slightly more complicated head fake pattern that is more effective....the "slightly more complicated head fake move", still puts the emphasis on the upside breakout of the bearish price pattern (Bear Flag)...The concept would be a Crazy Ivan Shakeout...A Crazy Ivan Shakeout will shakeout both sides of a price pattern...So the Crazy Ivan would look as I've drawn it above, a bear trap first on a downside break down which is what I suspect the 1-3 min charts recent weakness is depicting and then a breakout to the upside, which is why I think the larger 5 min positives haven't moved negative as this is the direction expected ultimately for the head fake move, allowing them to short price strength and more demand/volume before price naturally falls back down."

We didn't get the EXACT move imagined, but we did get all of the elements...
We first got a breakout above the flag, when this happens (unexpected breakout for the bearish price pattern), technical traders are taught to reverse their positions and go with the breakout, at 2 the move below the breakout point is where stops are typically placed, this forms the Crazy Ivan Shakeout, both sides of the flag were hit, THE ENTIRE POINT OF A CRAZY IVAN IS TO CREATE MOMENTUM, note the momentum increase at #3, but ultimately as was posted Friday...

"while they can manipulate short term trading action, they can't hold the manipulation long, there's a reason there's a bear flag forming and that's because of the strong sell off of the preceding couple of days, that trend almost always re-emrgers despite a head fake move, thus they are excellent to use as entries, in this case we'd short in to the head fake breakout above the bear flag."

You've already seen the charts today and Leading Indicators in Definitive Change in CharacterSPY Arb, USD/JPY, VIX FuturesTBT / TLT Follow Up and SPY Arbitrage and Market is Losing It's Levers

Beyond the charts there, in to the close we got...
SPY (red) vs VIX (green) note the end of day action and recall the 3C charts for VXX/UVXY posted, VIX closed up +.76%, a far cry from yesterday's -8.10% and even the red VIX just before the close.

As for the charts for the averages...
 IWM 2 min

IWM 3 min

IWM 10 min

Most of the positives from last week only went out to 5 mins, as far as forecasting the upside move above the bear flag...

QQQ 2 min

QQQ 3 min

QQQ 5 min

SPY 2 min

SPY 3 min

SPY 5 min...

THE POINT IS, THE MOVES WE FORECASTED LAST WEEK WERE FOR 1 PURPOSE, THE BEAR FLAG WAS THERE FOR A PURPOSE, THE CRAZY IVAN SHAKEOUT WAS THERE FOR A PURPOSE AND THAT WAS UPSIDE MOMENTUM THAT COULD BE SOLD/SHORTED IN TO... 

I THINK WE ARE AT THE LEDGE OF FULFILLING THAT PURPOSE.


TBT / TLT Follow Up and SPY Arbitrage

As mentioned in the last post, it's pretty clear from relative performance and the normal correlations that the VIX is not going to be pushed around much more, I suspect from the 3C charts that it's actual demand (it's a bit rare to see actual supply/demand dynamics in the market, at least since 2009), but fear will do that and the level of complacency in the market, well I'd think it's generating some fear, especially these moves since the F_O_M_C minutes and their volume.

 The VIX was down -8.10% yesterday and -0.92% today, not at all the same bullying of the VIX or "Monkey Hammering", but that was evident in the earlier SPY Arb, USD/JPY, VIX Futures post today as the VXX correlation vs the SPX was clearly not giving up the ground.

Therefore TLT and HYG was used, but seeing some initial moves in TLT makes me think that this lever is shot , at least near term and the HYG 15 min charts from this week tell me that one doesn't have much left in it (then there's USD/JPY).

So I closed the TBT (UltraShort 20+ year bond / TLT).


This basically came in about break-even...

 TBT has been working pretty well for us the last 6-days, but it is nearing resistance. It's not that I don't like TBT, it's not that I don't think something is going on with TLT that should send it lower, whether to base or perhaps the normal "Flight to Safety" properties of TLT have changed as the F_E_D pulls out of its bond buying and China and Russia are obviously not going to pick up the slack, if anything they'll create more slack so we'll have to see what TLT looks like on the way down which I do believe is coming.

 TLT 3 min showing positive divergences early and suggesting the TLT manipulation or use as a lever to ramp the market is no longer dependable.

Remember the typical F_E_D knee-jerk reaction usually lasts between 2 hours and 2-days (although this one seems clearly engineered, not true knee-jerk) as there really was nothing of consequence in the minutes.

 TBT gave us good reason to go long as a trade which it was with a nice positive divegrence, but the 5 min chart there is going negative which means the TLT 5 min chart...

Should be positive to confirm which it is. That's enough for me to close out the TBT trading position for now.

However, as I said in the close out post, Closing TBT (long) For now, I'll likely be back, this is but one reason.
 TBT 60 min large positive and...

TLT 60 min large negative. Again, what the dynamics are at this point are unknown, whether TLT will pullback to the base area around $102 and be a great long (which should show good positive divergences on the pullback) or whether there's real concern that there won't be demand for Treasuries (in which case a TLT pullback will not show positive divergences/accumulation), either way it allows us to enter the trade with the knowledge of which way it's going by the time it gets there.

 Even intermediate charts make TBT look like a good long, 15 min positive with...

TLT 15 min negative confirmation, however, the near term charts suggest that this trade is probably a bit off if TLT is going to regain some "Flight to Safety" strength. VXX is showing signs of the same.


 HYG's 15 min leading negative divegrence, there's something going on here, I doubt HYG will be able to hold up as a ramping lever with trouble like this brewing and intraday...

HYG is showing near term trouble on its ramp today, along with TLT and VIX sitting it all out, this doesn't look particularly good for the market.

 At least yesterday's TICK data was strong as there was a short squeeze and that boosted intraday breadth, today since the noon time we've been in a VERY shallow +750 to -500 range with a 3:05 shot down to -1100 which is out of character for the day, that -1100 stock decline on that bar was right here on the SPY...

SPY- 1100 TICK reading.

And as mentioned, VXX/UVXY are showing clear demand today...
 VXX 1 min

UVXY 2 min

VXX 3 min

As I said, it looks like the VIX isn't giving up anymore ground and it looks like it's due to real demand or put another way, real fear.

Market is Losing It's Levers

I wouldn't be surprised to see some downside in to the close.

I'll be following up on the TBT position just closed, but if you think about the post previous to that, SPY Arb, USD/JPY, VIX Futures you may recall that VIX is not allowing the market any more room to ramp it so the honors went over to the 2 of 3 components in the full lever, "SPY Arbitrage", HYG up and TLT down.

Considering TBT (long) is the opposite of TLT with 2x leverage, the fact I felt I needed to close TBT tells you something about TLT's probability as a ramping asset and we already know HYG has massive damage and the USD/JPY is simply loitering with damage in the $USD.

Throw on top of that, the earlier post...Definitive Change in Character and we have some changes in the market.

There are several positions I'd like to open, although tomorrow is an op-ex Friday, which typically means we don't get a whole lot of movement, so unless I can't pass the chart by for another minute, I'd rather either wait for tomorrow after 2 p.m. as the op-ex max pain pin is lifted or Monday, for options (again unless there's absolutely no time), I'd prefer Monday.

Post with charts on the way, I just wanted you to know about the market in to the close as TLT is giving out as a ramping asset.

Closing TBT (long) For now

I'll be back, I'll cover the charts in the follow up.

Almost Forgot...

After the market came down earlier this week on the 5 min Index futures negative divergences and moved close to in line (not positive), I wondered what the 5 min charts in Index futures would look like, I have an answer today...

Russell 2000 futures 5 min chart.
TF 5 min in leading negative position.

SPY Arb, USD/JPY, VIX Futures

The significant weakness in HYG 15 min charts from the previous 2-days is still there, however it seems the VIX can't be pushed much more as a market lifting lever, the 3 assets used in the SPY arbitrage to lift the market would be VXX (down) , HYG (up) and TLT (down).

Today it looks pretty clear VIX has taken about all it's going to take and as a result what I suspect is a knee jerk reaction from the uninteresting minutes largely fueled by a low volume short squeeze is not enough and with the VIX holding its ground and not seeing the same monkey hammering, HYG and TLT were used in today's ramp-a-palooza.

 SPY (price inverted in green) shows the VXX correlation is stronger than normal today, it's not being used for the typical ramp that we saw for instance, yesterday.

However, although it's not nearly in line, all HYG needs to do to trigger algos is move up, the 15 min leading negative doesn't inspire much confidence in its ability to stay up.


And TLT vs the SPY intraday is severely underperforming, between HYG up and TLT down below its correlation, you have 2/3rds of the SPY arbitrage, a short term intraday manipulation lever.

As for the correlation with USD/JPY, when the carry cross broke all kinds of support 2-days ago and even before that, I warned, they like to "Loiter" for a few days in the area of broken support which is exactly what USD/JPY has done, but underlying weakness in the $USD may not allow that much longer.

USD/JPY (green/red) vs ES (purple) today intraday , quite a correlation there!

However the 5 min USD/JPY chart is negative and I see why...

This is the 1 min $USDX chart, this is telling, but 1 min charts don't hold up in the overnight futures market very often, so I trust the 5 min charts like the USD/JPY above which has a negative divegrence.

And the USD here, negative, thus the signals in the 5 min USD/JPY pair.

In other words they are running out of post F_O_M_C "knee-jerk" (although artificial) levers as HYG is in very bad shape as we saw the previous 2 days on 15 min charts, the VIX doesn't look like its going to take it anymore or more likely it's being picked up on the cheap. I'd be interested in a position there, I just want to be absolutely certain (as I can be) on the timing.

And of course the USD/JPY doesn't look like it will be able to hang in the area much longer as its typical 2-days of loitering are just about up as the $USD is flashing.

I may have separate TLT and VXX posts if I feel there's good timing/set ups for positions now.

GDX / NUGT Update

I'm so excited about this trade, it's almost like a kid at Christmas morning, but it's essential to be patient and enter at the right moment, even though I do have a half size position there that I'm dying to fill out.

In any case, yesterday we got some upward movement away from the rounding base, I kind of expected it from 3C signals in gold miners, but more importantly in Gold itself which GDX has a correlation with and seems to have followed it yesterday. The bottom line is I think everything is still fine and this  is one of the best examples of forward forecasting for a trade set up that not only comes to us on our terms, but has confirmed every move it has made along the way from a false breakout/head fake move that was expected to produce a fast move below the trading range, to the accumulation of GDX/NUGT below the trading range in a beautiful reversal process as well as the larger picture suggesting this is not just a trade, but more than likely a very serious trend.

This is the kind of edge I crave in trades while everyone else only sees price action and probably rather uninteresting price action at that.


 NUGT 1 min with a positive divegrence in to yesterday's minutes, essentially following GLD,

 2 min suggests NUGT not wander too far from the reversal pattern it's putting in.

 3 min shows EXACTLY what we want to see at a price formation like this, accumulation, that's what it was meant for, that's what we were forecasting as NUGT was still above the $38 area.

Usually there would be some sort of head fake move on a reversal pattern like this just before the actual reversal, if for nothing else, the bear trap it creates causes stronger upside momentum when the breakout comes.

 Again the 5 min chart waiting for the reversal pattern BELOW the range to begin before serious accumulation starts.


 10 min...

This is the head fake / False Breakout or failed breakout that we were forecasting to not only fail, but to create the downside momentum needed to break under the range where we expected GDX/NUGT to be accumulated.

The white arrow shows the accumulation below the range, EXACTLY what we were looking for and giving us excellent confirmation that NUGT will be a strong long trade.

The actual head fake above and what will ultimately become a head fake below, is a larger scaled version of a Crazy Ivan with the range acting as the price formation that defines the support/resistance levels.

Note the repair of the 10 min chart. While we were still showing a negative divergence at the false upside breakout, we were looking for the 10 and 15 minute charts to be repaired. The 10 min chart has now been completely repaired, we still have a little work on the 15 min.


 This the 15 min trend. There may be a much larger base pattern that I've talked about before and /or this Cup and Handle Bottom may be a part of it.

Note where the accumulation is, at the cup and the handle as it should be.

This is a closer view of the 15 min chart, it has a bit of work to do, but I'd say it's in line with the amount of time left in the base/reversal formation which I'd say is at least halfway completed. A head fake move in this rounding base pattern would be an ideal area to add or start a new long position as well as to look at call options. I'll set price alerts for a move below support of this rounding pattern.

 The 30 and 60 min charts have always been in good shape so it really has just been a matter of finishing up the handle portion of a much larger base and it looks like we are about there.

 60 min

And the major underlying trend of the base area on a 4 hour chart. The accumulation at the cup is fantastic, but the increased accumulation at the handle area is EXACTLY what is suppose to happen in this pattern, Technical analysis just assumes it to happen, here we can see it actually happening.

I see this as a trend trade, likely a primary trend or perhaps an intermediate trend, but a large trend trade and stage 2 is the easy money, that's the move we are looking to trade by entering a position very soon.

Definitive Change in Character

With the last several days of credit not playing along with stocks, it was obvious that beyond the low volume short squeezes, there is definitely something wrong, not just as far as probabilities go, but timing of them, HYG is one of those signals that has been screaming.

This morning there has been a lot of inline readings in the SPY while some others deteriorated, now the SPY is doing the same as a very narrow ascending wedge forms on low volume.


From a conceptual point of view, with the evidence we have, I think yesterday's post, Potential Market Scenario, High Yield Credit and Momo Stocks (TWTR) laid out the path of highest probabilities.

Here are some of the charts, I was torn whether to notate them or not because the change in character is so obvious I didn't want to lessen it by drawing on the charts so there are a few with and a few without.

 DIA with a VERY clear change in character which may be the most significant because it was one of the strongest underlying charts of all of the averages this week and part of last.


DIA 2 min

DIA 5 min

IWM 1 min, with a very definitive change in character, I didn't want to draw on this beauty at all.

 QQQ 1 min

QQQ 5 min

And the SPY has finally joined, note the delicate ascending wedge. I'd look for 3C to put in one more lower low before I expected serious movement.

SPY 2 min in to the wedge.

More charts coming...