Tuesday, December 18, 2012

Tuesday Chart Confirmation

Today we got what we were looking for, a break above resistance in the QQQ. I believe from this area we will see things turn negative and this will be a failed breakout or what we know as a purposeful head fake move.

I decided to take a couple of Long/Short ETF's for each of the averages and show you how consistent the signals are today-we are looking for market distribution overall in to this breakout so the longs should show distribution, the short or bear ETFs should should positive divergences/accumulation.

These are either 2x or 3x leveraged ETFs. Each average starts with the bear/short ETF which should see a positive divergence and followed by the bull/long version which for confirmation, should show a negative divergence.

Dow
 SDOW

UDOW

IWM
 SRTY

URTY

QQQ
 QID


 QLD

 SQQQ

TQQQ

SPY
 SPXU

UPRO

So above we have 4 different averages and 10 different ETFs, every one confirms the bearish distribution seen today above the QQQ breakout area. However we only see these signals out to about a 5 min chart, this bothered me earlier and is what kept me from entering new positions in any size today, we need solid confirmation signals and the highest probabilities to enter a trade, I'm glad we didn't and were patient as it was clear by the end of the day that they were going to close the QQQ's near their highs, draw in retail in the morning on a gap up and hopefully the real strong distribution will start in to that move which will give us a fantastic entry, edge and low risk.

The short term futures had to stay strong the last few days to make this move up in the QQQ, but once it was done, look at how they changed for the worse to negative divergences.

 ES (S&P Futures) 1 min

 ES futures 5 min clearly negative

 NASDAQ Futures 1 min, very negative as soon as the move in the QQQ was completed.

NQ 5 min is even worse with a leading negative divergence hitting a new low.

As for Leading Indications, High Yield Corp. Credit weakened during the afternoon as I hoped to see. FCT continued its negative divergence with its 3rd day lower vs the SPX move up. The $AUD is in a leading negative divergence, and the Euro is in line with the SPX, BUT DID NOT FOLLOW that last little ramp in to the close higher, which as I stated earlier, I believe is there for a very specific reason-look for a gap up in the a.m. Also there's lots of good signals suggesting distribution in the EUR/USD, which would send all risk assets lower, I took a small position in Energy Short today based on that.

Most notably was the intense High Yield Credit sell-off from 2:40 through the close as the SPX and market made that closing ramp, this is a great signal, in fact, here it is...
Look at that divergence between HY credit and the SPX (green), you really couldn't ask for better validation of the closing move in the market being total manipulation for a specific purpose, risk assets like HY credit wanted NOTHING to do with it.

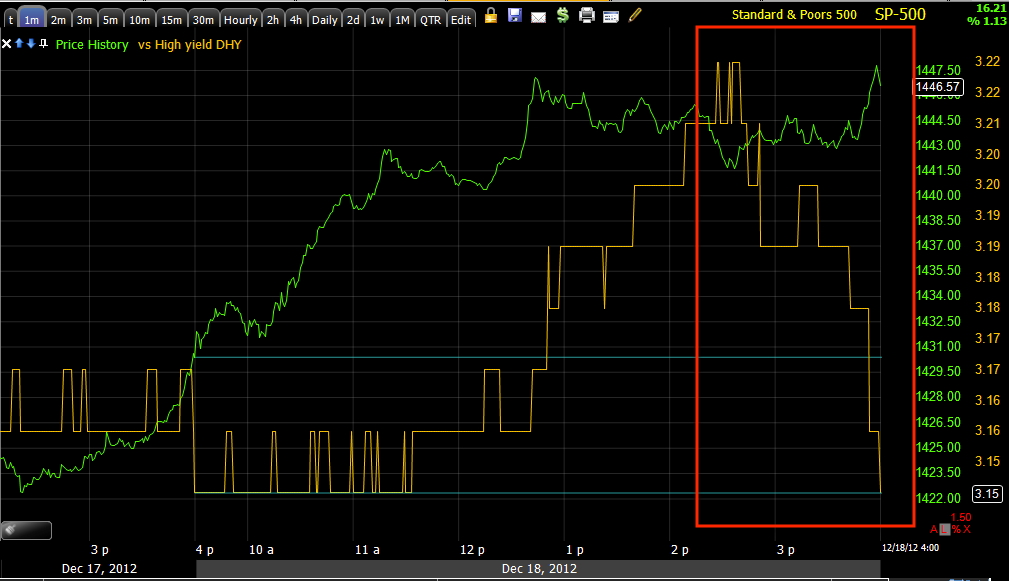
Even commodities underperformed and had a bit of a sell-off vs the market, I suspect this has to do with distribution in the EUR/USD which will pressure commodities.


Basically things are going exactly as planned, we'll enter some positions as we get a little stronger signals, the stronger the better.

I'm going to take a look at breadth tonight, if I see anything that stands out, I'll let you know, I expect it will confirm market weakness in the underlying tone which is what gives us our edge.


And We Have It

We have been expecting this move in the QQQ at least since late last week before there was any sign of a move coming, just because of market behavior, just because we know there's money up there that Wall St. doesn't want to leave on the table.

I thought about the day, how the IWM went down and I'll show you later afer a little break how the IWM went down and some charts that will surprise you, but will make a lot of sense at the same time.

Here's the Q's close...
This is exactly through the level we were looking for, volume is good so the same set up I described in the last post becomes a high probability now and this almost certainly explains why they weren't entering the inverse/short ETFs in size today, they were entering, but not in size because they know tomorrow they can get in at better prices. This is EXACTLY why I don't make  move until I se them make a move-as much as I wanted to today, the point if to follow smart money and making a move today and not showing patience is not using our edge.

Remember why I said they's go after this clear level of resistance? It's because traders are so predictable... part of my article from the weekend I started.


Do you think this 1 min volume spike as price passes the resistance level right where all the orders will be was coincidental?

So I'll post some interesting charts I've started gathering already after I take a quick break.


Close the Q's Strong

This is why I think we are just sitting up here on top of a parabolic move, take a look at the QQQ charts which has been our target for the market at least since last week when the resistance range became apparent.

 QQQ 2 min leading negative divergence

 5 min leading negative divergence-remember this was the timeframe that was positive earlier and the one we were waiting for?

 Q's are holding the 50-bar 5 min chart, commonly watched.

 If they can close the Q's strong and above that resistance range...

Then it's likely the same thing will happen as it did with the IWM, traders who work during the day will come home, see the breakout, place their limit orders and go to work, the market gaps up and sells off the next day, more flies in the web.

TLT-Flight To Safety

TLT is getting some momentum, you can compare to the earlier charts today that were just starting to show something.

 TLT 1 min

 2 min

 3 min

5 min

Earlier we only had a 1 min divergence which I said "Could" be an intraday move only, but I doubted it, I thought it was the first sign of a flight from risk assets to safety, as the charts have developed and reached out to the 5 min-way beyond intraday, I think it's clear, this is a flight out of risk and in to safety. It may not be complete, but it has good evidence for it occurring.

Opening Speculative ERY Long position

This is 3x bear Energy and it will be a speculative size for now which is 50% of a normal size position.

Closing ERX 3X Long Energy

This Happened Las Time Too-THIS MIGHT BE IT

The EUR/USD holding up well gave the market support a couple of weeks ago (maybe less) when everything else was flashing red, I'm 90% certain we have a negative divergence in the EUR/USD, that removes a leg of support from the market and hopefully aligns signals in the Inverse/Short ETFs

5 Min. Charts

I'm having a VERY hard time not pulling the trigger on additional shorts, if I didn't already have open short positions I'd be adding some now, phasing in to the trade.

Some charts are seeing worse migration like the SPY 10 and 15 min now and that's from today.

ES and NQ are both negative 1-5 min as well.

 DIA

 IWM

 QQQ

SPY

Volatility Indications

These have been pretty useful lately, calling the moves intraday on the last F_O_M_C, calling the move in the market here and right now the volatility ETFs like XIV, VXX and UVXY are all in a narrow, flat range which is where we most often see divergences, it's the dull market, "The kids are too quiet" effect.

Here are some charts showing volatility looks like it's getting ready for a downside move in the market (getting ready and there are 2 different things, but sometimes close enough is close enough).

 5 min VXX, a move up corresponds with a move down in the market and 3C is leading positive

 10 min leading positive

Even a 15 min leading positive, a larger relative positive and it just took out support today as well, stops cleared.

Action or No?

I'm sure some of you are wondering whether I'm taking some actions that I have not posted, I will always post any ideas or actions before they are executed.

The QQQ went exactly to the area I thought it would and this was before it even gave the first hint it would move up.

The 3C charts are deteriorating as I suspected they would in the area.

There are 2 small issues that I need to see resolved before I feel confident in calling this a high probability trade (more so in timing than anything), that is a few of the leading indicators need to deteriorate, Credit especially, also the Euro is lending support to the market, I believe we have a negative divergence on the EUR/USD so that may be resolved soon, and lastly, while the market averages are deteriorating, the short stocks or ETFs I like for this move (many of which are already in place), are not showing charts come together a fast as the market charts are coming apart so this is probably more an issue of timing right now, it's always an issue of getting the highest probabilities and sometimes we need to be patient.


UDOW Misprint-Actual Position Though-Closing

In this post I listed UDOW as a short position trade that is in effect, it actually was and still is a long 3x leveraged on the DOW-30 still open, however it will be closed shortly, ASAP actually.

AAPL Charts

As I mentioned this morning, I like AAPL longer term (not primary trend long term, I am very bearish long-long term), but something is going on in underlying trade in AAPL for several months.

However with the leverage of options, I have little to no patience with pullbacks, I'd rather exit the position and then re-enter it in a better environment. There's nothing worse than getting trapped in an options trade.

The charts, and I would have really preferred to hold the entire position, but some of the short term charts were deteriorating too quickly.

Any way, made a tiny little bit  there...


 1 min chart is short term, but that's ugly as 3C leads negative

 The 2 min chart's trend is much cleaner, no less ugly.

 This divergence hitting the 5 min chart is what really bothered me.

 Longer term, yes I'll be looking for a pullback and holding that 1 contract as this 10 min chart is still leading positive, I will be watching for that to change though,I don't think it will.

The 15 min since the 11/16 ramp up, the leading negative divergence, AAPL made the slight new low (shakeout).

We'll get to that bridge when we do

Taking 3/4 of AAPL Call Position Off the Table

I'll leave a little there, but I'd rather open a new position than it through a pullback with that leverage

MARKET UPDATE

Remember the 5 min chart being the barrier, it hasn't gone negative, well now it is, across the board so things are getting more serious.

I'll get charts up ASAP.

A Few Trades


As for the SQQQ open position (3x leveraged short the QQQ), there's room to add, but I'm not taking any action yet as the signals there are not strong enough.

UNG long is a longer term position, there's a tiny bit of room to add, I am not going to at the moment.

SPXU (3x leveraged short S&P-500) has about 25% more room to add, again I'm holding off there, I'm interested in a move <$35.95 there. Of course if signals improve rapidly then there will be a change in assessment.

AMZN short is full size, as I believe mentioned in the last update (yesterday I think), the $255 area is was a serious magnet for a move above, volume picked up for 10 minutes as that area was passed early this morning, since volume has fell off, I'm fine with holding AMZN, if I were looking for a new position or an add to, I'd wait for signals to turn on the short timeframes.

XLF was also covered recently with a magnet/target area of $16.40-$16.50, the actual position is FAZ, it has room to add at least 1/3 more. XLF has nearly identical signals as the SPY example posted just a short time ago, there's that 1 firewall that needs to break around the 5 min area, I'll wait for that to happen, probably both in the market and FAS/XLF before adding to FAZ, although it is very tempting, I think it's early or at least is not following the principles and guidelines I preach, so I need to practice what I preach.

I have a speculative VXX long position at a very reasonable loss, less than 0.50% of portfolio so that can be added to, but again, not yet.

There's an AMD long position, I like that one, I think it is working on a base and I see no reason to let go of it at this point.

BEAV short is one I don't have room to add, I have featured and updated the idea several times in the last week or so, If I could, I would initiate a partial position here or if I already had one I would consider adding to it depending on the size, I would ideally like to keep about 1/3 of the intended full position size unfilled in case there are slightly better entries, but if I liked the idea (which I do) and had no exposure, I would certainly not be afraid to start the position here.


UDOW  (3x leveraged short Dow-30) is another that I would consider starting a position here, maybe adding to, but I'd still like to leave a little room to add to it.

I'll try to get some more out to you, if I make any changesI will let you know BEFORE. Don't be surprised to see a quick change in opinion based on a quick change in signals.

Market Update-Action

I'm going to look at what 2 or 3x leveraged short ETFs that I have that I might add to or some that I might open new positions.

I think there's enough material deterioration to start adding CAUTIOUSLY and not SWING for the fences at this point.

Always keep your risk management in mind and position sizing. I prefer the 2-3x leveraged ETFs because the make the move down worthwhile, but they limit some of the risk of having too much leverage in Call positions, although if I see the right signals I may consider some speculative calls as well.

For those a little more conservative there's always the ability to short a non-leveraged product. I just think we are getting parabolic, the 3C tone has changed, it's probably a decent, fairly low risk area to look at adding some positions here. I do want to keep a little balance and longs that I like will stay in place, I'll be reviewing those as well to make sure there's nothing terribly wrong with them.

TICK data vs the SPY, note the earlier high in the SPY with TICK hitting +1300, then higher highs with TICK falling at each to the +750 area, intraday breadth is giving way.


 ES 1 min negative divergence, but more importantly..

 The 5 min that has been positive or in line as the market needed support to make these moves is now turning clearly negative in to these nearly parabolic price moves.

 NASDAQ 1 min futures also negative intraday

And the 5 min is certainly changing character for the worse.

Market Update

* I may be a bit slow on emails because there's so much happening so fast that I can't really take my eyes of the screen for more than a minute.


I'm going to use the SPY as an example, but it is fairly representative on all of the market averages and the situation.

Short term the market looks like it's prepared to come down a bit from here, we are still pretty early in the day though so I can't rule out choppy volatility.

Try to envision the following charts in this manner, the long term charts like 15, 30, 60 are the most important, the highest probability, they show what the big picture and health of the market looks like, these are negative. Short term charts have been positive recently to hit these targets in the IWM and QQQ, but they are starting to deteriorate, they will start to deteriorate at the fastest timeframe like 1 min first and then if it is strong enough they move to negative 2, 3, 5, 10 min charts. The long term is already set in place, so when the short term charts deteriorate, they kind of meet in the middle and it's like a two part epoxy (the long term side and the short term side) meet up and mix and create the effect or activate.

 SPY 1 min leading negative intraday

 That has migrated across and to the 3 min chart so the divergence appears to be real, it appears to be strong and perhaps getting stronger as the target has at least been met in the QQQ.

 The 5 min chart is still in line with price which it has had to be in recent days to keep the market moving up, eventually I suspect the 3 min chart will deteriorate enough that it will effect the 5 min chart and then we are pretty close to extremely high downside probabilities.

 The 10 min chart was already established as negative, it doesn't need to go more negative, but if the 5 min goes very negative then the next timeframe, 10 min should get worse. The 3 min is like the one side headed to the right and  the 10 min chart and those above are like those heading to the left, the 5 min is the only thin wall separating them and when they clash in to each other, we have high probability downside move that we have ultimately been expecting.


 SPY 15 min in leading negative position, it did move in line with the market, but has stayed in leading negative position.

The 30 min chart's leading negative divergence, none of the recent accumulation needed to send the market to the targets on the upside made it to these longer term charts, at best they moved in confirmation of price, they did not go positive.

I didn't include the 60 min because it is redundant.

I can't be sure how intraday trade and the QQQ break above resistance play out technically, whether it's a fast change and reversal to the downside or whether the Q's spend a couple of days in the area, I just know that with the way things are developing, the gut feeling i had that a reversal would be very quick is supported by these charts so far.