Friday, June 21, 2013

Another Update

After posting that, I see a 1 min relative negative in all 4 averages, it's small, not anything that is of strategic importance, but it will either cause a lateral consolidation or a pullback.

Here's an example.
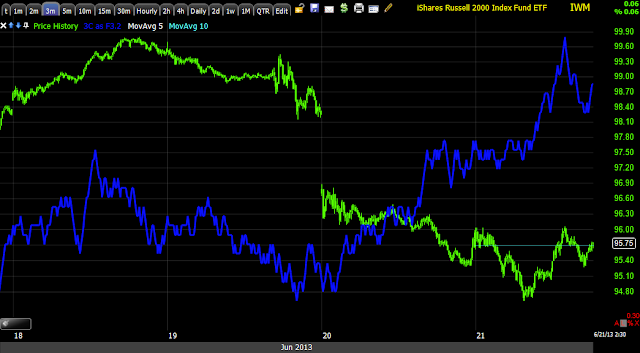
 IWM 1 min, there it is to the far right.

This is the same IWM 1 min chart zoomed out to proportion.

Update

I'm just going to flip templates real quick so I thought I'd just quickly show some of the faster moving divergences today in the 4 major averages.

*Notice the market didn't make a higher high until after 3 p.m., this is just something I notice on op-ex Fridays. My broker would always call around 2 p.m. and ask, "What do you want to do with these" and if I didn't do anything, again between 3 and 3:30.

 SPY with a large relative (notice I said large, not long) positive divergence that turned to a leading that is hitting new highs.

 QQQ 5 min also with a large relative positive divergence followed as is usually the case by a leading positive that is just at a new high.

 IWM 10 min with a nice leading positive, it won't be at a new leading high as it's a longer timeframe, the strength is in the timeframe.

DIA 5 min relative to leading positive to an easy new high.

Quiet markets like this always keep me on my toes, although I suspect not too much will happen before the close, I often equate quiet markets with "The kids in the room next door being a little too quiet", You Know They Are Up To Something!

These markets are easy to let your guard down.

Market Update

That last post with the Inverse H&S I drew was pretty right on the spot, this isn't because I have any evidence to forecast it or it was just a guess (it was of course), but as I said in the post, it's just common price patterns that traders are use to seeing, in this way many times they are led around by the nose as these familiar patterns are used against them.

The charts...
 This intraday chart is inline, the first higher peak has 3C higher, the second lower one has 3C lower, as long as it isn't leading lower, it's in line or price/trend confirmation.

The 3 min is leading as is the 1 min, but I had to zoom in closer for you to see the inline status.

What I was going to say was, the current 3C reading to the far right hasn't turned down which would have put it "In line " as well and I was going to say, "I'll be watching to see what it does". Well it has moved right up to the previous peak's 3C reading, dead even with it which is a stronger signal as price in lower at the most recent peak and it still hasn't locked in meaning it's still heading up.

 QQQ 5 min leading positive also with an open ended 3C current reading like the one above. If you just step back and look at the chart it tells you or shows you a lot about how underlying trade works or "accumulation/distribution".

And the 10 min QQQ, again it's a longer timeframe, this more important, but they never look as sharp, however the longer the timeframe, the larger the underlying signal is.

IWM 1 min looks perfectly in line zoomed in intraday, now look at the same chart in perspective.

IWM 1 min, this also tells you a lot about underlying trade, very often in a flat or range bound area or in a quiet area.

 IWM 2 min also in line, but when zoomed to perspective below...

IWM 2 min

IWM 10 min, this represents the larger view, the bigger move. It takes time for smart money or any large player to move things around, this shows the process and again, the longer the timeframe, the larger the underlying movement.

**CORRECTION

Earlier I mentioned USO long and talked about ERY as a long play on that, it is ERX that is the long play on USO long or rather more specifically ENERGY Long.

Not Short. My mistake.

Here's a link to the original post with the correction on top.


Tactical

This is what I meant by the last post, typically first resistance/support intraday is the former close, then high/low and open.

 You can see a faint light blue line at yesterday's close, that's first resistance, it's not uncommon for price to back off that area, it use to be for real reasons of support and demand, now it seems much more psychological and dogmatic as that is what technical traders expect so they can be lead around by the nose.

I might as well point it out before I get an email (or maybe I already did), there's always a possibility of forming an inverse H&S base, this is actually a complex version with 2 sets of shoulders and essentially two heads.

I can't guess at the probability of such right now until/unless I see charts suggesting that as a probability, as of now the 1 min chart  which is the fastest, easiest to move, didn't even stutter step on the initial pullback from the resistance area.

Tactical Positioning

If you are considering a position and might be looking for a pullback, we are approaching SPX resistance at yesterday's close, if there's a pullback it will likely start right in this area.

However, the charts for the SPX look like it will (likely after a consolidation) punch through that resistance.

Correction*** ERX or Energy Long

**FIRST BELOW IS THE ORIGINAL POST, IF YOUY READ IT I WAS OBVIOUSLY LOOKING AT ERY (3X BEAR ENERGY ETF) AND LOOKING FOR A MOVE TO THE DOWNSIDE.  The proper way to play a move down in ERY is long ERX, long Energy, not short.

There was a USO call a few posts before this, that is a long position. Granted Energy and Oil are different although correlated, but this was a mistake. Thank you Rose*****


This was a put position yesterday I believe (XLE) , ERY still looks like a decent long (3x bear energy ETF).

 3 min intraday slipped badly and fast.

5 min trend is clear and there should be a decent move at least below the recent lows, I'd think quite a bit more.

An ETF like this is often a better choice as far as "getting a good deal" as the premiums on options are typically too high once the move has already started, this is why I like to enter them when they still are going against the intended trade as they are much cheaper, but timing is always an issue because you want to be close to the reversal, but still able to take advantage of the momentum that discounts the premium.

SLV

SLV looks to have just as good a chance (long) here as GLD for the time being, again I think the time for an option position (call) was yesterday, I'd prefer SLV or a 2x leverage long ETF which I think makes the most sense from where we are.


USO Gap = First Target

I don't try to ride a trend with an option or large leverage, that's why core short positions use no leverage except in rare circumstances.

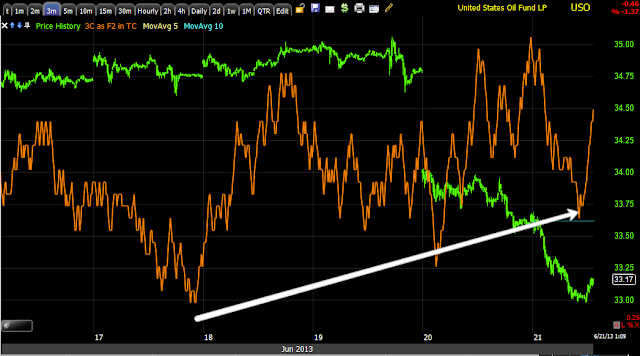
 USO 2 min-intraday timing.


USO 3 min trend, I'd look at least for the gap to be filled.

Went With USO July (20th) $32.50 Call

Charts on their way

Going With a USO $30- $33 Call- July

I'm not sure which, I need to move fast. I think USO long is also possible, although I'd prefer at least 2x long leverage crude.

Gold / GLD

I still like GLD here, I think the time for a call position was yesterday, but maybe GLD long or a 2x long ETF.

I'd be a little more nimble with GLD than the overall market or market correlated assets.

GLD 3m

VXX

VXX or UVXY Puts or short still looks good here. XIV is an ETF with no leverage that cam be bought long, it really doesn't need much leverage as the moves in volatility are pretty strong.

For a new position or even an add to... MCP

MCP is at a great discount today, the stock has strong signals, it should use the market as a primer, but after that it doesn't need it, this isn't a position that needs to draft the market, it has its own internal gas tank built in and ready to go.

Quick Update

If you have any intension of taking any positions (such as the ones we have already opened the last few days) I do believe this reversal to the upside will be less process and more event, the process has already been put in.

Update & Retail's View

First I was getting ready to update HYG again, because there's a concept there about the larger move expected and the shorter term timing factor, I'm still not sure what this washout move this morning was about, but treasuries seem to have been connected as it came right as POMO ended this morning-again 180 degrees opposite from conventional wisdom over the last 4 years...

HYG alone would be interesting, right now it is more than interesting, it's actionable and adding VXX to the mix is what makes it so.

This is exceptionally rare to see a price move like that and no move in VIX futures, NO REACH FOR PROTECTION, NO REACH TO RIDE THE DOWNSIDE MOVE, TRADERS (PROS) ARE APPARENTLY READY FOR SOMETHING ELSE.

But first an email I just got as I was putting this post together.

"Hi Brandt,

You know it's amazing I see hundreds of tweets a day and no one ever mentions HYG, currencies etc, they are all focused only on price the the traditional moving averages, cross overs etc."

If you know me and what we are trying to do here, then this statement above should be enlightening with regard to why and how Technical Analysis is so easy to turn on retail and why price action and thus emotions can be so very deceptive.

HYG, currencies, VIX Futures, Futures in general are the things that move the market, not "ISM beat today" as CNBC would have you believe. 

In any case, this is where we find our clues and answers, lets take another look...
 This is a 60 min chart, as mentioned earlier in the week, these don't look visually as impressive as shorter timeframes, but they are much more powerful in reality, this is a 60 min leading positive divergence in an institutional RISK On asset, as I said it takes these large funds time to gather up their position and that is why events like reversals are a process and not an event.

This tells us smart money is prepared for a big move to the upside.

The shorter term is not only acting better than price which any one who knew to look at HYG would automatically have an edge, but the short term divergence is less of a trend assessment and more of a timing assessment, so it looks good.

 Because the 3 most important SPY arbitrage assets are HYG, TLT and VXX, it's crucial to keep an eye on them. HYG is telling us there's a large upside move to go and both relative price action and 3C short term action tell us we are at a pivot point.

VXX is used as confirmation in this case, again with the market slipping as fast and hard as it did this morning, NO ONE WAS SCARED AND BID UP VIX FUTURES? No one wanted to make money on riding VIX futures higher?

Because VXX has an inverse relationship with the SPX...

VXX in Green / PSX in red. This is why I added a VXX put yesterday because I expect the SPX to make a strong move higher, thus VXX lower.

This 60 min chart clear;y shows the inverse relationship between the two, but if you look even at this 60 min chart (it is more apparent on a 15 min) you can see that the VXX has not responded in kind or proportionately to the move in the SPX.

Why? Supply and demand. VXX didn't move higher today because there is more supply than demand and there would only be one reason for that, smart money has the answer, but they are unwittingly sharing it with you if you know what to look for.


ES Holding Well

I wanted to get this chart out quickly in case anyone has tactical positions they need to execute

Core Short Positions

My main concern or interest is the core positions, almost all short, that we have been building.

While they are not complete, I do think we get a chance to complete them, I've been adding here and there when signals were right such as AMZN last week above the $282.50 level which we waited a long time for.

While we spend a lot of time trading in and out of short or swing trade timeframes (usually shorter), the ability to build these core or larger positions is because they can withstand some volatility, this is why I chose not to use leverage.

In any case with a move like today or this week, we can see we are on the right track, we have picked some good positions.

Our Equity (Core positions) Tracking Portfolio is at a rank of

#57 of just under 1600,  but more importantly is the performance vs the SPX, so far we are significantly outperforming the SPX so this tells me we are in the right assets and looking at the right assets. 

I don't expect this to hold right now in the near term, but I can now see these positions are in the right places.

Our biggest winner so far with no leverage is IOC (SHORT) at nearly 19%

This is the big picture, there are positions to add and positions to fill out, I'm VERY confident we'll have that opportunity whether you want to add to/ fill out or initiate new positions.

It won't be easy, it will likely be shorting in to the opposite of buying in to this market, but when the signals are there, we'll be fine as you can see we have been.

The trick in my view is to not use leverage and to not use ETFs, use real equity shorts (there are exceptions of course), this is one of the main reasons, the other is these positions can be put together and maintained through this volatility without all that leverage creating problems, these are the more relaxing trending trades when we reach that point.

When you have time, try to read this article I wrote, this will show you the advantage of shorting an equity rather than using a short/bear ETF (there are times for that).

Making More Than 100% on a Short

This is what all of our large picture analysis has been about, this is where the ultimate, real trade is and where the chance to really make money is.

Financials ...

Are among the first to flatten out, XLF, a better example is GS. This will probably hit the SPY first as the SPX has around 22% financial representation.

 GS- Goldman  Sachs Flattening out this a.m.

XLF with a broader view.


Another Hint... HYG

This one you could probably see for yourselves just using price, 3C adds another dimension though.

Price relative performance of High Yield Credit is far superior to the market, that is an obvious hint you can see without an indicator, most people just don't know to look at HYG.

Secondly that move in HYG was accumulated.

I'll bring you more, this seems to be somehow connected to Treasury Yields or they are part of the mechanics of the move.

NYSE TICK Should Be Open

This is one of the tools that is very useful right now.

This looks like a retail capitulation or momentum player move, the TICK just hit extreme levels, smart money doesn't typically sell in to this environment, in fact it's the opposite.

However the TICK trendline will be one of the first clues.

It's not as steep, it's more volatile and hit a deeper extreme, -1500 is an extreme for the TICK.

ES is holding up well. I think this will be revealed shortly as either a momentum trap or stop run, I'd think a momentum trap is more likely.

VXX is that One the Crowd Missed

Right now, the talk is yields are driving the market lower, however something very extraordinary is happening, when traders(smart money) are scared or need protection or expect downside, VIX futures are bid, however the Short term VIX futures haven't moved up at all. Not normal.

 The intraday 1 min of VXX, short term VIX futures. Note they are no higher than yesterday.


Here is the VXX in green vs the SPX with a trendline between yesterday and today, why aren't VIX Futures being bid here? These are usually the clues or messages of the market.

We'll see very soon.

Index Futures

The same behavior is apparent in the Index futures, this would be the first time since there was a negative divergence around 6 a.m., I believe to bring the market close to the "Max Pain"  pin. Typically Thursday's close very close to the Pin level, since the Index futures were set for a gap up around 6 a.m. and above the apparent max pain pin lever, it seems fairly obvious that the negative divergence at 6 a.m. when volume is low and the market is still easy to move, was all about the pin as we went from a gap up area to just about the exact same area as yesterday's close.

 ES 1 min with a negative at 6 a.m. or so to bring the market back down to yesterday's close, but again the important part is that the same behavior is apparent here in futures just like the averages.

Again the same theme in NQ.

So far TF is just in line, not negative, just in line.

Market Update

This is what I'm seeing thus far as we are starting to exit a.m. trade,

 Today again the lows are seeing positive divergences or being accumulated as seen above in the SPY, they don't buy the highs, they let out a little supply and bring prices to VWAP or a dip, the same way we want to buy near the lows.

The same is apparent in the QQQ this morning too.

This is a wider view of the IWM, the trend is stronger divergences at better prices, but the important thing is that it is carrying on this morning even though I think the main price objective is options expiration max-pain pinning or price.

The same chart of the IWM above, just with a wider view.

I'll bring some more shortly, but it was important for me to see how underlying action was reacting during a pullback, but out of a.m. trade where it's very noisy.

Pre-Market

Last night the Nikkei started off well and ended "fairly well", considering volatility, up +1.7%. Directionally there was movement with the USD/JPY and it must have had some influence, to what degree is something I'll be looking at closer, it doesn't look like a very high degree just eyeballing it.


The overnight Chinese liquidity situation (SHIBOR rate)  among their banks was better,  the rumor is it was not a PBoC cash injection, but a targeted bailout of 1 (and probably more than 1) bank with 50 billion CNY which China of course denies.

Greece is about to enter the third ring of hell, but I think I'll save that for this weekend.

I think probably the most immediately significant event for today will likely be the typical Friday op-ex peg, if so that may explain why Equity Indices backed off a bit after the European open, (assuming to target the max pain pin).

Other than very strong 3C signals last night, this is what ES looks like now.

 The earlier overnight session, right after Europe opened an intraday negative divergence took ES lower.

Here you can see that more completely.

Currently ES is in line, no divergences at this time.

The first hour or so of a.m. trade is usually not the best for gathering data, after that we should find useful information.

Typically most options are closed by 2-2:30 and the market starts to show its personality.


Tonight's Futures

First since I've had a few questions about this and second because other than the F_O_M_C, I think this is one of the biggest, most influential events of the week, I want to share the USD/JPY situation this week.

Several weeks before the SPX/market hit the November 16th (2012) lows, which was the end of the roughly 7 week downward drift that started September 14th, the day after QE3 was announced (the second day of upside knee-jerk reaction that failed later that afternoon on the 14th and never saw that high again until January) followed by a 7-day -5.25% decline right in to the November 16 low, the carry trades were already being accumulated and put together.

Carry trades are a way for (really any trader, but more often than not, hedge funds and larger institutional money) Hedge funds mostly to leverage up their AUM (Assets Under Management). With A carry trade there can be leverage as high as 200 to 1 so a hedge fund can really create a lot more buying power than their AUM would dictate.

Since the leverage is so large and even a small move against the carry pair can be disastrous (more on that in a minute), they are often entered in to in baskets, meaning more than 1 pair, a pair being EUR/JPY (long the Euro, short the Japanese Yen). When these carry trades unwind (are closed out) they can have pretty spectacular moves and sometimes spectacular blow-ups, I don't just mean a trade going wrong, I mean something much more sinister.

A fantastic example and if you don't recall or have never heard about it, read up on "Long Term Capital Management". This was the DreamTeam of hedge funds, the principles were some of the most experienced traders in the world including: John Meriwether who had been the head of bond trading at Salomon Brothers. Other directors included, Myron Scholes of the "Black-Scholes" derivatives model and Bob Merton, both Scholes and Merton won (shared) the 1997 Nobel Prize in Economic Science.

These were certainly some of the brightest minds in the world when it came to finance/trading. To make a long story short, they did very well initially, then they lost over $4.5 billion in about a quarter in 1998, the blow up of this fund was so big the F_E_D had to step in and by 2000, LTCM was liquidated.

LTCM was known for using a lot of leverage, but when things turned south (and there were many reasons), they went from $2.3 Billion in equity to $400 million 3 weeks later with $100 billion in liabilities for a leverage ratio of 250 to 1!

One of the interesting parts of the story was how connected various Wall Street firms were to LTCM and the fear was their collapse would cause a chain of events ending in the collapse of a good portion of our economic system, at least Wall Street's.

Warren Buffet (Berkshire Hathaway) with Goldman Sachs (and I believe 1 or 2 other firms) thew LTCM a low ball offer to buy out LTCM, something like $250 million for a firm that had been worth over $4,5 BILLION at the start of the year.

THIS IS THE PART THAT ALWAYS STUCK WITH ME, Warren Buffet gave Meriwhether 1 hour to accept or decline the deal!  Can you imagine, one year you are returning 40% gains, your firm is worth over $4.5 billion dollars and things go so bad that 9 months later you are offered $250 million for your ALL-STAR company with 1 HOUR TO DECIDE!  Any way, the deal fell through and the F_E_D had to step up to prevent a wider collapse.

There are a lot of lessons to be learned in LTCM, but one was certainly leverage and risk management and these were some of the brightest guys out there, the Black -Scholes model is still used today. 

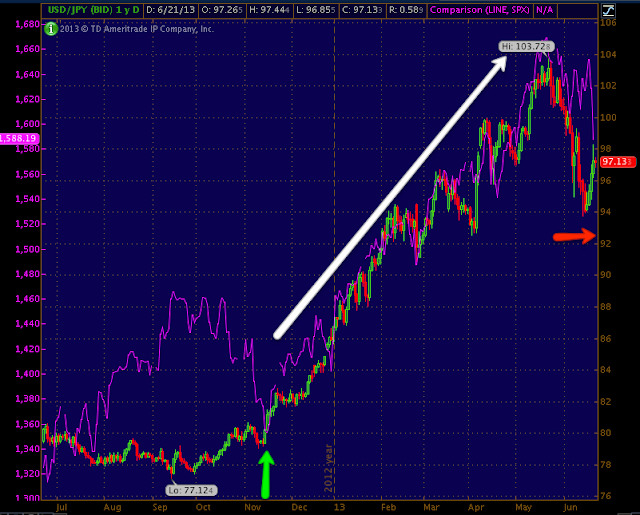
Back to the Carry trades, there were 3 that were running, EUR/JPY, AUD/JPY and the most recent one or last one left standing was USD/JPY which has been a primary driver of the market for nearly 7 months with very high correlation.

For example, here are the 3 carry pairs vs the SPX.

 The green arrow is the November 16th SPX(purple) lows. Note the correlation was certainly there, but not as close as the USD/JPY.

 The AUD/JPY started with very good correlation and then (as many of you remember because we were watching 30 min charts of the pair), that Carry pair collapsed. That left 1 pair really standing.

This is the USD/JPY, this is what we have been paying so much attention to, few traders have any idea what is really moving the market, the Yen is the last thing on their mind, but that correlation speaks for itself.

You may recall over the last week+ we had a VERY strong 15 min $USD positive divergence and a very strong JPY negative divergence, here's the $USD...
3C had been showing a very strong positive divergence in the $USD and the opposite in the JPY, this is one of the reasons we were expecting a VERY strong market move to the upside because the USD moving up and the JPY moving down is exactly what the USD/JPY pair is, that sends the pair sharply higher (as you can see the USD divergence did fire off as expected) which as you can see on the chart above this one, has sent the market higher for 7 months with an increaSINGLY STRONG CORRELATION.

This week, since Sunday night I've said many times that the short term 3C signals aren't there, the near term action is very opaque, I figured it was because of nervousness in front of what many were calling "The most important F_O_M_C meeting in years". I noticed and mentioned in the daily wrap a distortion in the USD/JPY and SPX correlation, I didn't think too much of it as traders were likely moving in all kinds of directions in front on the F_O_M_C policy statement.

It turns out, whether temporarily or permanently, we had a POLAR 180 DEGREE shift in the pair's correlation with the SPX, you can see it on the USD/JPY chart above to the far right, but here's a closer look.

Instead of moving together in sync, the correlation for the first time since November 16th totally reversed and right at the F_O_M_C meeting, this has been a pretty huge event and instead of sending the market sharply higher and the USD/JPY have moved as you can see above over the last 4 days, the new (historic $USD correlation) correlation did the exact opposite.

So this was one of the big events this week  other than the F_O_M_C, and one that few people are probably aware of, although it has immense influence.

Of course we'll be keeping an eye on things, I think it could flip flop back and forth, but it is probably likely that this carry trade is shot and thus the market very near the final date with destiny.

That doesn't change today's analysis at all, things still jiggle  and gyrate in very volatile manner.

The Index Futures are looking pretty decent tonight thus far. The Nikkei is off with a beautiful move thus far...

The SPX and NASDAQ 100 futures are also looking good...
 ES doesn't look as strong as the NASDAQ futures below, but ES had a stronger divergence during regular hours today so I'd think NQ is catching up.

NQ positive divergence.

We had a lot of strong signals the last two days, as I warned before the F_O_M_C and I ALWAYS warn before any F_E_D event, "Beware of the knee-jerk reaction", the initial knee-jerk is almost always wrong.

I also tried to set expectations to some degree, I've seen the knee-jerk reaction (and it's always VERY impressive no matter how long) last 2 hours or so, I've seen it last a week, typically it's about a day and a half so we aren't really out of the ordinary, we are in a very volatile spot of the market so all moves are going to be exaggerated, but I feel good about where we are right now, not only from the charts and concepts above, but from credit and other leading indicators to individual 3C charts in the averages or even individual stocks.

I'd love to see a heaping, massive gap up/short squeeze and finish the last move of our working thesis laid out nearly 3 weeks ago that so far has been pretty spot on. If it does, we'll be very happy about the positions opened the last 2- days.

The one thing you always have to remember is the market and price are extremely deceptive. According to conventional wisdom, with all of the overnight bad news from China through Europe and right in to Initial Claims, all of that news should have created a strong up day today as bad news is good news as it forces the F_E_D to stay their hand, but I don't believe that's what is moving this market at all, these cycles are set up ahead of time, the price patterns are there to manipulate traders, nothing is as simple as it seems. 

I'll see you in the a.m.