Wednesday, January 23, 2013

Highest Margin Leverage Versus Stock Market Cap Since 1929

I'm going to let someone else do the writing tonight, this is from the Stock Trader's Almanac Website, an excellent book to have handy (make sure you buy the current year-2013).

The title says it all, here's the article which is very much in line with last night's post which referenced the record high net long positioning.


Here's a little teaser:

The venerable Mr. Newman goes on over the next 5 pages to show how this compares to 1987 and other high points. He discusses, how valuation metrics have changed, what High Frequency Trading has done to the market, the absence of bearish sentiment, the risk in owning Amazon, among other observations and warns on the last page that: 

We believe stocks are putting in a major high. A correction of at least 20% should be expected. Worse? Quite possible.” 

Daily Wrap...

For reasons I just mentioned in the GOOG post, I'll try to keep this short. Credit for the second day not only didn't perform, it was really in risk off mode which is important. Yields have been negative for quite some time and they are like a magnet for equities so there's definitely some trouble there.
 HY Corp. Credit, a risk on asset had no confidence to follow the SPX yesterday, today it actually lost ground and went the opposite direction, thus one of the reasons the CONTEXT model was hitting huge divergences between the risk asset implied ES value model and ES itself.

Yields on a long term basis should move with equities as seen at the far left, they have been in a large negative divergence for nearly a month, I

The resolution of the EUR/USD triangle probably won't be a clean cut affair because it's such a common technical price pattern, but I have a hard time believing GS's $1.40 target, in fact since they put out their long EUR/USD note, the pair has been in a long triangle consolidation, the kind in which we normally see with distribution.

The Euro is definitely underperforming as it traces out this triangle and that's at odds with the market as they normally have a positive correlation.

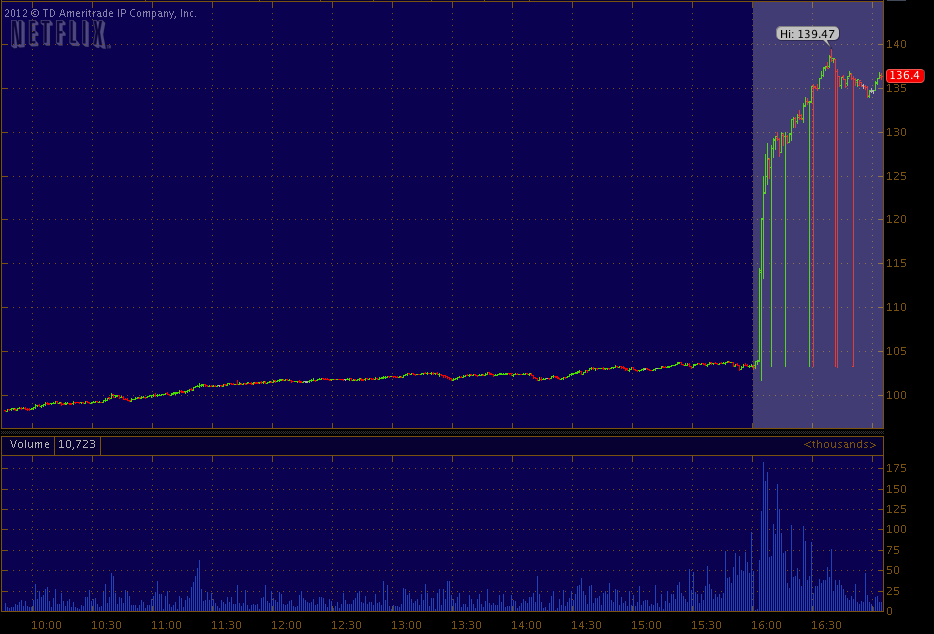
 As mentioned this afternoon, the Euro gave some support to the market late in the day (yellow).

Longer term it hasn't made a higher high since mid January, around the Goldman long call, if you want to take free advice from a firm that trades against their own clients, that's up to you.

Not that I follow him, but I do respect him, if memory serves me correct, Tom DeMark's TD Sequential Top in the SPX was around $1492, we're at $1494.30 with a VERY small candle and some other interesting indications coming from my custom indicator that was DeMark inspired, but it is NOT TD Sequential or anything like it.

 My own indicator on the SPX has a broad sell signal which has been mostly around trend #1 which was expected to be  segue to trend #2.

Interestingly as you can see the indicator has called a lot of bottoms, we just got a signal in the VIX today, the VIX trades opposite the market and is showing extreme complacency right now, that's a dangerous time to be long and as I said, the last call was at the very bottom and the VIX rallied.

AAPL had an after hours 3C divergence (positive) , although we originally put 3C on TOS for after hours trade, we found it much more useful for futures so I never followed AH trade, but if that positive divergence in AH is correct, then a gap fill in the Q's and AAPL would be appropriate and certainly wouldn't do any damage to our analysis, in fact under the right circumstances, it may be the perfect storm, but we'll let the market tell us that. I do find the VIX signal very interesting though considering we just hit lows not seen since mid-2007 a few days ago, that's extreme.

The NASDAQ futures also have a positive 1 min divergence in them so they may look to fill the gap as mentioned above, ES and 3C right now are nearly perfectly in line.

As usual, if anything interesting develops over night, I'll let you know, but I'd think things won't move too much so those gaps can be filled, which doesn't bother me at all.


GOOG Update

I actually have 12 GOOG charts as there were quite a few things to see, but to be 100% honest, I'm on my 12th hour today and my wrist is starting to rally throb from so much typing so I'm going to abbreviate the GOOG post to a couple of charts...

 Th daily chart and close tell us several things, first the long upper shadow on today's candle is bearish, it's higher prices being rejected most commonly because of overhead supply/resistance. GOOG did break above the recent highs so it opened up a lot of demand, demand is essential for distribution, especially at these levels, but that's not where the overhead supply is, it's from Sept./Oct., I'll show you how I can confirm this below.

The daily candle is a bearish candle, almost a shooting star if the upper wick were a little longer, the increasing volume makes it a higher probability reversal candle, even though it didn't quite make it to a shooting star.

 The daily chart showing distribution at Sept/Oct. is a strong signal and being there were a couple of new highs in the area, bull traps would have been set, thus there's still bulls trapped and overhead supply.


 This 3 min chart first caught my attention with a leading negative divergence, but these could be found in a number of timeframes today.

For the length of this move, this 5 min leading negative nearly to a new low is one of the more impressive, this has all the hallmark signs of distribution, smart money doesn't chase stocks that are up over 5% in a day, they sell them., I think I talked about that last night. In any case, GOOG is on my radar for other reasons that date back a longer ways so I'll be looking for opportunities here, perhaps puts, maybe an equity short add to.

One of the messages here is GOOG is a bellwether as is AAPL and IBM also had some not so hot signs today, yo can't ignore even these smaller details. There's rarely a smoking gun, it's a lot of detective work that gets us the best set ups.

USO Follow Up

Yesterday there were 3 posts in a row about USO, the first, "Take a Look At USO" was a quick heads up around 2:30 to let you know that USO's charts were deteriorating.

Then, "USO Follow Up" which included some great head fake lessons as well as the charts. There were 7 charts, but this one from the post gives yo a pretty good feel for the deterioration...

Yesterday's chart.

The third post was, "ERY, Energy, USO, IOC" which was a look at USO, the Energy sector, ERY as a play on the energy sector and a core short in place already, IOC. The end result of the post was I didn't think Energy and thus ERY were quite ready, but I did like both USO and IOC short, of course there's leveraged shorts for oil as well among the ETFs, it turned out to be the right choice as IOC was down -4.47% and USO down -1.11% while energy was only down -0.37%.

Here's what the trade would have looked like, at least for today....
 USO from the time it was mentioned to today.

 IOC -the same...

In the case of IOC it ended with a strong move, heavy volume and a longer lower wick on the daily candle so I wouldn't be surprised if it's at a short term bottom and sees a correction. If you are short IOC feel free to email me.

USO continues to look bad in the near term, don't forget, oil was just at a 4 month new high yesterday so there's still some work to do on the longer charts, but I think yesterday's entry was probably a good place to get your feet wet.

Energy/XLE was also at a 4 month closing high yesterday, it didn't look ready to me yesterday, but things change fast and Energy looks a lot worse today than it did yesterday, however as I often remind, tops/reversals are a process more often than an event, which is good to be in early in the process as it allows a lot of benefits that lower risk and get the best entries.

 This is the energy sector and a 15 min chart, yesterday I wasn't so interested, today a lot has changed so we'll be watching these a lot more closely for both long and short opportunities. By the way, this is an excellent example of a divergence, note price is the same at two relative points, the open and near the close as price is close to the trendline representing yesterday's close, note how much lower 3C is (leading negative) at the second move up to that price area. This is telling us that there's less institutional flow in the sector later in the day as compared with earlier.

 ERY which is a 3x leveraged short on Energy has a great looking 5 min chart, you might wonder why I didn't like it more yesterday, but there are a lot of thing that go in to analysis.

While it may not appear to be a big deal, the 15 min chart saw a lot of improvement today and this is an extremely important timeframe, so I'm liking ERY a lot more in this area.

Finally there's one larger observation to be made, I have what I call the "Three Pillars", they are the 3 groups that the market needs to sustain a move as they are very influential in the major averages, they'd be: Technology, Financials and Energy. You saw what happened to the Q's today and AAPL tonight, I posted earlier in the day on the deteriorating situation in Financials and now we see Energy deteriorating as well, there's a bigger hint about the market in putting those three observations together.

AH...

I have the charts to cover GOOG, I need to talk with my wife in Hungary on Skype for 30 minutes or so and then I'll get those charts and others up.

As for AH...

We'll leave AAPL alone for the moment, there's quite a bit of volatility in after hours there, but it looks to be settling in below $500 so good thing we closed those calls. As far as the QQQ negative divergences go today, this from the afternoon NASDAQ / QQQ update,

"The strength in the Q's yesterday sent them higher and it seems that strength is being eaten in to in what would be typical distribution...I'm worried about this market, actually it's fine with me , I'm just saying there are a lot of things not looking good."

So what we know pretty conclusively is that the 3C divergences are right on and they can't be right on without some level of market manipulation, whether cycles, 1 day rotation, leaked earnings, etc. We wouldn't be able to see these things so clearly if there wasn't a strong flow of money creating these signals. Yesterday the signals were QQQ and AAPL up, but only until earnings then we have to take a look and before the close we did that in the post linked above and it wasn't good for the Q's.

The NASDAQ Futures were slapped pretty hard with a -30 point fall .


However the Q's did do the one thing they haven't done in over 2 trading weeks, something the other averages did a week or so ago...
They finally crossed the resistance zone and tonight we find the Q's right back below (the light blue bars near price are the current bid and ask).

NFLX had a nice beat, but more importantly they guided higher, that's what really matters and the +32% the stock is trading up in AH, we'll see how much of that holds tomorrow, that should be REALLY interesting.

ES is also starting to take a bit of a hit to join the NASDAQ futures...


GOOG Note

GOOG is throwing off some wickedly negative signals, remember yesterday I said give GOOG about a day after earnings?

IBM seems to be doing something similar, maybe not to the same extent.

This would be crushing to the market if one or both gave up those gains, that's why I established the vaseline for GOOG this morning (yesterday's data only-or up to yesterday only).

I'm updating my system now, but I'll post them ASAP.

Market Update

ES is not holding up well, it's negative, NQ is in line, but looking at the QQQ more specifically I can see a lot of areas of increased deterioration.

I think the exit for AAPL was timed perfectly, with it just sitting there right now.

The divergences in leading indicators and CONTEXT are really something. The only bit of backing I see in the market in the afternoon trade was the EUR/USD moving up for a bit and supporting the SPY, lifting it in to the green

Closing Out AMD Long

I see some signals there and there's no way I'd buy it with those signals (right now) so I see no reason to hold it as it has a decent profit.


NDX/QQQ Update

The strength in the Q's yesterday sent them higher and it seems that strength is being eaten in to in what would be typical distribution, especially with a 1 day cycle like thi that we have been seeing (rotation) over the last week or so.

The AAPL 505 calls were closed at a +33% gain and this price action certainly didn't hurt...
 AAPL 1 min upside volatility is great to sell calls in to.


 The QQQ 3 min chart showing a overall negative trend, even though short term the 1 min was used (just like yesterday in the SPY, DIA, etc) to hike prices up.

 The 5 min is a better representation of where the 3 min chart is in context of the trend, there's no confirmation here, there's a negative intraday trend.

 The 10 min chart shows a negative and then positive trend, right now it's perfectly in line when looking at this zoom factor, among the trend, it's lower or in leading negative position.

 Here's another example, the 15 min chart on a more intraday or close up basis showing the various shorter tern moves, today doesn't look good here.

 The same 15 min chart in Context of the trend.

The 60 min chart is unreal how perfectly 3C confirmed price at the green arrow, then picked up the positive divergence in to the 11/16 lows and shows trend 1 accumulation an d a leading negative position that is heading lower.

I'm worried about this market, actually it's fine with me , I'm just saying there are a lot of things not looking good.

AAPL Update *Closing 505 Calls

I'm still watching AAPL and it's interesting to watch a late day surge unfold in the Q's and AAPL on a 1 min positive divergence

 This leading 1 min divergence quickly turned in to this leading 1 min divergence minutes later...

the same thing happened in the Q's at the same time.

The move is so big I can't even scale it as the middle section of 3C should be closer to price. However I do see some deterioration in both the Q's and AAPL as of now. I'm really thinking the 505 calls should be closed, leave the 520's open as a backstop just in case.


 This 3 min is in line intraday, but the 3 min and 5 min are both actually leading more than I can show you with intraday charts...

 Here's the 5 min leading, but take a look below at the same chart intraday.

 This is a 5 min AAPL intraday and I don't like that negative

This is the 10 min, I've been looking at this a lot trying to figure out how much accumulation minus how much distribution already, I don't have a good answer, but I'd rather close the trade at a profit of 25 or 30% than have a total loss.


A Quick Look at Financials / FAS / FAZ

I grabbed several charts in different timeframes rather than post 20 charts. XLF and FAS (3x Long financials) should show similar signals/trends while FAZ (3x short Financials) should be nearly the mirror opposite.

 XLF 2 min


 XLF long term 30 min

 FAS 2 min trend

FAS 5 min

FAS 15 min trend since the 11/16 cycle started


 FAZ 1 min leading positive

 FAZ 5 min leading positive

FAZ 15 min leading positive

I want to see what the other industry groups are looking like, there's definitely an increased rate of deterioration in Financials.

Leading Indicators Worse

High Yield Corporate is making a new lower low, Junk still looks bad and HY looks bad, HY Corp though really looks the worst. Commodities are falling apart as well.

Here's a  quick look at a few and a look using CONTEXT...

 Commodity downside is picking up more momentum

 As is HY Corp. Credit

And CONTEXT is at new differential lows of -14.

I'm really looking for a decent swing in AAPL to let go of the $505 Feb Calls and I'll likely keep the $520's open.

I'm also looking closely at AMD.

ZNGA Update

ZNGA was a long idea, it's also a longer term idea that appears to be basing. Currently ZNGA is up about +12.5% for us.

I was looking at it and trying to decide if anything needed to be done and actually kind of like ZNGA where it is right now.

As ZNGA is a partial position, it still has room for about 50% more until it's at full size, I might even consider adding in the area. I don't know if ZNGA picked up the same trait from FB, but when we were buying FB when everyone else hated it and making good money, FB was one of the few stocks that traded completely independent from the market. I have seen some of that in ZNGA.

Longer term daily the change in character is obvious.

You may recall this area in which support was broken on heavy volume in to a positive divergence, it looks a lot like a lot of cheap supply was absorbed.

Here's the daily 3C chart, daily divergences are pretty rare, especially leading like this is (positive). The downtrend was confirmed by 3C.

The 4 hour chart showing the negative divergence at the top and the first leading positive at the break of support I just mentioned and continued leading positive positioning.

Overall the longer term and probabilities on ZNGA look very bullish.

Other than a lot of action I'd consider normal, it looks like this 60 min chart shows a negative divergence meant to create a pullback, we want to see accumulation/positive divergences in to pullbacks , which makes them attractive as buy or add to areas with less risk and better prices.


The 10 min chart is already showing a decent positive divergence building through this area so I actually like ZNGA here.

The long term X-Over Screen shows the short signal...

Here the price moving average ALMOST give a long signal, but it would not have been taken due to the other two indicators still negative, at the white area all 3 indications go positive and we have a pullback that is quite typical early on  to the 10/22 bar averages. This is a big part of the reason I like ZNGA here as an add to, not quite a full position yet.

For now the Trend Channel has a stop on a 2-day closing basis below the $2.30 area, personally since there's some support in that area I'd probably take everything in to consideration beyond just a price stop, but I'd hope it holds the Trend Channel.

I'm not opposed at all to starting a position (long) here or adding to it, I'd personally bring it up to 50-75%.