Friday, December 13, 2013

Daily Wrap

With 5 min Index Futures positive divergences it's pretty hard to bet against those in the short run, but when we have 15 min (NQ/NASDAQ 100 futures joined ES and TF today), then probabilities are very hard to ignore.

Today was an unique day in that the op-ex pin seemed to coincide right with the basing area, I'd normally expect that on Thursday as Friday's max-pain pin opens close to Thursday's close, but all those divergences make it sort of overkill just for a weekly op-ex pin.

Nothing about the short duration analysis of the last two days changes any of our other standing analysis in the least, this is just what a normal market acts like and we are so conditioned to seeing a one way market over the last 4 years, when we see normal it looks odd.

The daily closes alone suggest that we have reached a short term correction point in the major averages...


Add to that the VIX-based derivatives at stall speed just as they were going in to last Friday's NFP, it looks even more like a short duration correction. Any movement is good, on days like today there's not much you can do that's a high probability position, yesterday was mainly the day to do that, but movement, even up in to bearish indications means opportunities, I'm thinking about PCLN and TWTR right off the top of my head as I write that.

Leading Indicators shows HYG outperformed the relative strength of the SPX today and it had that small divergence on the 2 min chart, actually a strong divergence, just a weak chart, but similar to last week. VXX also underperformed the SPX intraday relatively speaking as well so that's a clue that they're working on the SPY arbitrage, again a rise/wash/repeat of last week, however the carry trades are seemingly broken as I suspected they would be 2 weeks ago as they showed more and more trouble.

Yields which have been such a great leading indication are positive meaning the SPX should move up toward them, they have been positive for 3-days at an increasing pace, the last several reversals they called  were 2-days negative in to December 9th SPX highs, 2-days positive in to December 5th lows.

HY Credit was almost perfectly in line today (sideways) so no big indication there except it wasn't negative. Commodities have been almost exactly the same over the last 2-days, I think the PMs will need a day or two more, then GLS and NUGT longs should be working again.

As mentioned before, the major averages have short term bullish reversal set-ups (weaker ones) across the board, but you could guess that with the SPX almost unchanged, the Dow +.10, the R2K +.37 and NDX-.12%, almost no movement. With price movement or lack of it, as you might imagine there were no dominant P/V relationships today.

Compared to former VIX breakouts and big moves, the price action there is quite normal.

There was absolutely nothing remarkable about today's breadth charts.

It was actually quite a dull day, the real near term probabilities are right here in the Index futures.
 15 min ES

15 min NQ

15 min TF...

The bearish probabilities are in the same place, just stronger charts.

4 hour TF...

There really isn't much more to say about the market that hasn't already been said. I suppose if I were the invisible hand I might want to set up one last hurrah if I could before next week's F_O_M_C in which the consensus is for a December (partial) taper, it's really how the bond market reacts if they do taper that will be most interesting and may cause the biggest fuss. The meeting starts next Tuesday and by 2 p.m. Wednesday we'll know what the answer is to the most anticipated F_O_M_C meeting since QE began in late 2008.

I'm working on a new indicator based on the reversal process, the amount of accumulation/distribution and targets based on that and several other factors, if I can work it out and test it, I'll post it, I think that would be a great addition to our toolbox.

Have a good weekend, I have talked with most of you and know how most of you are positioned and I wouldn't be losing any sleep, so enjoy your weekend.


EOD Update

There are a lot of bullish closing daily candle formations among the major averages for the last 2 days (today).

Here are some of the charts, I'm leaving everything as is, as I suspected early today, it would be a day of paying attention, but mostly patience.

 DIA 10 min leading positive

IWM 30 min leading positive, small, but there.

QQQ 2 min shows the stop run was accumulated and volume shows stops were hit.

 QQQ 5 min with the head fake move as well

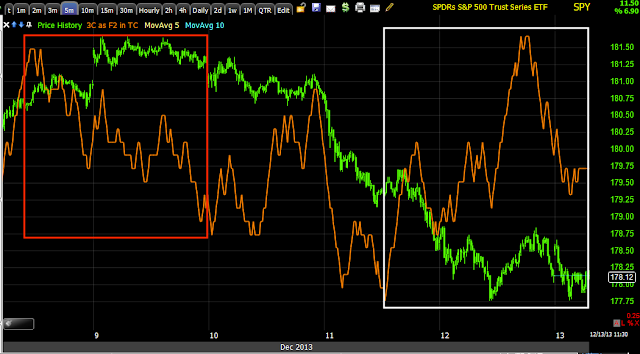
SPY positive intraday on the Tweezer bottom

SPY 10 min leading positive

And the 5 min TICK custom indicator.

I don't love areas like this, but we get paid to take risks, and this seems to be a pretty well calculated risk, it doesn't change any of our core positions or analysis.

Market Update

No smoking guns, but somethings of interest.

Usually you'd think one might be looking for protection near the end of the day at the end of the week over an uncertain weekend, meaning buying VIX futures...

 This is the pre-2 p.m. SPY negative divegrence 1 min/intraday I mentioned that led to the 2 p.m. stop run.

This is VXX /UVXY and it seemingly selling off at that same stop run from the SPY divegrence when you might think it would be at least in line going in to the weekend.
 
And the larger 2 min chart at both yesterday's late afternoon decline in the market and the pre-2 p.m. move today in VIX, it almost looks like the asset is prepping for a move down, which I will not short, but it does move opposite the market.

 And a 3 min chart showing the exact same (details are sometimes better than trends)

At the same time, remember what I said about an apparent attempt to support/lift HYG to activate the SPY arbitrage and support the market (VXX down is part of that), here's HYG with a pretty positive intraday chart.

I wouldn't call these smoking guns, but they certainly are curious, I'd be a lot more nervous about those short duration long positions if I had not seen things like this.


Market Update addendum

Yesterday I assumed they'd want a bullish inverse H&S pattern in place for all the BTD's, however since today's sentiment update and seeing retail flip quickly to the bearish side, a run of the stops (head fake move) that I wondered about earlier today would make sense, it would act as a small bear trap, which is a bit of a booster on a short squeeze when prices move back above the area.


Market Update-

2 p.m. is just getting more and more interesting on Friday's, it use to be 2-3, then 2:30, now 2 p.m.

In any case, I'm not panicking although I'm a little tired of this (short term trade) as there are longer term positions like TWTR that I'm very interested in.

Like yesterday, there was an effort to move the market down right in to 2 p.m. (except yesterday was non-specific as to time), on the other side of the coin, there are some stronger positive divergences now than I'd have expected.

I was wondering earlier if intraday support would be taken out today or not, in some of the averages we have an answer to that question, but otherwise I'm sitting as patiently as possible and observing.


For some reason I can't upload charts right now, but what you would have seen is SPY 1 min intraday go negative just before the 2 pm hour and the downside reversal right at 2:02 or so. Otherwise most SPY intraday charts are in some version of inline or leading positive with the addition of a leading positive chart in the 10 min space and a daily "Tweezer" bottom chart.

DIA you would have seen the same thing on the 1 min as the SPY and a leading positive 10 and 15 min chart, these only went to 5 mins yesterday.

The QQQ breaking intraday and recent support as I wondered about earlier, stops or orders hit there and the 2 min positive on that move as well as a weak 10/15 min positive.

IWM 1 min like the rest, 2 min positive on the move like a head fake and leading positive at 5 mins still, as if nothing happened.

The VXX, an earlier negative when I mentioned the SPY arbitrage and just about every chart from 1-10 now negative and HYG with a fairly strong leading 2 min positive, again the SPY arbitrage.

TICK data is still positive on the SPY out to 10 mins, and recent intraday is turning positive again.

So, it's not time to overreact, but to pay attention. The run of some stops right at 2 p.m. is interesting, so are the 10-15 min charts that are positive.

Still sitting here with all of the longer term shorts in place and only the trading portfolio with the long exposure on a short duration basis, all the same positions as mentioned before.


SPY Arb...

This is on an intraday basis, but they are trying to activate the SPY Arbitrage by supporting HYG and selling some VXX. We're pretty close to 2 p.m. so I doubt this is coincidental.

Retail Sentiment In the Right Place?

I got my StockTwits update which said, "Twit-tards bearish, dumping longs and Investor.com is back to 70% bearish"

A move up would be the perfect lesson to teach them to keep buying the dips.

PCLN / TWTR

Of the seven positions in the trading portfolio, I only have 1 short, believe it or not, PCLN, I just couldn't let it go even for a short term, the charts just don't look good and they are showing very poor relative performance vs all other assets. The $1200 area is still bothersome to me, even just looking at a price only chart, it's the first thing my eyes are drawn to and I'm guessing traders as well, but I still can't close it.

PCLN 15 min, note not only the divergence, but the divergence at the range, the correct concept here would be a head fake since a range is established and shorting that > $1200 as it is standing out like a sore thumb, I'll set an alert and see if that happens, what things look like, but otherwise I just can't justify closing it.

The other positions in that portfolio (all added yesterday accept MCP long and PCLN short) include : DGAZ (short) which may be longer than just a market move, URTY long, FAS long, UDOW long and IOC long.

TWTR looks HORRIBLE. I can't quite bring myself to enter this yet with the market where it is, but I think it will be on the site with increasing frequency and as a longer term position, not just a trading position and short, it really looks bad.


Trade Idea MCP / Market Update

I went over my list of assets in the trading portfolio, I don't see any thing I want to change, the only thing I'm going to add is to Options tracking with a Jan $5 Call in MCP, there's already a full long position in both the short term and longer term portfolios.

I'm going to go over the watchlist again and see if anything else is standing out.

Typically op-ex is pinned until 2 p.m. or so, so I'd think if there were any move today, it would be after that hour.

Market Update

3C signals are looking better and better as far as the move (corrective, upside) that we prepared for yesterday.

I'm going to run through the asset list one more time and make a decision about any "possible" last minute preparations.

Market Update

Thus far we have the general intraday activity of a base and that of an op-ex Friday, it's hard to say if they are two separate events or , but I'm leaning toward our base is still alive, here's why and we'll look at little at GDX (GLD by correlation ) and USO.

 This is the late day distribution intraday in the SPY from yesterday that was pointed out just before it began to take prices lower in what seemed like an inverse H&S pattern being formed, it took out some of the BTD's when afternoon support was broken as volume picked up on the downside.

This morning it was negative right on the open which sent prices lower and created something more akin to a small "W" bottom and then supported the SPY before that price pattern dropped too low and destroyed the pattern, pretty much in line there since, which is the same kind of activity we see on op-ex Friday's any way.


The 2 min chart shows the same thing, late yesterday's distribution and early this morning's and then accumulation at today's lows creating that small double bottom or "W" pattern.

The 3 min chart didn't see much damage from either late yesterday or early this morning's activity, there is a clear area of support that we'd normally look for a head fake move, but I'm not sure such a move would be beneficial if they are trying to get retail to buy the "W" base.

And the overall pattern since distribution earlier in the week to yesterday's change in character which also changed a lot of short term trading positions.

UVXY / VXX (short term VIX futures) are still very strong as you'd expect with the spot VIX in the place it's in with a BB squeeze that has acted exactly as it should for a big move higher (market lower).

The same strength is there on the 10 min chart, you may recall yesterday I said I thought if there were any bounce/correction it would be on the 1-5 min charts, being VXX typically trades opposite the market this is just more justification for that comment yesterday as that's also what we saw in the averages.

However at 5 min we see the positive activity put on hold.

Remember last week when we had 5 consecutive down days and I said they were holding HYG together for 4 days previous to Friday's move up breaking the down streak? I also said the 3 previous days in VXX, they were holding that down or in place.


 Here are those days last week (yellow) in VXX/UVXY and then the market pop (VXX/UVXY down) last Friday, it seems the same is happening since yesterday and in to today in VXX/UVXY.

On a 1 min chart you can see it with more detail, thus far a shorter period, but similar activity which stood out last week as we mentioned it before the market made Friday's move up as it seemed that move up had been in planning for at least 4 days prior to the NFP, so it also seemed the move had nothing to do with the NFP or they wanted it to seem like the market was immune from whatever the NFP came in at, good or bad (it just happened to be bad for QE lovers).

 HYG was the other asset, they are two of the three SPY arbitrage assets and arguably the two most important. We can see HYG's action last week, this week it's not as strong as 3C is still leading negative rather than stuck in line.

On a 2 min chart the details become much more clear, yesterday and today are similar to last week's 4-day period leading to Friday's NFP (red)

I'm guessing this similar behavior is for the bounce expected yesterday or at least prepared for yesterday rather than an op-ex pin, but who can say for sure, it would be easier to say if today wasn't Friday as price reacts much the same on an op-ex Friday.

I'm fooling around with an indicator right now that will hopefully be able to forecast the strength of a move, it's a notion that came to me last night and I've been trying to code it, it's quite difficult, but it makes sense when you think about the stages of a move (1, 2, 3 and 4) and how they are proportionate, I'm trying to use a variation of that proportionality to forecast a move's upside and if that works, then I'll work on the downside as well, it's quite a unique concept, but I think it makes sense and it would sort of be a "secret" Wall St. code so they all know when every other herding sheep of a hedge fund will react.

As for USO, I've been looking for a pullback, I should have said correction as that is more appropriate and can happen through time or price. If a correction is correct through time, then today's move may be the head fake that tells us the "correction" is almost over. You may recall, I REALLY like USO long for a sub-intermediate up trend.

 This is the last head fake move right before USO's first move out of it's long base, then the 3C signal for a correction.

All new divergences start on the fastest charts like this positive 1 min on a possible head fake move that we see right before a reversal (of the correction).

So far it has moved to the2 min chart, if it moves all the way to the 5 min chart, then it's time to add USO long back to the mix as we exited it as we saw the correction coming.

As for NUGT (GDX and GLD by correlation), we were also looking for a correction there that we got and made some extra scratch by playing DUST, but still looking to re-enter NUGT long, we may be getting close to that point as well.

Again, all new divergences start on the fastest timeframe, the 1 min is positive today, although NUGT would need a wider base (Maybe a day longer or so), this may be the initial signal that we are there.

The 5 min chart needs to go positive here too before I'd feel comfortable going long NUGT and or GLD, but once again, we may be in the area as the gap was filled which is all I was looking for.

Consider it may take another day or so for this to build a base and reverse and consider that it usually trades opposite the market, that tells you something about the market as well as both the corrective phase to a possible long in NUGT/GLD is starting and the possible short duration base for an upside market correction may be nearing it's end before it's short duration move, they almost match up perfectly.

A.M. Observations

It's another op-ex Friday, that means there's typically a pin until 2 om when most contracts have been fulfilled and then the market can move as it wishes, it's how 3C moves the last 2 hours that is important because that's typically where we will pick up the next trading day, even over a weekend.

It seems clear to me that the inverse H&S base was meant to be.

There's good news all around for us, short term and longer term. Short term our trades set yesterday look like they should do well, and after that the market is in even more trouble with the carry lever broken, we saw this last week with a 180 degree opposite correlation in the carry pairs and ES, take a look at overnight which was ramped by a falling yen, but more so the Yen than the carry pairs.

 EUR/JPY vs ES (purple) 5 min, where's the correlation?

The same , but 1 min. This means 1 thing for the market after it gets done with this little consolidation/base, well it means at least, no good can come from the carry pairs anymore.

 I do know it is Yen based because this is the Yen vs ES (purple) and there's an inverse relationship, but on a larger scale it too is broken. I suspect, the Yen won't be down too long...

 5 min positive in the Yen, there are longer charts too, no good can come from this for the market.

While TF still has a 15 min positive, I think this is about the last hurrah before all the 50-day averages are broke and retail traders are really lost without their 50-day moving averages.


We'll keep an eye out, but today feels like a day to just relax a bit a let the market flow, it seems we have a pretty good idea where it's going and where it will be.