Tuesday, July 26, 2011

Miners Trading System Signal

Still no change, the systems remans long NUGT,

MRX Short Trade...

MRX is one I've been following, it looks like it's giving a low risk entry right here.

 MRX already broke the back of the trend, we've just been looking for an entry.


Here MRX is breaking below a bearish triangle, it's not a bad short rght here wth a stop right around $38.40. I think it's worth a shot.

FDX Follow Up

The FDX Short Idea was posted on July 8th.


The white arrow is July 8th, in that post we were looking for one thing to happen to enter the short, a break below support which happened the next day (at the red arrow).

With today's volume and price candle, we may see some upside in FDX, which would make a nice add to-trade or even initiate a new position if you missed this one. Set some alerts for price if you can.

AAPL looks toppy

 AAPL made a nice breakout, volume has been falling off though.

 The 30 min chart hasn't supported this move.

 The 15 min chart is falling apart.

 The 10 min hart is as well

And now the 5 min chart.

Meanwhile in USO...


 Could todays erratic price action be a tell on tomorrow's Oil inventories?

3C just went positive.

Obama Just Threatened to Veto the Boehner Plan

And the market reacts...
Not even the algos can hold the market up when it comes to the Washington drama

TLT's Intraday Action

 TLT is up .82% today, but the intraday price action is a bearish ascending wedge.

3C is also looking bearish on this wedge formation.

HBI Short Trade Follow Up

HBI was a short trade idea from 7/22. Today it's giving a better entry and may continue to do so.


 The idea behind HBI was a false breakout and a significant break on heavy volume. As you can see, HBI has formed a bear flag since-volume is correct for the bearish continuation pattern.

 The hourly 3C chart is where there's big trouble, it was negative into the false breakout and remains negative in the bear flag.

 Under the circumstances, any upside reduces risk and gives a better short entry or add to position.

It wouldn't be uncommon to see a move out of the bear flag to the upside, which would be fine. I'd like to see the small breakaway gap remain unfilled.

GLD Still Looks Untrustworthy

 GLD struggling today at resistance, the ascent has been on decreasing volume as well, traders are backing away from higher prices.

 Note today's wedging price action into resistance.

 The hourly chart remans the main problem with GLD, there's been no improvement.

Today's 1 min chart has fallen apart as the wedge reaches its apex and starts to break down.

Sector Rotation Intraday

Interestingly, three important Industry groups for the Dow are coming back into rotation.
Discretionary, Industrials and Energy

FXA

The Australian dollar is often a leading indicator for the market, if we consider today's move, then perhaps they will go for the DIA/SPY breakout.

FXA breaking out to a new regional high. We've used FXA at least 4 or 5 times in the past successfully as a leading indicator for the market.

Algo Driven Ramp?

The price action recently in the market looks like an algo driven ramp, either that or short covering, but we're not really in a place to expect short covering like this. Perhaps they will try to take the market to our target?
 The DIA did break a downtrend line, but it really doesn't look like short covering to me.

 Here's the same in the Q's...

 And in the SPY...

Note there was no significant positive divergence in the SPY. This looks like an algo driven ramp.

Still something fishy with the $USD

No one can deny that the price action in the dollar is bearish, but the consistency of the underlying action suggests something is up. As I've said in previous updates, there may be some fundamental information we aren't aware of. t appears the slide in the dollar is being accumulated.


 Here's the initial trendline everyone was watching, and the lateral line is support taken out today. Remember we often see a false break before an important reversal.

 The volume alone tells you these are the areas the market has been watching as it surges when UUP breaks those support areas. This also makes it easy for the dollar to be accumulated en masse as someone has to take the sell-side of that trade.

 The 30 min 3C chart is at new highs while UUP is at relative new lows.

 The 15 mn chart is leading as UUP breaks support.

 Even today's break of support on a surge in volume produced a leading divergence on the 10 min chart today.

 The 5 mn chart has given no ground as UUP heads lower and remains in a leading position.

And look at the 1 min, showing accumulation at the break of support today. Remember that most asset classes have an inverse relationship with the dollar. You should have upside price alerts set for UUP, the first being a break above $21.06, t may very well be the start of an important move with repercussions throughout the market.

The SPY is REALLY Struggling

Back to the game plan.... Remember this post, "What Can We Can Expect After Op-Ex Today?"

After looking at a similar model and market conditions during the May-Op-Ex and what happened next, I made some projections based on what 3C looked like at the time, based on how the market operates and based on a historical model. I think it's important to revisit those initial expectations because we are in a position now that s almost exactly like what was predicted on July 15th.

You can read the complete post above, or this brief synopsis.

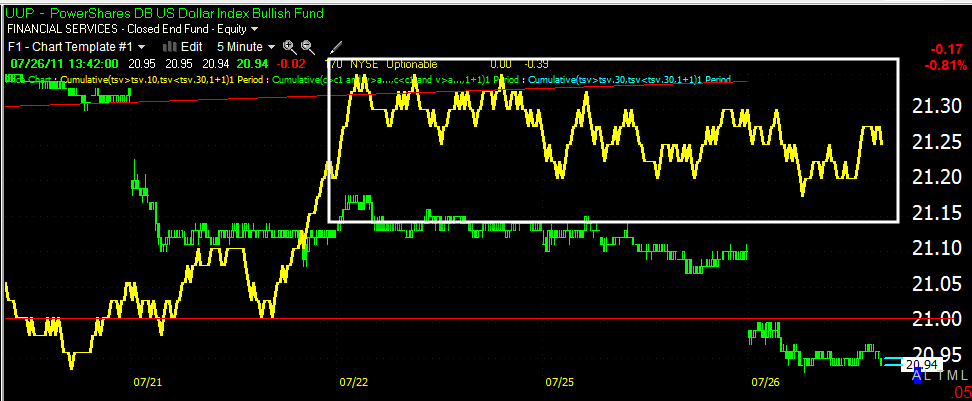
Here's the May Op-Ex Model
 Op-Ex friday is in white. The next Monday was a down day, which was accumulated for a run up, the point of the run up was to get good short sale positioning because during op-ex week, the market had to be held relatively flat to pin the options. After the down day on Monday, the market started a move higher, it was a 5 day period, but only 4 days contributed to the move higher, after that, we saw a reversal and a trend down. The final day of the bounce, did make a slight new high.

Here's July's Op-Ex. Based on that model and 3C readings at the time, in the post above I predicted a down day on Monday which happened in red, which would be accumulated, which also happened, followed by a bounce, which also happened. Thus far the bounce has been 4 days, 3 contributing to the move higher. The SPY, DIA and IWM DID NOT make that new high that I've been looking for, the QQQ did. Back n May, the SPY and Q's did make the move higher, the DIA did not.

The condition of the SPY right now...


 Intraday we have a bearish looking flag, without much 3C support, this obviously could change today, we still have plenty of time.

 The 5 min chart is in a leading negative divergence.

 The 15 min chart did exactly what we expected, accumulation on Monday the 18th, followed by a bounce that would see distribution. Currently the 15 min chart is in a leading negative divergence.

Even the 30 min chart reflects our expectations from July 15th.

Overall, I think the planning, the signals and what occurred has been an incredible success, but we can't or I can't stay hung up on an expectation of the SPY and DIA to break to new ground, while the Q's have already done so. I find myself sticking to a line of thought that is rapidly deteriorating. The call on the 15th was a success, the market has done largely everything expected, but right now the deterioration suggests that the reversal may be upon us.

I hope you used the opportunity to short in to strength or you use it now. For risk management's sake, I would plan on initial wide stops JUST IN CASE, we do see the move in the SPY and or DIA to breakout highs, it's the responsible thing to do. However at the same time, you don't want to miss the opportunity the market has given us. All in all, I think July 15th, "What to expect" was a good call. Don't let it slip away from you.

PNFP Trade Idea Follow Up (short)

The last follow up on PNFP was Thursday, July 21st in which I said, ""Keep PNFP on your radar, it's getting close."


 Here's PNFP on a weekly 3C chart showing what looks to be an impressive amount of distribution into the top.

 Here's the daly view of the top itself, which already broke support once.

 The last update was at the white arrow, the next day PNFP just barely broke through resistance, on the same day if fell back below. The daly volume was lower which is not good for a breakout day.

 However the bar in which PNFP fell back below support had a huge surge in volume seen at the red arrows. This 15 min 3C chart has remained in a deteriorating position since.

 On a 10-min chart here's a look at the breakout with a negative divergence (false breakout) and the negative divergence on a subsequent attempt at resistance the next day.

Right now PNFP has found a little support and could bounce a bit, I would consider PNFP a short on any strength at this point. I would prefer an initial wider stop around $16.50. The first target area should be around support at $14.65 or so. After that, $12 looks like a decent target. WIth market cooperation, that level could easily be breached as well.

INTC Short Trade Follow Up

 Recently INTC is caught in this tight range.

 The overall condition of INTC is poor as you can see by this 60 min chart.

 On a 15 min chart, every time INTC heads to range resistance around $23.20, there's a 15 min negative divergence, this means this is an area I want to consider shorting INTC or building a position there. 3C has recently deteriorated in to a new leading negative divergence.

There remains a chance that INTC breaks out of the range and heads to the $23.50 area, I would view this as an opportunity to add to the trade. If you prefer being patient and getting the best entry, you can wait and see if INTC can make such a breakout, which will almost certainly be distributed, however you may miss a drop in INTC if the market can't lend enough support to INTC to make such a breakout. The third entry option would be to go short INTC on a break of support in the $23.75 area, that would be the highest probability trade, but you'd give up the better positioning of the two previous entries. With INTC only about $.50 from the potential breakout area, I don't view this as a risky trade. INTC's first stop on the downside should be around $21, I doubt it will hold, but I would expect a consolidation/bounce in the area.
 Ultimately, INTC should be able to hit the $20 and there's a good chance, with market cooperation that INTC moves in to the mid to high teens area.

Either way, the market continues to deteriorate, we'll be lucky to see the SPY/DIA breakout that I have been looking for at this point. I would use the market's position and lower risk trades like INTC to shift my portfolio from a neutral to a net long position, you don't have to swing for the fences, but I would certainly want my portfolio leaning to the bearish/short side at this point. Initial stops should take in to account the possibility of the DIA/SPY breakout, which would mean in the case of INTC, a breakout possibly around $23.50-that calculation would certainly be part of my risk management planning and position sizing as well as the construction/accumulation of positions