Wednesday, June 27, 2012

UNG Follow Up

As you probably remember I've been expecting a pullback in UNG based on the 3C signals and based on experience with breakouts from base areas. Today we saw what appears to be a pullback under way. Tomorrow at 10:30 we have the EIA natural gas report. The report 2 weeks ago sent UNG up +14.95% in a single day so there's always the possibility that the report tomorrow could send UNG through the resistance area that seems to be defining UNG's base. On the other hand the report could be the catalyst to a deeper pullback.

 UNG could be a possible inverse H&S base; the two shoulders at the white arrows and the head at the red arrow. If that's the case, I'd expect a small pullback, UNG to see strong positive divergences rather quickly in to the pullback and then a move through resistance which would bring UNG to stage 2 mark up and would attract the attention of a lot more traders, which drives price up quickly, that's why it's called "Mark-up".

 This could also be an ascending bullish triangle, in that case the pullback would likely be a bit deeper and I wouldn't expect to see any signs of accumulation initially, but later as UNG pulls back closer to their target zone.

 Today's move saw pretty heavy volume as several areas were stopped out. Note that UNG traded just above the breakout level, I'd expect to see heavier volume as traders buy what they believe to be a breakout.


 You can see that heavier volume this morning on the move above the breakout level to the left, then you can see the morning range's support broken on heavy volume and finally yesterday's intraday high taken out with another surge in volume. It must have been very apparent to the middle men as to where the stops were as they have the book, but I and most of you could have guessed where traders would most likely have placed their stops.

 UNG 30 min uptrend shows distribution at the first approach of the resistance level and again as we moved toward the same area, this is why I expected a pullback and being the signal is on a 30 min chart, I'd expect the pullback to be deeper, perhaps the ascending triangle pattern mentioned above.

The 15 min chart with the same negative divergence. The reaction to the EIA report will give us a better idea of where UNG is headed, but it will likely make for a good buy/add to, unless of course we get another huge day on the Nat Gas report which I feel is not likely.

The EOD divergence

As posted in the last market update, there was a positive divergence showing on the 1 min charts, we can now see it was a simple end of day move higher.

From the last market update...
Note how the divergence on the IWM 1 min chart is during a flat area of price action between 1:45 and 3 p.m.

The result...

The IWM makes a new intraday high.

While this shorter term information may not be useful to everyone, I'm very happy to have received several emails from members who have been using the market updates to make quick trades, or to use them to enter/exit trades. The entire reason I first started the model portfolio was to show members how the market updates alone could be successfully traded without an actual trade idea going out.


Chart Request for BAC & Financials

As I have mentioned many times, most people go about looking for stocks/trades completely backwards. They don't say, "A rising tide lifts all boats" for nothing. The fact is the overall direction of the market has the most influence on the majority of stocks, second most influential is the industry groups behavior or what we call sector rotation. However most people look for a trade without understanding the market's most likely path. The first thing you should do when looking for trades is understand where the market is and where it is most likely going, then you can align the correct sector and the correct stock with the market and your probabilities of a successful trade go way up.

So as for BAC and Financials, I wouldn't expect to see anything too different from the market analysis already laid out, an overall bullish tone recently, but within that a likely pullback before a continuation higher. I'd expect to find similar signals in BAC and Financials.

Lets look...

 BAC 1 min chart -negative divergence

 2 min chart showing a current negative divergence, again suggesting a pullback.

 However the 2 min chart did not bleed through to the 3 min chart which is still leading positive, this may indicate that BAC and perhaps Financials in general outperform the market on a relative basis. A pullback may create some second chance opportunities in BAC and other Financials.

 The 15 min chart never really saw much of a negative divergence at the June highs, there is a small one, but I'd say the underlying action looks closer to confirmation of the price trend, meaning that BAC pulled back simple because it was following the market as outlined at the start of the post.

In fact, lets take a quick look...
BAC in green and SPY in red; you can see clearly that BAC was just moving with the market, in fact the relative momentum shows BAC acted better as it didn't make as sharp a low on 6/21-22, nor did it on 6/25.

 Finally the 60 min chart of BAC does show the negative divergence more clearly at the recent highs, but it is a relative negative and not a leading negative (the less powerful of the two). There was a relative positive that turned in to a leading positive in BAC, so overall I'd expect BAC to perform similar to the market, it may even show better relative strength.

As for Financials as a group...

 The 2 min chart shows a clear negative divergence, again suggesting a pullback

 However like the market averages, the divergence has not migrated to the longer 5 min chart, which in my view would imply that the pullback is not very serious. Early today I mentioned that smart money almost always accumulates in to flat price ranges or falling prices, it is VERY rare to see them chasing price higher, typically if price suddenly moves higher on a fundamental surprise, smart money finds a way to create a pullback or shakeout at which point they enter the trade.


Financials 15 min, after seeing a negative divergence creating a deeper pullback than what we'd expect from a 2-3 min negative divergence, is now leading positive above the former high.

Both BAC and Financials as a group also tend to confirm the signals we have been getting from the market since this a.m.

Market Update

The SPY charts that are first, are a more complete update as to expectations, as you know from the last post, I do expect a short term pullback, at this point there's nothing to suggest it is serious as it doesn't go beyond the 3 min chart in most of the 4 averages. I was waiting for the 15 min chart to start showing positive signals which would help us confirm what I suspected, that the move down since 6/19-6/20 is a pullback. In fact now even some 30 min charts are seeing positive action bleed through.

The rest of the charts are just the short term intraday for the averages as the longer charts all pretty much look the same as the SPY

 SPY 1 min intraday negative on the open and at the intraday highs, recently there was been a couple of positive divergences on the 1 min chart, I don't expect much from it, perhaps some movement in to the close.

 As you can see the 2 min chart has deteriorated more today, there's no sign of the positive divergence as the 1 min chart above shows so it can't be very strong. The deterioration in the 2 min chart suggests as I speculated this morning that there will be a pullback in the market.

 SPY 3 min chart tends to confirm the pullback

 The 5 min chart is nearly in line with price, it has a minor leading negative divergence, this timeframe is in line with a pullback.

 The 15 min chart is unaffected and leading positive, again this suggests the pullback is nothing more than just that which is normal, especially in this market with the volatility and choppiness. As explained this a.m., it would give the pros a chance to accumulate more in to lower prices as they very rarely chase prices higher.

 CONTEXT for ES also has diverged today, this is inline with the pullback scenario.


 The SPY arbitrage model shows a similar reading since today's open.

 ES has seen many more negative divergences intraday than positive, but we do have a recent positive as mentioned above.

 DIA 1 min, slight positive at EOD, larger picture is a negative divergence.

 2 min confirming

 3 min confirming

 IWM 1 min also showing the late day positive divergence

 The 2 min chart shows a bit of positive action at the last hour or so, but the bigger picture is the negative divergence confirming the 1 min for a pullback/consolidation.

 IWM 3 min

 QQQ 1 min-so far we have excellent confirmation among the 4 averages.

 QQQ 2 min

QQQ 3 min is longer than the above 2 charts, therefore more important for the short term trend and again this suggests a pullback/consolidation.

Quick Market Update

This will be followed by charts. Since my first market update post this a.m., I have suspected a pullback or consolidation move. I don't see anything that changes my mind about that, however very near term as in the last hour, there is a 1 min positive divergence on most averages suggesting a move higher intraday coming, it does not go much beyond 1 min so I don't think it is anything other than an intraday wiggle.

Charts coming next.

URRE Update

It's been a VERY long time since we've looked at URRE. There are two stocks or it may be better to say industry groups, that I do like on a long term secular basis, one is UNG or Natural Gas and the second is URRE or Nuclear Power.

For a long time we've been watching the changes in character in these two, UNG seems to be further developed, but at the time we had no idea why. I don't know for sure if this is the reason, but it sounds reasonable. A couple of months ago, long after we were first interested in the to, a new regulation was being passed that would cap environmental emissions on any new Electric facilities built in the US, that meant the only two sources of energy that would qualify would be nuclear or Natural gas. It seems even clean coal technology wouldn't pass the hurdle.

I view these both as very long term positions.

Here's what UNG looked like

 UNG's long term trend and change in character.

 UNG closer view, although it's difficult to say for sure this is the base and no more, it is less difficult to say these has every hallmark of a large stage 1 base.

 I tend to think UNG/URRE and some related issues are more than just a probable bull market, they seem to be more of a secular change in trend, meaning even longer term. Above is a curious chart of hOV, a homebuilder under accumulation during the 2000 Tech crash. After just having gone through the Tech revolution, who would have thought housing would be the frame to lead the next bull market?

Here's what HOV did since that rather small accumulation area pointed out above, approximately a 2500% return.


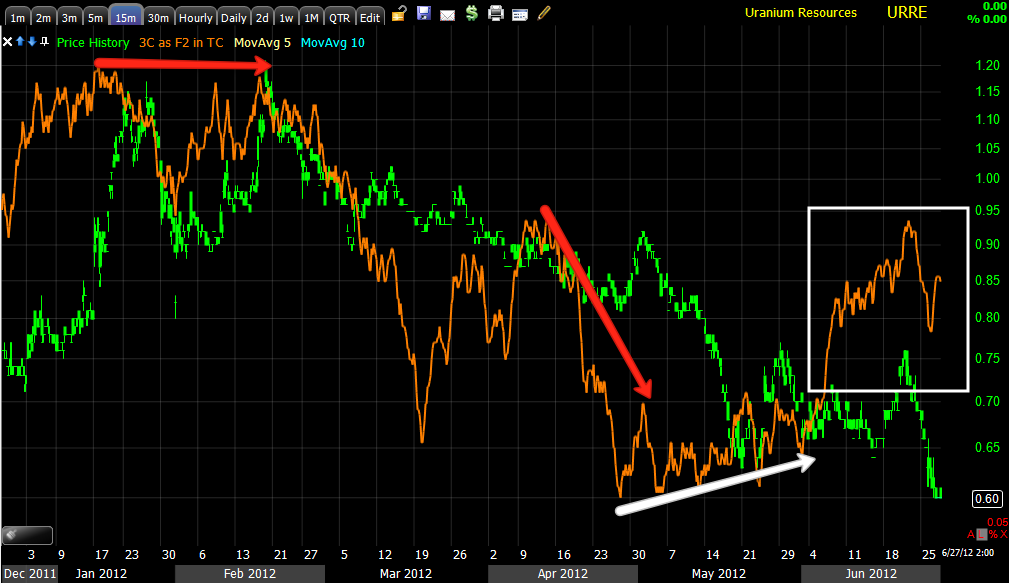
 URRE has the classic bullish descending wedge, last year we saw a lot of these and none of them acted the way Technical Analysis teaches. TA says when price reaches the apex of the wedge, there should be an explosive move up (for a descending wedge like this and the opposite for an ascending wedge), but we noticed that wasn't the case. Often there would be an initial head fake move in the right direction as you can see here in yellow, but every one of these whether ascending or descending always formed a lateral base or top (depending on the type of wedge) before actually moving in the direction the wedge predicts. If URRE holds true to that model we have seen so many times, then URRE should be building a base right now.

 A daily chart close up of URRE with a rectangle consolidation. A rectangle has no inherent bias unlike some other consolidation patterns, the preceding trend is what gives the rectangle its bias, in this case technical traders would consider this a bearish consolidation and expect a break below the rectangle which URRE has started to do. Of course we have seen MANY bear traps created this way and back in March-May, many bull traps as Wall St. takes advantage of the predictability of technical traders.

 The daily 3C chart of URRE in a positive divergence at the apex of the wedge and a leading positive as URRE has moved mostly laterally with a slant to the downside.

 The daily MoneyStream chart shows a similar leading positive divergence in URRE.

 The 15 min chart shows a recent small double top with a negative divergence and another negative around the start of May, there has been a recent positive divergence in the area of the rectangle.

 The 30 min chart shows virtually the same thing and the 15 min has bleed over to the 30 min.

 The 60 min is in positive position, but has not seen the 30 min chart's most recent move bleed over to the 60 yet. It's worth keeping an eye on as there may be a head fake move here to take advantage of.

 For those of you using 3C, note that I didn't use any charts below 15 mins., that's because URRE's trade is so spotty, on this 1 min chart there are plenty of bars with no trade at all, as 3C is a look back indicator this would give you inaccurate readings.

Even the 10 min only has a 1 cent trading range, this is not conducive to good reading with 3C, in these cases you want to try to stick with the longer term charts.

I'll set some alerts for URRE and see if this is an actual bear trap under the rectangle. Without the shorter term 1-5 min charts, it's more difficult to see what's going on.


Meanwhile in Europe

Other than Merkel's pledge there will be no shared liabilities (Euro-bonds) while she's alive (as Monti threatens perhaps a hunger strike next if she doesn't agree to something along those lines), we have the following out of the EU today:


  • EUROGROUP WELCOMES SPANISH REQUEST FOR FINANCIAL ASSISTANCE
  • EUROGROUP SAYS CYPRIOT RESCUE IS `WARRANTED AT THIS STAGE'
  • EUROGROUP SAYS SPAIN BANK NEEDS ESTIMATE AT EU51B TO EU62B
  • EUROGROUP SEEKS `AMBITIOUS MEASURES' FROM CYPRUS ON BANKS
Wow, it seems like the biggest decision the EU has made is to hire a new PR firm, "Welcomes the Spanish request for financial assistance"? This is the big domino that they have all feared may topple, but their press release sounds like a welcome to the Four Seasons. The actual amount of $62bn sounds low to me considering how things tend to spin out of control, but I've never even been inside a Spanish bank so what do I know?

 Cyprus, as was mentioned over the last few weeks, obviously wasn't kidding when they said they needed a bailout.

And why stop there?

Slovenia's PM said they may need a bailout next month.

From Bloomberg:

Slovenia may ask for an international bailout if lawmakers fail to adopt legislation next month that would limit public spending, Prime Minister Janez Jansa said in an interview with a local radio station.

“July will be the moment of truth since parliament will vote on the golden fiscal rule and on changes to the way referendums are organized,” Jansa was quoted as saying in an interview with Koper-based Radio Ognjisce. “If we continue to get more and more debt, we will see a Greek scenario here and this generation will have to pay dearly for the stupidity of those that have delayed decisions.”  

And the Euro's  reaction...

Since the 9:30 US open, nearly unchanged.

BIDU Follow Up

I started a Call position in the options model portfolio for BIDU last Friday using July $110 calls. All in all, I still like the position and intend to hold the call position. In fact I would even say the charts have improved signaling potentially a stronger trade than I first thought.

 BIDU daily, the yellow area is a head fake breakout from a large bearish triangle, this is where we shorted BIDU as one of the core short positions that are still open, in fact the BIDU short (no leverage-just a straight equity short) is at a 23+% gain.

 Shorter term I noticed this bearish price consolidation, in the last update Monday I said,

"BIDU has that same bear flag/pennant we are seeing everywhere. In the BIDU chart post from Friday I showed a chart similar to this and said,

"There's always the chance (even with BIDU moving up as I suspect) that we will see a downside break which sets up a bear trap. Recently with these price patterns the chances have been about 50/50 that there's a downside break first and then an upside breakout creating the bear trap. I'd estimate 10% of the time we see a Crazy Ivan which is a shakeout in both direction before the real move establishes itself."

That appears to be exactly what happened with BIDU, price did make the move and the 3C charts suggest it is a bear trap.

 Here's the break under the descending triangle, note the large volume on the break as many technical traders see this bearish price pattern and wait for price confirmation (a downside break) before entering.

 Here's where BIDU gets interesting. I originally looked at this a maybe a swing trade or some shorter term trade, in fact at the last update I said,

" BIDU had a positive divergence out to 15 min, it looks like a decent short term bounce or relief rally candidate, but as the positive divergences son't reach out past the 15 min chart, I don't consider it to be a longer term trade, thus the July expiration instead of August."


That has now changed as the chart above is a 30 min chart with a leading positive divergence, so it appears the trade is looking stronger than initially thought and this strength only developed once BIDU broke below the descending triangle, the area I talked about as being a potential bear trap.


 The 15 min chart continues to add to the positive divergence as BIDU is in a relatively flat range.

 The short term 3 min chart shows positive divergences increasing as BIDU pulls back near the $110.10 area.

The 2 min chart shows this same behavior, positive divergences near the lows and as price starts to move higher, a negative divergence to knock it back down where the positive divergences become even stronger.

We have a small positive divergence developing today in to the intraday decline, this is interesting because past positive divergences have been at lower prices, so BIDU is certainly worth keeping an eye on a it may be preparing to make a move higher very soon.