Tuesday, October 9, 2012

PCLN Follow Up / Trade / Add to / Risk Management

PCLN is one of the original 2012 core shorts (equity only, no leverage), others may have moved more including AAPL which saw a nice drop, BIDU was a great performer, but PCLN remains as a core short.

 PCLN was shorted at an average price of $761.79  putting it at a +18.89% profit. When PCLN dropped -17.28% in one day, I should have just closed the entire position and looked to reestablish it at higher levels like where we are now. In any case, there's room to add to PCLN (I don't recall, but I may have closed a partial position on that drop). I'm going to treat the PCLN add-to like a brand new position for risk management/position sizing.

The 4 day trend channel has in the past, held 1+ year trends in PCLN, it would have been stopped out of the long at the red arrow and the current short "Buy to Cover" using the same channel is $648.30.

I can add approximately $4k toPCLN so my risk including the profit already there is almost non-existient, but as a new position assuming a round $100k portfolio...

Typically I don't want to go over 15% of portfolio committed to any one trade, the days of Modern Portfolio Theory are long behind us. during the crash of 2000 in to 2001 you could have gone in to commodities and either hedged downside risk or you could have actually just been long commodities and made money while the rest of the market took a dive, these days however...

GONE!
 The market is more just "risk on" or "risk off" so I don't see a need for large diversity like the past if diversity serves no function.

The 15% general rule or about 6-7 positions, is really more for the one risk in the market that is difficult to account for, the gap.  Heck, take a look at the -17% gap down in PCLN in one day, with a 15% rule that would leave a loss of $2550 on portfolio value which is 2.5% of portfolio, a little more than the 2% rule I prefer, but still manageable.

I do have a tool for looking at gap risk, it's a custom screen in StockFinder specifically for gauging gap risk.

PCLN's biggest gap of the year up or down was 104.70 points, the day it fell it was 117 points, but that's as of the close, not the opening gap. It's pretty easy to figure out what the maximum reasonable risk is for PCLN, unfortunately pretty high at roughly 17% or about.

Looking at the Trend Channel as a stop the risk per share is $30.30 (stop at $648.30 and current price at $618= $30.30).

For a typical 2% rule, my risk money on a $100k portfolio would be $2000, divide that by the risk per share from the Trend Channel stop ($2000/$30.30=66 ) and you get 66 shares. However 66 shares of PCLN at the current price would be  $40,788 or nearly a 41% position size, way too much. A gap like we saw at that position size would have taken $7k or 7% in a single morning.

So the max risk is back at 15% of portfolio ($15,000/ $618=24.27 shares, you can round that to 24 or 25 obviously.

We still have the gap problem being bigger than 2% so in most cases my position size and risk would be figured out as above, but since we know PCLN is capable of these kinds of gaps, we'll use the $104.70 or roughly 17%. At $618 that's $105 per share, so $2000/$105 =19 shares which at $618 is $11,472 which is also below the 15% general rule, that's about the right position size for PCLN.

If we take out that extraordinary gap, most of the time the 2% rule is going to define risk so the closer you are to your stop, the more shares you can take on as long as you keep it at a reasonable level (for me that's 15%). This is one of the main advantages in being patient and letting the trade come to you, you get a better entry, you have lower risk and you can open  a position of optimal size.


Another Manufacturer Gets Hit & (Euro, USO, UCO)

AA beat but beat pretty low expectations, Cummings however did the worst thing possible and lowered guidance. Just like that song, "What have you done for me lately?", it's not about what you did, but what the market expects you will do and Cummings (CMI) said they expect to lay off 1500 people and lowers sales forecast by a billion dollars to $17 bn.

This is all part of a macro economic trend in the data if you just look past the headline number and read the bullet points of economic reports. Manufacturing has been in a slide for some time, at least since April and probably earlier, but seasonal adjustments masked the weakness.

CMI is down -4.23% in after hours. CAT is down -1.5% in sympathy.

Yet the Euro seems to be catching a little break from the downside.

The recent Euro intraday signals, the Euro has a positive correlation with the market including oil.

 It would be very interesting to see what USO (+2.83%) and UCO (+5.46%) could do on a weaker dollar as their performance today was nothing short os spectacular on a stronger dollar.

 Here you can see UCO's nearly 5.5% gain today came on dollar strength, which usually sends oil the opposite direction.

However the positive divergence in USO has been building all the way out to the 60 min chart as seen above, I'm not surprised it moved (That's why I opened the leveraged long UCO yesterday), I am surprised it moved so much with the $USD acting as strong headwinds.

AA Beats, the devil is still in the details

So after hours Alcoa kicked off earnings season with a top and bottom line beat above consensus. 

On the bright side, AA still stands behind their projection that aluminum demand will double between 2010 and 2020.

The company's CEO hit the nail on the head when he said to CNBC, 

"We see the aluminum market as fundamentally strong … but the market has forgotten the fundamentals and sentiment dominates the pricing" 

On the not so bright side,

2012 Global aluminum demand was cut by AA from 7% to 6%.

Excluding charges, shares earned $.03 vs a year ago at $.15.

Revenues were down 9% from a year ago.

As we have seen in one manufacturing report after another, the profit margins are disappearing, in many cases due to rising input costs of inflation; this was no different for A whose margin a year ago was 12.8%, this quarter, down to 4.8%.


Short Term AAPL Close / Long Term FCT Close

I was hoping AAPL would close the daily candle with a bullish reversal hammer on increasing volume, a very reliable reversal set up, AAPL did exactly that.


Today's closing candle a bullish Hammer with increasing volume, this is a very high probability upside reversal signal.

Also AAPL has some affinity for support along the 100 daily e.m.a., we saw AAPL find some support there today.

Longer term, FCT has been a reliable leading indicator for the market, typically on a larger scale of weeks to a month or more of divergence vs the SPX, however this is a shorter term divergence and has bearish implications for the big picture in the market, yet another reason I want to sell or short in to price strength as the big picture increasingly looks like the market has a downside move of some magnitude coming.

 FCT,  a leading indicator, clearly has broken down through the June low rally uptrend.

This is a negative divergence with the SPX which has not as of yet, since FCT tends to lead, the expectation is the SPX will follow, however as mentioned above, this tends to be a little longer divergence signal than just a few days, so a move higher in the market or bounce, is completely within the normal behavior.


Market Update/Leading Indicators

DO I love this market today? Do I feel strongly that is has added to the positive divergences from yesterday? No. I actually am pretty disappointed we didn't get a stronger pullback/consolidation to briefly send prices higher to short in to.

There was some confusion apparently among the algo's today that sent the Euro lower, it had to do with conversion rates of Spanish Yields. When Citi Analysts asked the Question, "Why did the Euro fall overnight?", they came back with a glitch

So why did the Euro fall? The best answer seems to be that the 10yr Spanish benchmark has changed from 5.85% Jan 2022 to the 4.8% Jan 24As a result some systems been showing the wrong Bund/Bono spread and players spooked when the "old" spread moved out by more than 30bps. 

There's also AA earnings tonight, the market has good reason to be nervous about earnings at these multiples.

In any case, the forward looking indicators...
 Commodity divergences with the SPX tend to lead the market

 As do divergences with High Yield Credit, positive vs the SPX.

The $AUD is also an excellent leading indicator as seen above, it's also positive in here, but this isn't an easy case to make.

AA will probably have more to do with the market than any indicator out there.

AAPL Calls sold

Today's $630 calls were a decent little trade, but more exposure than I wanted in AAPL long so while there was a decent profit for the day and AAPL is losing some ground, I figured now is as good a time as any to lighten the exposure load to AAPL long, yesterday's Calls remain, doing much better now than earlier today at half the loss.

 A quick 22% gain today in the calls was worth it, I'd love to hold them for more upside, but I decided any long in AAPL was going to sty at a reasonable size and adding today's position to yesterday's was getting beyond the level of risk I'd be willing to tolerate.


 AAPL 3 min -you can see the intraday negative divergence after 3 pm that is sending AAPL lower right now intraday.

 The 10 min chart still looks pretty good with a higher leading high that yesterday even though prices are lower.

What I'd really like to see though is some bullish reversal candle like a hammer which is still in place now with the increased volume, this tends to work very effectively for reversals (to the upside-allowing yesterday's calls to make money and setting up a short at a better level).

Selling today's AAPL $630 Calls

Charts to follow

Market Update

 The DIA 5 min still doesn't look good.

 The 10 min does look much better than yesterday, still there's no overall large scale accumulation so the original ideas about watching the market in a declining situation and see if there were to be large positive divergences signaling institutional money was buying in on price weakness and QE 3, is just not there.

 IWM since the downside reversal, the 3 min chart is above yesterday's range.

 As is the 5 min chart, still we aren't seeing large accumulation areas or periods, I suspect any price strength will be short lived.

 QQQ 5 min is in yesterday's range which is good considering the trade today.

 As is the 10 min chart.

 SPY 5 min since the downside reversal is also moving to a new leading high above anything from yesterday

 Here's a closer look

The 10 min chart is doing the same.


RIMM Update

RIMM is one of those stocks in which it falls in to the "Beaten up stocks looks better" rather than the "High flyers are looking worse" in a strange stock picker's market that I suspect has a lot to do with something the market hasn't been concerned about in many years, value. Look how AAPL and RIMM are trading almost exactly the opposite, even today.

My feelings on RIMM have been longer term positive as it builds a base and shorter term pullback before it can break out, I even wrote that yesterday and here we are today.

Lets see how it's progressing...

 On a 5 day chart the price ROC has dropped off dramatically, changes in character precede changes in trend, volume has also been looking better recently.

 On a daily chart, here's the base area I mentioned, it just looks too extended to me for a break out from yesterday' close, today a nearly 5% pullback.


 The 60 min 3C trend with confirmation on the trend down and a leading positive divergence at the flat base-like area.

 A close up of the 15 min chart shows exactly the negative divergence that suggested RIMM pullback, even though price alone made that look like a high probability.

We like to buy pullbacks as price comes to us, we get a better price with less risk, but it has to look ready, it has to show accumulation of the pullback.

 The 2 min chart shows the very early 3C timeframes are starting to show some progress in the pullback, STARTING.

At 3 min it is still in line and 5 min as well as 15 min is still negative, the 5 and 15 min charts need to see positive 3C divergence migration and then we'll know it's high probability that smart money is accumulating in that area, that's where we want to look at buying.

Definitely a long worth keeping an eye on though.

AAPL comeback

From down -2.29% to +.20% in the green today, the daily candle is shaping up for the volatility shakeout of the shorts mentioned earlier today. Yesterday's option position is looking much better, but still red, today's is 20% in the green.

 The daily candle thus far is a bullish hammer reversal candle and volume will be above yesterday's making this a high probability reversal spot.

The 60 min chart that shows most of the pattern, from negative at the head and leading negative coming off the head to a relative positive divergnece, this looks like the right area for a volatility shakeout of the shorts, some already probably hit today.

FB Update

Several months ago we saw a small move in FB and although some played it and made some money, it was obvious back then that FB was going to start a larger base, how large was the question. Now after a recent pullback, FB looks like the downside momentum of the pullback is ending and it will continue finishing up the base.

 The FB base

 In yellow was the accumulation from the first FB long that was very successful, this current 4 hr leading positive divergence is even bigger.

 The FB 15 min chart looks good on the pullback toward the bottom of the base and is leading positive.

 A closer look shows the current pullback looks to be ending.

 The intraday charts are looking stronger, the 5 min is in leading positive position.

And the 3 min timeframe, which should bleed in to the longer timeframes, looks excellent right here. If I were considering buying or adding to FB, I would certainly consider this area.

AAPL Charts

 I never short initial breaks of H&S tops or almost any top, if we can't get in at something like the head where the risk is lower, I wait for the volatility shakeout that almost always comes after shorts enter on a break of an obvious top pattern like this. The move would need to be above the neckline and usually then some to shakeout the initial shorts that chased the move lower, that's where I'll be looking to unload the Calls and looking at short entries in non-leveraged equity short position.

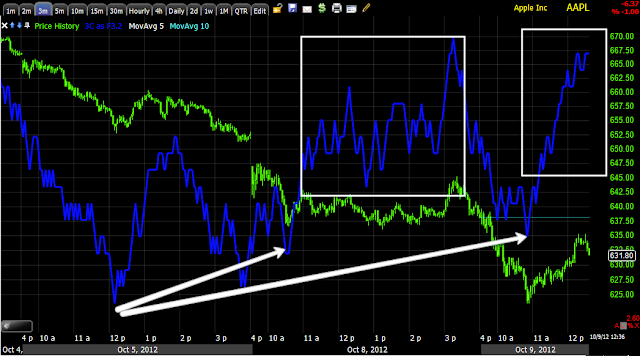
 The 3 min chart continues to improve, not just today, but as a continuation from yesterday.

 The same is true of the 5 min chart at a new leading positive high above yesterday's.


And now even the longer term 15 min is positive.

Going to Add AAPL Oct $630 Calls Now

Yesterday's position wan't very large in the calls, this will be a bit smaller. This pullback intraday is what I was looking for with the charts improving.

Charts coming next.

This is basically a small leveraged long for a move up to shakeout AAPL shorts (now, rather than a 3rd shoulder) and I'll be looking to close it out ASAP at a profit and move to the short side with an equitiy short in AAPL.

MARKET UPDATE

It is starting to look more and more like that flag pattern (bear) mentioned as a possible shakeout level yesterday, was hit as exactly that.

 SPY flag

 SPY 1 min is gaining more upside momentum

 The 3 min never really went under yesterday's range and is seeing leading momentum to the upside.


 The DIA was the ugly chart yesterday, it's showing the first positive divergence this week.

 The IWM intraday 1 min is leading positive above yesterday's closing levels.

 The IWM 3 min is doing the same so the divergence is migrating to longer timeframes.

 NASDAQ futures continue to improve as well.

 The QQQ intraday 1 min continues to improve

QQQ 10 min never left yesterday's range or dropped below, this is why this looks more like a shakeout.

However sentiment is definitely pessimistic and growing more fearful, I'll continue to hold open shorts and stick with the plan from Sunday, short any price strength.