Wednesday, December 3, 2014

Daily Wrap

While Friday's NFP is certainly the most important US macro data for the week, tomorrow's ECB meeting is probably one of the most anticipated events since the F_E_D ended QE, with the expectation among the "Buy the Dip " crowd or the "This time it's different" crowd, being that the ECB will pick up where the F_E_D left off, and run with the sovereign bond QE purchases, despite the fact it's against their charter. UYou'll get no argument from me that something needs to be done with the deflation monster, but ever since I can remember expectations being set, they have been set for the ECBat least making a clear hint of QE at the December meeting (tomorrow). However there seems to be a stand-off between Eu governments the ECB wants to make reforms that it believes are necessary for QE to be of any use (did I mention it is outside their charter?) and the governments themselves unwilling to make any changes, but of the opinion that Draghi should do his job regardless (despite the fact his job doesn't allow for sovereign QE). Recent Draghi and Constancio dovish comments and a lot of them have many thinking some kind of hint will at least be dropped, kind of like, "We're hiring Black Rock to advise us on sovereign QE purchases". However nearly all dovish comments made have plausible deniability, like Draghi recently saying they want to get inflation expectations back up to 2% ASAP, well the market takes that as QE is imminent as it has a tendency to cause inflation, however he's making a common sense statement that the market or elements of the market choose to interpret as QE and Draghi seems to be fine with that, his hands are still clean, he didn't say anything about QE in that statement.


The BOE also has a rate decision tomorrow, it is largely expected to be a non-event and I think there's a bit of a sneaking suspicion that the ECB meeting may also be a non-event, in which case it might actually be quite a market moving event. We'll see, but beware the knee jerk reaction as always, even though the half life of Draghi knee jerks reactions is down to about an hour now.

As for the market today, it's almost like "Second verse same as the first" with IWM outperformance as well as Transports again and NASDAQ underperformance again, but if you saw this morning Update, you can see why, there was simply no positive divegrence in NASDAQ futures unlike Russell and SPX futures, this is why I suspect the NDX's final chance to rotate in is left on the shoulders of AAPL and as far as I can tell, the AAPL charts are deteriorating much quicker and more dramatically than I expected as I was looking for a price/risk concession with a bounce in AAPL to short in to because it didn't have severe negative divergences, but that has changed over the last 2-days and if it gets much worse, the topic may have to be revisited.

The R2K managed to fill Monday's gap today, but both the NASDAQ 100 and Transports (believe it or not) still haven't filled Monday's gap.
In fact, looking at the daily closing chart of Transports above, considering how clean the "Shooting Star" reversal candle (yellow box) was and the following confirmation candle, it almost seems highly probable that the Dow-20 could put in a "Falling 3 Methods" consolidation/bearish continuation pattern. The only thing needed would be a real body (open to close) that remains within Friday's large bearish downside candle like the yellow one I drew in. This is a fairly common candlestick pattern, essentially a bear flag that ends as a bear flag should.

It's not as if the long term charts aren't there for such a move...
 60 min Trannies negative which is why I have left the IYT short open and on the shorter end of the scale...

The bounce divegrence is fading to negative as well, timing!

For more on Transports chart/set-up see yesterday's post covering them in greater detail...
Transports Trade Set-Up / IYT

I am a bit surprised we didn't have worse performance today considering the Dominant P/V relationship yesterday was the direct opposite of Monday's, not quite as strong, but still impressive.

Today we have no Dominant P/V relationship at all. We have 7 of 9 S&P sectors green which could be construed as slightly overbought , but yesterday it was 9 of 9. Today Materials led at +1.47% and Consumer Staples lagged at -.71%.

Of the 238 Morningstar Industry/Sub-Industry groups, 181 of 238 were in the green, that's close to yesterday. Still I would not call it an overbought condition, at least not next to yesterday's prints.

However it does appear to be quite clear that the levers we predicted that would be used for an oversold short term bounce on Monday, Meet Your Levers, which included USD/JPY (JPY pairs) TLT, Yields HYG, VXX, VIX and SPY Arbitrage, which all have been used yesterday and most today, are giving out and giving way.

I probably don't need to post the $USDX and Yen charts re: the USD/JPY pair (If you want another look at them, they can be found in the A.M. Update).

In fact the USD/JPY didn't ramp Index futures overnight like they did Monday overnight in to Tuesday morning, they didn't even have a correlation until the North American cash open and that only lasted until around the European close.
The US open (green) and European close (red), otherwise ES (purple) was disconnected from the USD/JPY, however EUR/JPY seemed to be a better match, (recall I said that the levers would include "JPY pairs") as there's some apparent trepidation before tomorrow's ECB meeting causing the EUR to lose ground vs the $USD. However as mentioned regarding levers, there are negative $USD divergences I expect to bring USD/JPY down, perhaps EUD/USD as well depending on the ECB tomorrow.

Also among the weakness witnessed in levers...VXX...
 VXX acted better than it should have,especially at the close where the SPX ramping in to the last hour "should" have sent VXX well below the red trendline.

You can get a lot more on the VXX lever update in today's post, Levers Update


 VIX (spot) was hammered at the close, just like yesterday, nothing new there.

However, despite the fact I'd much rather see the VIX close BELOW the Bollinger Bands and then back inside, a strong upside signal, the fact remains we have a buy signal and only 3 signals in a year and a half in VIx, the last two were right on and in addition we have pinching volatility via the Bollinger bands indicative of a highly directional move (90% to the upside, which means the market moves the opposite direction).

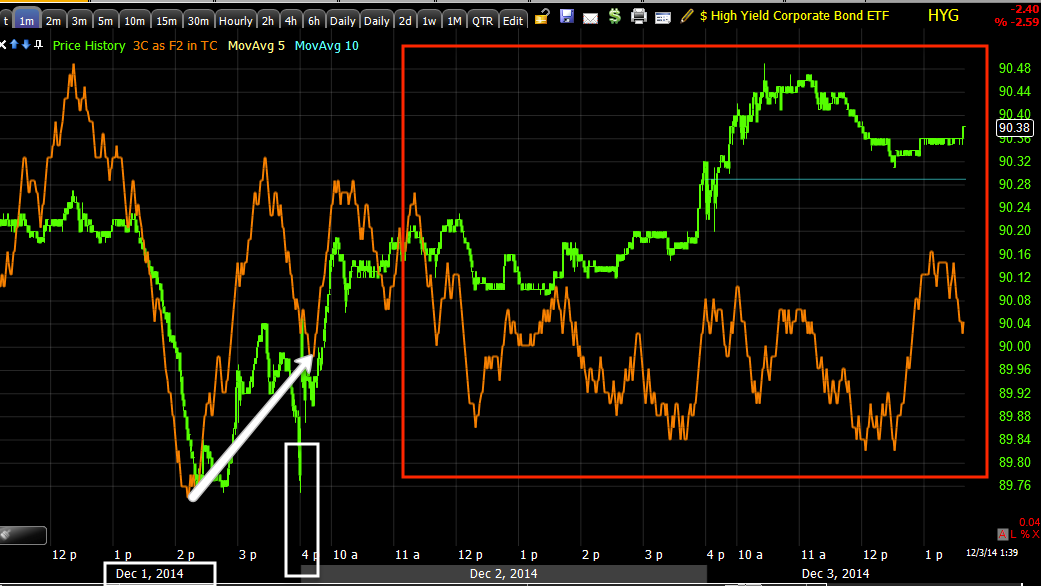
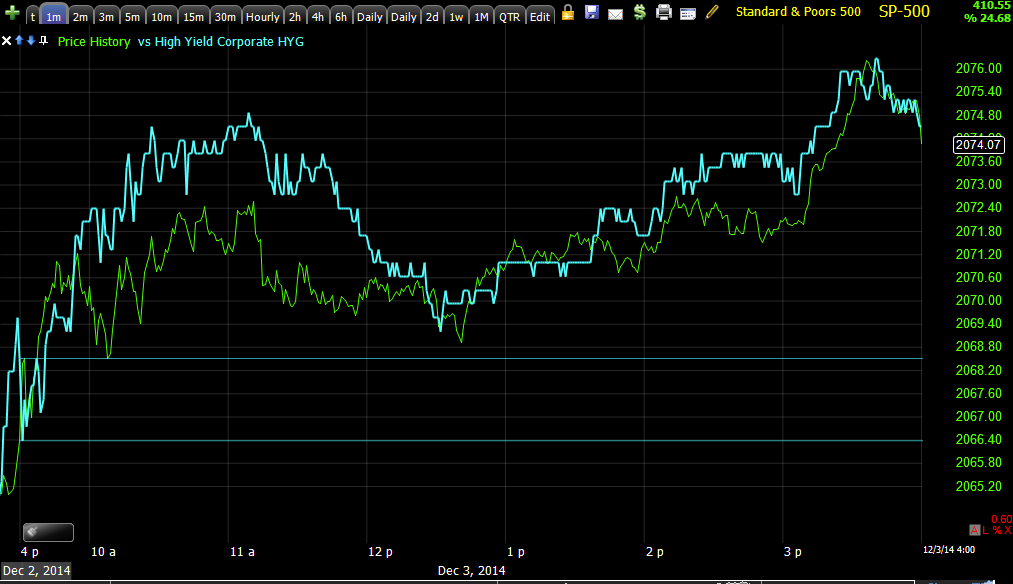
As for other levers, they were also covered in Levers Update today, but for a closing update, HYG High Yield Corporate Credit ...
 HYG appeared to support the SPX intraday near perfectly, but take a step back and...

HYG's support is falling off rapidly since the Monday morning flame out or short term capitulation event that produced this bounce as seen above in the SPY, DIA, QQQ and IWM charts. When we have HYG divergences, it's best to heed them. Look at the last one Friday and what it led to.

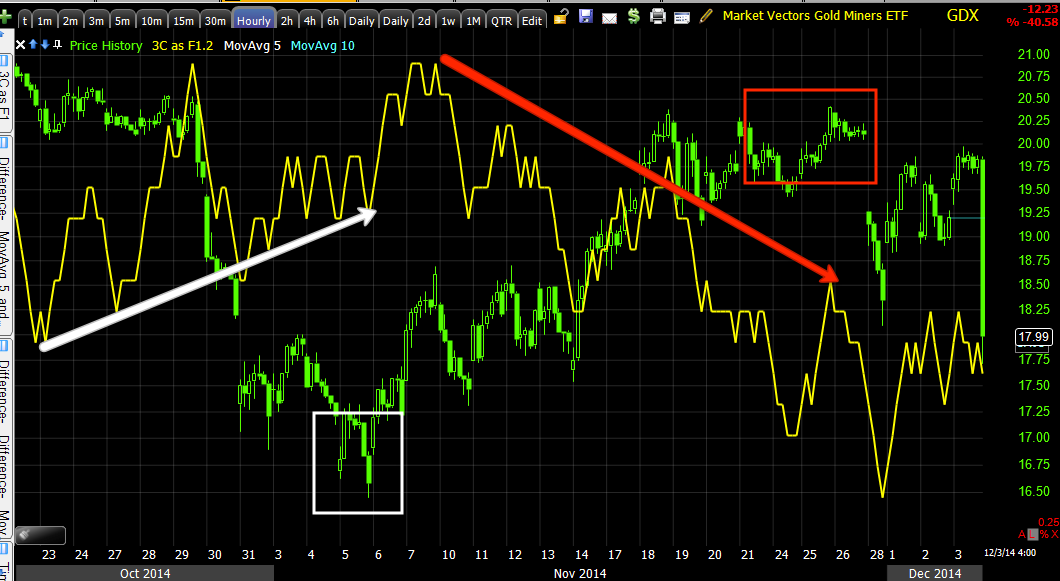
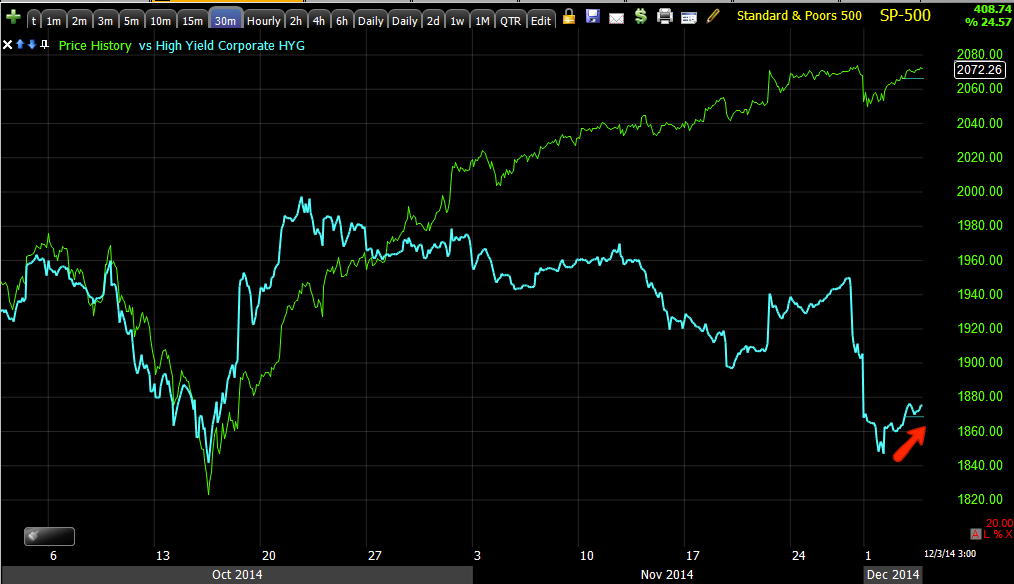
If that doesn't move you, how anyone can ignore the big picture HYG divegrence is beyond me, we rarely get these jewels of Leading Indicators and never have gotten one that screamed like this.

 HYG's 5 min chart is what I said I'd be watching for its failure and today it started a clear negative.

 Meanwhile the intraday chart was even more clear as to its distribution.

The non-,manipulated (not a lever) High Yield credit is also SCREAMING and this doesn't happen often... 
HY Credit selling off through the day today,  ask yourself why institutional money would be selling a risk asset if they thought there was something to this bounce or even the larger stage 3 top area?

 Again HY Credit gave warning Friday for those watching it which led to Monday's sharp decline and it's no better since, just much worse.

On the entire October trend, you can't ignore this kind of divergence between risk assets (HY Credit and the SPX).

PIMCO's High Yield Bond Fund is also giving similar signals with a warning Friday, a bounce yesterday and a warning today.

TLT I covered today, but it's another lever giving way...
 First it dropped sending yields up as predicted as a lever to help the market, but as of today, that's over...

Take a closer look...
 TLT rallying wit the SPX, a Flight to safety Trade which changes the lever of yields and their dynamic.

TLT's longer and shorter term charts are now coming together in positive divergences and I expect additional upside which is why I posted the TLT long trade idea today, TLT Long Also Looking interesting here

The effect on yields which tend to be a magnet for equity prices was as follows...
 AGAIN the 30 year yield warned clearly as it diverged with the SPX Friday, this is why I was so shocked as there was so much action Friday when I thought it would be a quiet day.

As TLT fell, yields lifted supporting the market yesterday, but today as bonds started to come back...
Well you can see Yields now leading the SPX lower intraday, which I expect to continue. The 30 year yield closed below 3% today.

 Another lever bites the dust and with VXX, TLT and HYG out of the game, so is the SPY Arbitrage.

Pro sentiment sold of in to the day as well, especially the close...

Again if you were paying attention, this Leading Indicator gave warning Friday as to what was coming Monday morning and now it's even more clear with a much larger divergence than this (what you see on the chart above-I'm just trying to deal with specific timing of the oversold bounce/gap fill).

As mentioned above, there wasn't much to internals today, the Dominant P/V theme, maybe a little something to the S&P and MS sectors. Mostly it's the very same leading indicators or more specifically levers that were predicted to be the support mechanism for an oversold / flameout Monday morning that are now turning away from that support with most having filled the gaps except Trannies and the NDX which was our initial contention, at least the gap would be filled.

I'll be checking futures again tonight as usual and will post anything that pops up. As these signals are getting much more clear (2 days ago I wasn't sure what TLT was doing and knew it needed a little time to straighten out, today it's clearly doing what was expected), the signals for trades in assets are much more clear. You probably have a pretty good idea of what I'm looking at and I know exactly what I'm looking for.

Have a great night, again, if I see anything standing out in futures tonight, I'll post it.

Index Futures Into the Close

Obviously there's a lot more to the market than just index futures or the averages, especially when it's so weak it needs multiple levers to push it up and still can't get a decent close on the NDX. Thus we have to look at more than just index futures to come up with a composite picture, but they were somewhat striking in to the close, although not particularly a chart (12 min) I favor overnight, I do wonder what the 5 min charts will look like in the morning, especially with the ECB tomorrow morning.
 ES/SPX futures leading negative since about 3 p.m.

 NQ/NASDAQ 100 futures leading negative

TF/Russell 2000 futures leading negative

GLD / GDX Strangeness Into the Close

Before the close I posted Holding GLD Short which is down -1.72%, it was up quite a bit more putting the position at a bit more of a loss, but what I consider to be objective evidence, the charts, told me the probabilities were best (for now) holding GLD short.

While I know that GDX (Gold miners) are not exactly the same as GLD (gold), they do share a tight correlation and about a decade or so ago, Gold miners use to actually lead gold, you might say in a way they still do. Remember this is short term trade perspective I'm addressing because I actually think there's an impressive year long GDX base that could lead to a secular bull market in the PMs and miners.

 GLD (green) vs GDX (red)
On a daily chart you can see miners (red) and GLD (green) share a pretty tight correlation.

Some might even make the argument that like in days of old, gold miners still lead gold. For example this 60 min chart of the two show gold a bit more enthusiastic than miners and miners turned out to be right in retaining a more "guarded" position.

 On a 15 min chart you can see a pivot high in which gold miners (GDX) were once again less enthusiastic than GLD, failing to make a new higher high before both rolled over and once again recently in which gold went for what looked like a breakout move, but miners refused to confirm ending the move for GLD.

 Near term on a 5 min chart we get a closer look at GLD's enthusiasm for an apparent breakout attempt and GDX's more sanguine approach of not making a higher high, thus for now, a failed breakout attempt in GLD.

 So given all of the above and my post, Holding GLD Short , what might we make of the last 2 minutes of trade today in GDX (red)?

Here's GDX intraday on a 1 minute chart, that's quite a decline during the last 2 minutes of the day.

As for the 3C charts, perhaps there's some explanation here as we look at GDX. Since a small positive divegrence on a 60 min chart, GDX's move has run in to a 3C negative divegrence (red).


 In similar fashion the 30 min GDX chart also ran in to a similar negative 3C divegrence just before getting volatile and today's closing 2 minutes.

 Even the 10 min chart shows a negative divergence followed by a gap lower and a leading negative divegrence lower in 3C.

 Of particular interest, it seems "someone " knew what was going to happen at the close as the 5 min 3C chart is in a leading negative divegrence the ENTIRE day!

And the more detailed 1 min GDX chart is also in a leading negative divegrence the entire day, IT SURE LOOKS LIKE SOMEONE KNEW SOMETHING ODD WAS COMING AT THE END OF DAY.

USO-Short Squeeze Bounce Long Looks Interesting

Although I'd prefer a head fake move below $25.25 in USO, I think it is looking very interesting for a SPECULATIVE long, short squeeze based bounce.

I'll get some charts up and as I said, I'd prefer to wait for a head fake/stop run below $25.25 to make my entry, but other than that, both it and Crude futures look ready to make an upside move, Short Squeeze I'm guessing.

TLT Long Also Looking interesting here

We have a current TLT long position, it doesn't have enough leverage/beta so I used TBT (2x short TLT) and shorted that, effectively creating a 2x leveraged TLT long which is near a 2.65% gain and I believe TLT is about to make a move higher which is also bad news for the market.

In any case, it is TLT long that I like, as mentioned I shorted TBT to arrive at a 2x leveraged TLT long position.

UNG long Looking Interesting Here

For those looking for a tight stop, a stop on a closing basis could be put under today's intraday lows and you have very little risk. On the other hand, this looks like a solid head fake move in UNG. I'd caution you about volatility tomorrow morning as Inventories are released, thus the stop on the close.

This is a long term favorite, long via UGAXZ-3x long Nat Gas or UNG.

Holding GLD Short

I'm not convinced this is a big downside trade, but with SLV also showing negative divgerences and GLD as well as YG/Gold futures, I think at least for the near term there's a better exit and if there's more, we'll take it from there.

This is not an asset I'd call out as a new position right now. I think with a day's of patience you'll have much better opportunities.

AAPL Position-Staying Patient

For the second day the Q's have been the laggard, I think the only thing that can change that is AAPL and I had an original trading plan for AAPL, "Plan your trade, trade your plan".

Looking at the QQQ, it's in a very dangerous downside spot, but I think a little patience here won't kill anyone.
 QQQ is forming a daily Hammer (bullish) candlestick and it's due for rotation as TECH is as well. It looks to me as the QQQ will close on higher volume today than yesterday making that hammer 3x more effective and probable for the Q's to rotate in. I think their best chance is an AAPL pump and after 2 days of lagging, I think the invisible hand has probably come to the same conclusion.

Although the yellow box in QQQ is an absolute short sellers dream, we still want the best entry and lowest risk (it sits on top of a broadening top- a head fake move.

Unless AAPL's charts just can't be ignored, I'm going to play the plan and wait for a move above the triangle's apex or above, that's where I want AAPL short, where the risk is worth the reward and that's also where the Q's get interesting. So for today, patience.

Quick Market Update-Time to Short?

I think so, ES, NQ and TF are all seeing strong, fast intraday leading negative divergences, much stronger than you think. I'll be looking at potential trades, I like broad market trades (short) like SPXU, SRTY, SPXU and FAZ in general, I'll be specific though. I'm personally holding SQQQ, SRTY and FAZ long which is 3x short QQQ, SPY and XLF/Financials

Leading Indicators

I've seen enough that I feel reasonably justified in calling out short trades in the area after looking at the averages, the futures, t=he levers and now Leading Indicators which I'll make brief.

VXX is outperforming the SPX today, there's a clear bid under protection if VIX futures as someone is certainly concerned about downside as you saw from the long term 60 min VIX futures charts along with shorter term.

VIX is performing in similar manner.

HYG was in line intraday until 12:30 when it started lagging the SPX quite badly.

As for some HYG charts you need to see...
 While HYG may be supportive intraday, on the bounce for this week, don't be fooled, it is still very disconnected and overall negative, not enough support in HYG, smart money pulling the levers will not commit that much to HYG as a failure would cost them a lot, just enough to support the market.

 Of course on a longer term trend since October lows, HYG is SCREAMING SELL as it is severely dislocated from SPX.

Other HY Credit is also selling off, this type is not used as a market lever and thus is more "Honest".

If smart money believed in this "bounce", why are they selling risk assets like the plague?

Here's PIMCO's High Yield Fund, it saw selling in to the fall before Monday and again now.

Pro sentiment (both indicators) are selling off, so pros aren't buying this either, exactly what we expected and wanted when I said this bounce was a , "Gift Horse".

 Pro sentiment vs SPX selling off.

I still think that even though the correlation between commodities and the SPX is nothing like it was in QE 1, this severe divegrence is important and at least shows the market believes global growth is in big trouble.

And Yields which have been supportive as a relflex from lower TLT prices as a market lever are now moving down as TLT and bond futures are gearing up to end their lever/market support and move back to the Flight to Safety Trade.

I'm actually amazed there's this big of a divergence in yields vs the SPX today all things considered as they were supportive yesterday. Remember , yields move opposite treasuries and they are like a magnet pulling equity prices toward them, here DOWN.

Now for some assets...

Levers Update

These are the assets we predicted would be activated Monday, Meet Your Levers, posted just over an hour after we saw a short term selling climax Monday morning which can be seen in this 11:27 a.m. Monday post, Market Update .

From that post, a quick concept that is useful in any asset and any timeframe relating specifically to Monday morning's action...

*In the context of an IWM 2 min chart*

"And the 2 min IWM is starting to build it's intraday positive, note all of these occurred AFTER the volume short term capitulation, so this is a macro/micro concept that can be used on any timeframe, it's especially effective on longer timeframes with bullish reversal (or bearish reversal) candles, such as the 60 min chart I showed earlier this morning."

As for the averages or at least the ETFs, there's some interesting behavior as large volume is not only a sign of a short term selling climax, but in the right conditions can be indicative of a churning/distribution top event. After Monday's selling climax we expected a bounce and at least a gap fill to follow...

*This post probably has a lot more charts than necessary, but I think it's essential for you to be able to identify when the levers of market manipulation are being used, when they are failing and what the message of the market is when the market can't get off a simple bounce/gap fill without the help of outside manipulation. Some may want to come back to the post later and for those who do, the bottom line is USD/JPY has already been shown to be set up for failure. HYG is seeing distribution, but it's not at the point yet in which I'd call it "OVER", although as a leading indicator we may gain more information. TLT/Bonds are interesting and maybe that TLt post will be able to be put to paper soon, it seems there's a reversal getting ready to take place there as well and VIX futures/VXX and VIX are also improving at a rapid clip. Some of the larger picture charts have additional information relating to 3C targets and more.

The averages and their selling Climax Monday morning...
 DIA with the climax (white), the gap fill at orange and recent flat trade with increased volume, often indicative of churning/distribution.

You can easily see using ROC applied to price, the divegrence in DIA's ROC as volume increases today with little upside, a hallmark of churning, a bearish event of smart money handing off shares to dumb money.

 IWM with 2 capitulation events Monday, the last at the close, the EXACT same time HYG was first accumulated as a lever to help. The increased volume is on a break above gap resistance, useful in distribution as demand for supply is high.

 QQQ capitulation, also note the long lower wick of the candlestick which makes the event multiples more likely to be a short term climax/short term low.

Since, Q's have done VERY LITTLE.

 SPY climax (white), gap fill in orange.


VXX-Short term VIX futures which are knocked down to push the averages up as well as activate the SPY Arbitrage market manipulation lever.
 2 min VXX shows the previous positive leading to a move higher, but also the 3C concept of where a divegrence is first seen. If you were to go long VXX where this divegrence was first seen, you can almost always count on a move that easily hits the target and often surpasses it by 100% or more.

The current leading positive divegrence now on the pullback is even stronger than the last positive.
 VXX 3 min essentially the same.


VXX 5 min showing a head fake move which we often see just beofre a reversal (up or down), in this case a failed breakout, other times they are stop runs.
Again we have a current leading positive divgerence.

I use multiple timeframe and asset confirmation, so here's the 2x leveraged VXX long, UVXY 5 min chart...
 It looks almost exactly the same.

Additionally the inverse of VXX, XIV which trades WITH the market.

It is confirming with a current leading negative divegrence

 At 10 mins, the last positive divegrence seen on the charts above at #1 is not seen here, it was not strong enough to make it to the 10 min chart, Likewise the negative at "A" is not as big. The leading positive at #2 is much larger than the last positive as it leads.

XIV (opposite of VXX) confirms.

And the long term 60 min VXX positive.

Even in futures, VIX futures are going positive.

 VIX 15 min futures positive

VIX 30 min futures positive

As for HYG, the lever that is used to move the market by moving up, fooling algos in to thinking smart money (whom trades HY Credit as a risk asset) is in the trade...
 Shows intraday distribution in to highs and some positives as it backs off, but it is above yesterday's close which is all that matters to the algos.

The same 1 min chart in context doesn't look so good. Note the closing accumulation on Monday near 4 p.m. just before Tuesday bounce?

 HYG 2 min also starting to lead negative, not good.

The 5 min chart showing HYG's collapse in to this week and about in line on the 5 min, this will have to go negative , but can happen quickly, within an hour.

HYG's long term 2 hour chart with distribution at EVERY pivot high and a new leading negative 3C divegrence low.

finally since we already have seen USd/JPY, TLT and 30 year Treasury futures. I was wondering about the longer term TLT, whether there was to be a convergence trade short bonds and SPX until yields and SPX met, or perhaps oil producing countries selling T's to sell dollars to support their collapsing currencies, I'm still not sure, but the TLT charts are looking a lot more close to being resolved toward a positive move up or Flight to Safety and Futures are agreeing.

 TLT intraday 3 min leading positive in a flat price range, a common accumulation/distribution area that looks boring  from a price perspective, but is often one of the busiest areas from an underlying trade perspective.

 The 10 min chart leading positive, finally starting to answer some of my longer term questions.

And the 15 min chart doing the same as it migrates to stronger timeframes.

30 year Treasury Futures agree...
 A SHARP move higher in 3C on the strong 15 min chart, like a hige buyer came in all at once.

And that's reflected on the stronger 30 min chart.

In essence, the levers are doing what they should, they are in their reversal process which will end support for the market making timing much closer.