Friday, June 22, 2012

3C was right about GLD

I'm glad I exited the remaining Put positions for GLD when I did, I took a look at the fill and the position actually made 40%, but from where I closed it, GLD gained a point intraday, so I doubt I would have had the same profit had I not closed it, that just goes to how how useful ROC can be as well as 3C.


GLD intraday from where I closed the last of the Aug. $160 put position.


XME Reminder

I had an email today asking about metals miners and XME in particular, so it seems like a good time to remind you about XME. I posted analysis on XME June 12th (XME Request)

I liked the ETF, I still like it. XME has improved further since the last update, so this is one to keep in mind on the long side.

 This is the day of the last update.

 The 5 min chart has improved.

 So has the 15 min chart, notice positive divergences every time XME hits support.

The only thing I warned about is support being obvious and as a rectangle consolidation pattern, the bias is that of a continuation pattern because of the preceding downtrend. Therefore a move below support is likely a head fake move, almost certainly a low risk/high probability entry as well. I just don't know if XME is popular enough to have short order posted below support.

Just one to keep on your radar.


BPZ Update

This was today's BPZ update which I reiterated that I still liked the long position and would stick with it as 3C looked like the move below resistance on one of these descending bearish triangles we have seen so much lately, was in fact a bear trap. BPZ was at a slight loss at the time at $2.26, today it closed at $2.37, up +10.23% (now in the green) and above the resistance area that looks to have been a bear trap set up.

A really nice move at the EOD pushed BPZ through resistance.

If there's any point to this post, it is that PRICE IS DECEIVING. Compare, look where the others didn't, that's where you'll find your edge.


Risk Asset Update

This layout has a lot of leading indicators and is excellent at showing or confirming the trend expectations through divergences.

A couple of days ago when I was expecting a pullback, I had hoped that we'd get some positive divergence on this layout which would increase the probabilities of more upside for the sub-intermediate trend, at worst, at least have confirmation. I'm pretty happy with what I see thus far.

 CONTEXT for ES is in a positive position, thus I would expect specific components in the Risk Asset layout to be positive.

 Commodities on this 5 min multi-day chart are in line with the SPX here, that's good enough.

 High Yield Credit held up well today, it didn't make the new high that the SPX made in the afternoon on an intraday basis, but the overall position is positive.

 Here's the positive divergence I hoped to see in to a pullback as HY credit is the big boys way of expressing a risk on posture.

 High Yield Corp. Credit looks good intraday.

 Longer term it also is in a leading positive divergence

 Yields acted well intraday

 Yields went from being highly suspect to jumping back in line

 The $AUD is nearly perfectly in line

 The Euro didn't make a new high intraday, I suspect that is why we were seeing some of the 1 min negative divergences in the closing hour.

Sectors today-all of the 3 main sectors I watch outperformed the SPX today-Tech, Financials and Energy.

All in all, I'm happy with the way things look here. The market is never going to make it easy to make money, luckily we have a lot of indictors that the crowd isn't looking at.

Market Update

Something is going on with the underlying trade today, I really expected a larger pullback in general, but you can't judge a chart inside a vacuum, you have to consider circumstances and as I outlined earlier in I believe option 2, some of the damage to the 15 min charts that suggested a deeper pullback may very well have been smart money just keeping the pressure on yesterday to the downside.

First the SPY as the general market update, then a few select charts from each of the averages and finally a quick look at the intraday trade in to the close.

 SPY bear flag/pennant and the upside breakout mentioned earlier, technical traders would be expecting this to break to the downside as that is the implication of a bear flag.

 SPY 3 min leading positive to a new local high, these charts weren't that impressive this a.m.

 SPY 5 min leading to a new local high

 The movement in the 15 min today

Some select charts
DIA 5 min at a new leading local high, above the area just before the F_O_M_C announcement

 Like most of the averages, ES started with a run of the mill positive divergence and built through the day, seeing a leading positive around noon and in confirmation on the move up.

 IWM 15 min nearly hitting a new local high (it's impressive because these longer tem charts from 15 min on don't usually move that fast.

 QQQ 5 min at a new leading local high


Intraday action.
 DIA 1 min with a slight negative divergence-this is only for intraday moves so we may see some downside in to the close.

 Same with the QQQ 1 min

However it seems contained at the shortest chart, 1 min as the 2 min is perfectly in line with price-confirmation.

USO Follow Up-Trade

This update from June 20 speculated that the descending triangle (of which we have been seeing a LOT lately) was setting up a bear trap.

From the update:

"This recent descending wedge is a pattern we've been seeing a lot lately, there have been some good head fake moves off these. Today we saw the downside move that technical traders expect from the price pattern, so the question is, is it setting up  bear trap?


I know the EIA report showed a build, but the move today seemed excessive, even vs the $USD  it seemed excessive, that is unless someone wanted to manipulate the pattern to set a bear trap.


 This is one we need to keep an eye on for a quick trade; I think the last set up similar to this in GLD yielded about 200% in a day or two on some call options."


As of today, it does looks like a bear trap was being set and if USO is going to move higher off this bear trap, that would imply some dollar weakness/Euro strength which as you may recall was part of my F_O_M_C analysis in which I thought the policy statement would disappoint the market (which fit well with the negative divergence in the market suggesting a pullback 2 days before the policy statement), I also said that is that were the case, the most likely catalyst for an upside move would be Euro/Dollar based. More simply this means that if USO is going to rally off what appears to be the suspected bear trap, it will likely do so from an FX market positive correlation, which has bullish implications for the broad market as well.


 The typical descending triangle, bearish consolidation/continuation pattern we've seen a lot of with several decent head fake trades. Look at the volume as USO breaks below the triangle-part of this has to do with other factors, but a lot of it has to do with technical traders and their "price confirmation" tactics. The large volume in part, represents confirmation of the bearish pattern, it also allows creates a lot of supply at cheap prices, ideal for accumulation. The bear trap itself sets up the momentum reversal as bears are trapped at a loss.

 Note the 1 min trend in 3C is leading positive as price breaks below the support level of the descending triangle-where technical traders would short USO on price/pattern confirmation.

 The 3 min chart shows the same effect.

 As does the 5 min chart

 As well as the 60 min chart.

This is USO today, it's up pretty good, but still hasn't crossed above resistance where the bear trap would be set in to motion as shorts start covering at a loss.


I'd love to sit and watch USO for a better entry, but I don't have that luxury, so I'll be entering a speculative position, a stop can be placed below the recent lows. Another entry would be on a break to the upside above $30.90-$31 area, that's where the bear trap would kick in.


I'll be looking to add a 1/2 size position in July $30 Calls, I may add more on a break above resistance.

BPZ Update

BPZ was a trade idea from June 18 (long) , I have  5.88% loss in the trade right now, but I still like it and plan on holding it. The loss represents less than 1% of portfolio, so it is within the speculative risk management range I intended.

Here's a requested update...

 The white arrow is the original idea, it was sitting right on support so a break below support (likely bear trap) is not too surprising.

 What I like about BPZ are both the long term trends of the short term charts and the divergences on the long term charts, they suggest a large change in character is underway in BPZ. (2 min)


 3 min

 30 min leading positive

 60 min leading positive.

Before, since we had no uptrend in place, we couldn't apply a Trend Channel stop, now that we have the start of a move up, the hourly channel has a current stop at $2.15.

I don't see anything at this time that changes my mind on the long position.

BIDU Charts...

You may recall one of my core short positions that I have kept in place is BIDU, which is also my best performing straight short (no leverage such as options) at a gain of +21.6%

 BIDU daily chart is at a support level and like many other averages, stocks and industry groups, we see that same Harami reversal pattern, except in BIDU's case the candlestick formation is much more appropriate.

 5 min chart shows a bear pennant, similar to a bear flag except a flag is a parallelogram price formation that consolidates away from the preceding trend (meaning consolidates slanting upward), but the price formations's implication in Technical Analysis terms is the same, it is a consolidation/continuation pattern with technical traders expecting the pennant to break to the downside and start a new leg down. I don't need to say it, but these obvious price patterns are often manipulated as Wall St. takes advantage of the predictability of technical traders. Volume is correct for the price pattern as well. There's always the chance (even with BIDU moving up as I suspect) that we will see a downside break which sets up a bear trap. Recently with these price patterns the chances have been about 50/50 that there's a downside break first and then an upside breakout creating the bear trap. I'd estimate 10% of the time we see a Crazy Ivan which is a shakeout in both direction before the real move establishes itself.

 1 min 3C showing some curious activity yesterday and leading positive in to the bear pennant today.

 The 2 min chart NEVER confirmed the recent downside move and stayed in leading positive position.

 The 5 min chart shows that same curious activity yesterday in a flat trading range and has added to the divergence today in the pennant.

 The 15 min chart is leading positive today, because of the longer history on this chart, the extent of today's leading positive divergence on a 15 min chart doesn't look as impressive as it actually is.

 The Daily Trend Channel since we shorted BIDU on an upside bull trap breakout in the red box, since then the Trend Channel has shown 3 breaks of the downtrend, this indicates a change in character.

 I haven't pulled this indicator out in a while, this is the Demark inspired custom indicator I developed with long/short signals on a daily chart.

The 15 min Bollinger Bands are also showing a recent change in character as they pinch which nearly always leads to a highly directional move. If e look at price alone and look at BIDU from a traditional Technical Analysis view, this would suggest a short opportunity, however we see these trades manipulated so often and there seems to be good evidence for a move higher in BIDU.

I Chose BIDU July $110 Calls

Chart coming

Entering a Speculative Long Call in BIDU

This trade is speculative for 2 reasons, 1) the trade may be very quick, thus the reason I'm using options to enhance leverage/gains and 2) because I consider all trades that run counter to the primary trend to be speculative and the primary trend in 3C is bearish.

I'm not sure what stroke yet, I will update you on the particulars as well as the charts.

Market Update

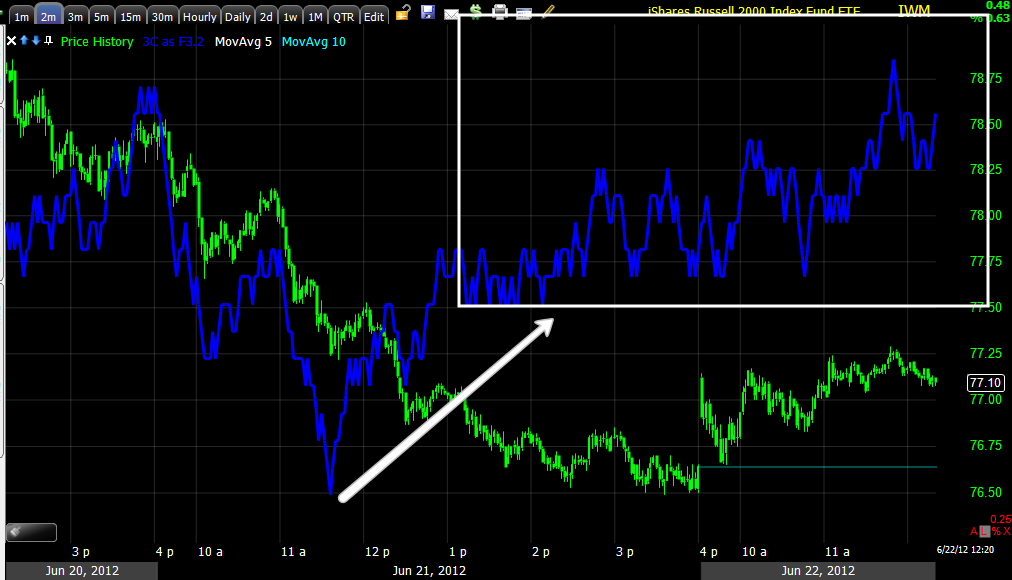
Things could be getting interesting. Earlier today you saw the IWM/Russell 2k improving dramatically, it is generally the leader of a rally or risk on move. Since then there has been additional strengthening across the averages and some industry groups.

I keep coming back to the Goldman Short call, this would obviously create a lot of cheap supply if they wanted to accumulate and generally speaking, if you do the opposite of whatever Goldman says, you tend to come out on top as we have seen with the last 2/2 GS calls.

The thing that bothered me was the mount of damage done to the 15 min charts yesterday, but there's a very real chance that institutional money was behind that to keep the pressure on the market yesterday. As you probably know, we look for positive divergences/accumulation in to a pullback to tell us when a pullback may be ending and give us excellent entries at low prices before the move starts, while most technical traders only chase the move once it starts as they rely on price and price derived indicators.

In my view 1 of 2 things is happening right now, we are seeing improvement for a counter trend (the trend from yesterday being down) bounce as the 15 min charts did sustain enough damage to make a fair assumption that we have more downside to go or 2) the 15 min charts sustained that damage as Wall Street kept the pressure on the markets yesterday to create a very ugly day. Remember, almost all technical traders rely on price and price derived indicators for their analysis, so yesterday would have caused them to come up with a vey bearish view. Continuing with my thoughts on option #2, this could be the accumulation we look for that signifies the end of the corrective move down (in this case on F_O_M_C disappointment and horrible manufacturing readings all in one day and across the globe.

It is worth mentioning that I was very interested in how the risk asset indicators would hold up in to yesterday's decline, they held up very well, especially credit.

The price pattern right now is correct for 3C accumulation.

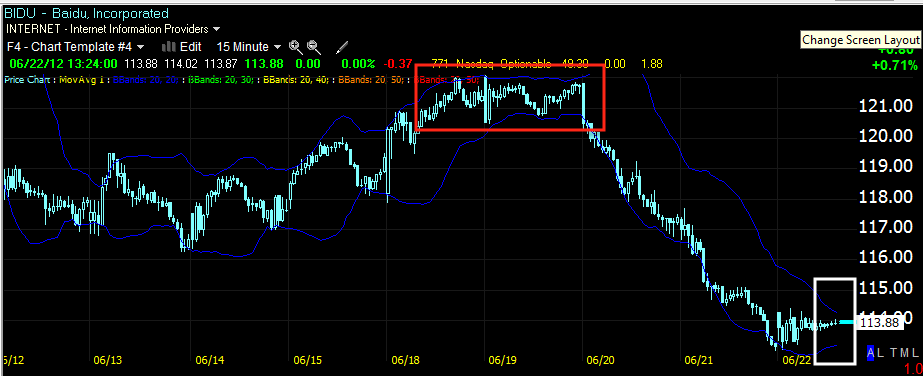
 There is an intraday triangle, for all intents and purposes this is the same as the flat trading range we often see institutions active in underlying trade. Keep in mind as well that the more obvious this triangle becomes, the higher the probability of some sort a head fake move. A head fake move to the downside with increased 3C positive divergences would be bullish and perhaps an excellent entry point.

The daily chart shows a nearly perfect Harami reversal (the Japanese call a Harami pattern, "Mother with baby" referring to the two candlesticks, the first large and the second small and inside the first) in the west we call this an inside day and it has the same implications, the only problem is there isn't a sufficiently long enough preceding downtrend to make this candlestick pattern high probability, but we may need to excuse that based on F_O_M_C manipulation activity.

The averages...
 The DIA 1 min wasn't interesting at all earlier today, now it's starting to lead positive during a flat price range.

 DIA 5 min was interesting, it has added to the leading positive divergence seen earlier today.

 ES, there was nothing special about ES this morning, but now we see some leading positive 3C activity, since the capture ES/3C has made a new high.

 The IWM was interesting this morning, the 1 min chart not only was positive yesterday, but has responded with a move of +.70% today thus far.

 The 2 min chart has continued to add to the leading positive even with the IWM moving higher, this is rare to see a positive divergence in to higher prices, it would be akin to accumulating on higher prices and we don't see this often, unless there's something brewing in which smart money is willing to accumulate even in to higher prices.

 The 3 min has added to the leading positive at a new local high, on an intraday basis there's a slight negative, which may reflect a pullback or consolidation intraday.

 The IWM 15 min DID NOT see as much damage as other averages yesterday and as such is starting to lead positive, this is a fairly strong divergence for a single day this early on this timeframe.

 QQQ 5 min leading positive, earlier this chart wasn't that interesting, but as it makes new local highs in 3C, it is becoming more interesting rapidly.

SPY 3 min which is adding to a leading positive divergence

Financials, Tech and Energy- "The 3 Pillars" or the 3 industry groups that are essential for a risk on trade.

 XLE/Energy  2 min is leading positive

 XLE 3 min leading positive to new local highs.

 XLE 5 min leading positive to new local highs.

 Financials, 2 min leading positive to new local highs.

 The Financials 5 min is shaping up.

Tech 5 min is also starting to shape up.