Monday, September 12, 2011

The Miners Trading system

Tonight system 1 went long NUGT, which means you would buy NUGT at the open tomorrow with a 3% stop loss on a closing basis.
System 1 is in green crossing the red signal line.

 NUGT 1 min chart in a leading positive divergence

So is the 5 min chart.

It stops there, which makes some sense considering what I expect from the market and GLD. Longer term though, DUST is the one basing and NUGT is the one topping, but that doesn't mean you can't make some quick money on this trade.

Head Fake

You hear me say this so much you probably are sick of it, but today was the perfect head fake.
 Remember the predictability of technical traders and how Wall Street uses Technical Analysis against them? Well this big bear flag is seen by Technical traders as a big, fat, juicy short set up, especially when t broke down below support today-but it wasn't what they thought, it was Wall Street's head fake. We talked about this last night before it even happened when Asia and Europe as well as the ES where falling apart, remember?


 Here's 3C and Wall Street sending prices below the bear flag and short sellers taking the bait, Wall Street took the other side of the short seller's trade and accumulated long as 3C shows you below the trendline.

End result, like I always say, a head fake is to get shares and make the market move faster in the direction Wall Street s playing it, that's why you see the big move up as short sellers from today were forced in to a short squeeze and the price moving straight up on volume, is those same short sellers covering at a loss.

Final Market Update

I closed the remainder of my shorts put on last week today for a nice profit and added longs today that are already at a nice profit. Am I holding my longs for now? YES.

Here are some interesting 3C charts.
 DIA 5 min in a leading positive divergence

 Considering the DIA was the laggard of the bunch, it is surprising to see this 15 min-1 day leading positive divergence. I guess Wall Street quickly made up for lost time today.

 QQQ 5 min leading positive.

 SPY 1 min leading

 SPY 5 min leading

 A slight 10 min positive divergence

And even a small 15 min!

It looks like what we saw starting last Friday and in last night's charts, was right on target. Now, we'll watch to see where this is going.

Site Requests...

Over the weekend I asked for ideas of what you would like to see on the site. On thing mentioned was how some common indicators can be used for those not using 3C.

There are some indicators I stay away from like OBV, I don't think it works well at all. I'll add more concepts to this discussion as we go, but momentum indicators are pretty good, like MACD Histograms and Wilder's RSI.

I prefer to use unconventional settings so I see something the crowd may have missed, so I use a MACD setting 2x as long as the normal, it also reduces noise and shows the trend better.
This is a 10 min chart of the SPY, MACD is in blue set to 26/52/3, Wilder's RSI is in white set to 14 which is typical, longer settings an be difficult to read in RSI, although I do use 22 often.

When price was moving up in the SPY on this 10 min chart, MACE and RSI also moved up with it at the green arrows, that is confirmation of the trend, when they stopped moving up with price, they were negatively divergence and that shows there's a problem with the trend. As almost always, a reversal, even on a 10 min chart, is a process, not an event, it takes a little time and is "U" shaped, not "V" so you can use this to your advantage to re-arrange your portfolio. On the recent positive divergence in white, MACD and RSI were moving up while price was moving down, this is also highly indicative of a reversal and you have some time in the process to re-arange your portfolio.

It's important to look at as many different intraday and daily timeframes as you can, shorter timeframes and signals represent shorter trends, longer ones represent longer trends. The more you compare, and the more pieces of the puzzle that fit, the better idea you will have regarding what to expect in multiple trends that all occur at once in different timeframes.

 Here I put Wilder's RSI period 14 in DIA's price window, you see all of the signals from confirmation, negative divergence, positive divergence. However, everyone can see this.

In this window, I left RSI, but I made it invisible and added Rate of Change to RSI, note how much sharper and clearer the signals are. Sometimes this makes all the difference.

I would stray from the pack and use your own settings, think for yourself rather then what the books say-everyone knows that and what everyone knows, isn't worth knowing. Just make sure they have worked in the past.


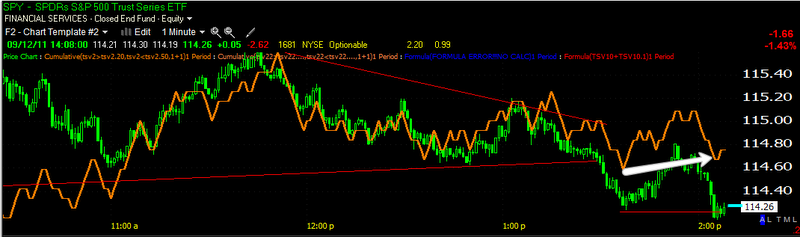
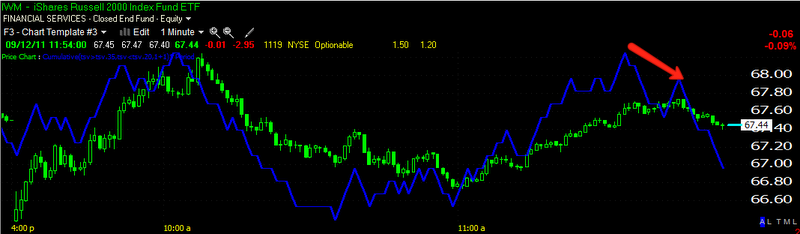
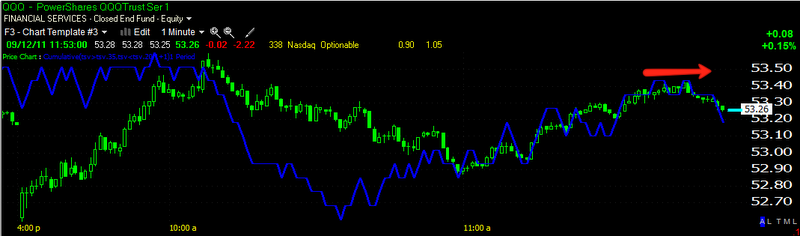
By the way, it looks like the market is finishing up with that pullback

Market Update

So far so good.

 3C is positive through the day and at the highs, which look like they just hit some intraday resistance. The important thing is 3C didn't put in a negative divergence on this last run up and consolidation, it remains in line.

The Q's are now leading positive for the day, again in the white box there's no negative divergence, so the backing and filling is in line with 3C.

AAPL Follow up-Already?

Yep...

Nice move there in AAPL.

Short Squeeze

 DIA-check the volume

 QQQ

SPY

All vertical moves up on volume. As I mentioned earlier, the technical traders were expecting the triangle to break down, they went short on it and they just got squeezed. That's the problem with these book smart traders, they are too damn predictable.

Adding Trades

I might consider adding some QQQ/QLD/TQQQ

It's looking pretty good here and you get to add at a discount.

AAPL looks interesting here

 AAPL positive divergence on a 10 min chart

 AAPL positive divergence on a 15 min chart and most of it coming today.

And the QQQ 1 min chart is now leading positive!
AAPL is a big part of the NASDAQ 100.

AAPL may make for an interesting long here.

A Few lessons

 As you can see, after breaking down from the triangle, an intraday support level was put in, this is why I keep stops away from any level retail traders see as support or resistance. The market saw the stops gathered and ran them again-just look at the volume.
We had another positive divergence on that break, so t looks like the shares stopped out were accumulated by Wall Street.

This is why I keep positions small on short term divergences, if the divergence builds and it looks like a bigger move is coming, I want to be able to add in to weakness, so long as 3C is positive as it is.

Head Fake

In a follow up to my last post, I was looking for a head fake shake out or a false breakdown considering that pattern was so obvious. So far, so good as far as this looking like a false breakdown or shakeout.

 DIA positive divergence on the breakdown.

 Same for the QQQ

And the SPY

They may take it lower to trap bears, but so far, it seems to be under accumulation and remember, as always, 80% of the time before a reversal, the last thing we see if a false move, we may have two today 1) below the daily bear flag and 2) below the intraday triangle; which is exactly what technical traders would be looking for.

And there it is

In my last Market Update I said, " This triangle is becoming very obvious, I would look for a probable downside shakeout before any move up starts. I have a small long position, on  break of the triangle, if we get some decent downside, I may add to the small long position."


And look at the volume on the break-it was "That Obvious"! 


I'll be looking for some stability and may add to some longs upon seeing 3C stability.

GLD Update

GLD looks like it wants to move up on a short term basis, maybe several days. It looks a bit stronger then the overall market. This would seem to clash with Gold as a flight to safety trade, you would expect GLD to be down if the market bounced, but here we are today with both GLD and the market down. This is what I meant when I questioned whether correlations would hold moving forward, they haven't today.

 GLD 1 min positive divergence

 GLD 2 min positive divergence

 GLD 5 min positive divergence

GLD 15 min positive divergence

Market Update

 The daily chart and break below the flag

 This triangle is becoming very obvious, I would look for a probable downside shakeout before any move up starts. I have a small long position, on  break of the triangle, if we get some decent downside, I may add to the small long position.

 SPY 1 min looks pretty good.

 SPY 5 min is adding to the positive divergence seen Friday

Still the 10 min chart isn't moving which is why I'm keeping the long position rather small.

Initiating some longs

I'm looking at starting some long trades here, it's a directional trade and because I see this as a likely short term bounce, 'm keeping it small for now- you can always add later and I'm using ETFs which are well suited to this type of trade.

Here are some of the long candidates and I may add to them on any further market weakness, I will let you know.

So far I like:

UPRO leveraged long the S&P-500
UDOW leveraged long the Dow-30
FAS Leveraged long financials
TNA leveraged long small cap stocks
ERX leveraged long Energy.

That gives me some pretty good basic coverage.

As for the Bounce

Last night I mentioned I thought we'd see a bounce early this week. There has been improvement in the more important 5 min charts (we have been looking at the intraday 1 min charts mostly today). Still the 10 min charts haven't moved much, so far suggesting to me the bounce may be of a day or two, but isn't shaping up to be a major event as of now.

 DIA 5 min is finally leading positive

 QQQ 5 min is leading positive

So ais the SPY, note the positive divergence at the mid morning lows.

The chart pattern forming intraday looks like a triangle...
Because of this and the fact we broke below the flag on what should be a head fake, I don't see a whole lot of potential downside left, I will start to close out my remaining shorts a little at a time shortly.

The Other Averages

I just showed you the start of a 1 min intraday negative divergence in the SPY, here are the other averages...
 DIA 1 min

 IWM 1 min

QQQ 1 min

I'm still holding the remainder of my shorts, I haven't moved anything yet today.

Update

 The Euro in green helped lift the market for the test of the flag's resistance. A move down here will add strength to the dollar intraday and put pressure on the market intraday.

 This morning's SPY action. To the right there's the start of a negative divergence at the test of resistance of the bear flag.

 As for the slightly longer term picture, meaning the short term bounce I talked about last night, The underlying weakness in the dollar here is equity/stock positive. This is more relating to a bounce over a day or tow, and not the intraday action we've been watching and what I referenced above.

 UUP 10 mn is also showing underlying weakness which should help a bounce.

The same is true of the more important 15 min. UUP chart.