Friday, November 2, 2012

Closing Indications

Earlier when the market broke down at first I though it was some kind of news we hadn't seen yet, then AAPL breaking the 200 day was blamed, but it was really Dan Loeb releasing AAPL as his biggest losing position that started everything on a downhill spiral, which includes AAPL's trade. This is why there were no negative divergences that we see on moves that are only .05%, we'd certainly see a negative divergence on a move of -.90%, it wasn't there because it was a spontaneous reaction to Loeb's 13-F release.

It remains to be seen how much of the accumulated position from last week may have been sold off, but it seemed like they weren't done with the cycle by the looks of many charts shooting in to large positive divergences near the close, accumulating at better prices. What the $USD couldn't do 2 days in a row, Loeb's 13-F did, that's how influential Third Point is.

As for leading indicators, FCT was positively divergent on both intraday and longer term with a near vertical move up near the EOD.


HYG Credit held up much better than the SPX, but that makes sense, these are better informed traders with much larger positions, much less likely to have a knee jerk reaction. HY Junk Credit held up better as well, as did High Yield that also saw a near vertical climb at the end of day while the SPX was headed the other direction, if I have to take my cues from the market or from credit, I go with credit every time so the move in HY credit was impressive.

Both FCT and High Yield closed in the green as the market was at it's ugliest! Remind you of any market maxims?

Yields held up better than I expected, they closed perfectly flat, that gives you a positive divergence vs the SPX.

Even commodities flattened out in the last 15 mins of the day when the bigger players are active.

The relative momentum in sectors toward the end of day saw Financials stay strong, Energy even started to pick up, Basic Materials performed better and they have  lot of momo stocks in that group, Industrials held up well, Tech didn't, but you saw the positive divergence shooting up in the Tech sector near the EOD.

It was definitely a unique day as drops like that usually have more warning, this was one of the best examples of the herd mentality on Wall St. you'll probably see this year.

All in all I'm glad I didn't make any knee jerk moves, just like when QE3 was announced the conventional wisdom was the market would tear higher, we waited for the evidence before making any moves and the conventional wisdom was wrong, if you're thinking, "Yeah but they're not buying yet", they've been buying non stop since twist, the market also shot up after Jackson Hole and that was before QE2 was even announced, it was strongly hinted at.

Looking at individual stocks, it does appear there's still upside room, how that gels with the election, I guess we'll find out soon, but we'll probably know before most as we are looking at things that most aren't seeing.

As for AAPL, it may have just about hit bottom for the moment, Loeb's release was definitely a flush of AAPL positions today, it makes me think about when BAC was flushed late 2011 after Paulson's fund lost so much on BAC (down something like 55% for the year-the fund not BAC!) and then it shot up to more than double over the next 2 months.

A few AAPL charts that may be suggesting this (and I've been straight about AAPL over the last week, it's been disappointing in the 3C action or lack of it)...
 My Custom DeMark inspired indicator with it's buy/sell signals is giving the first buy since the May low. AAPL also closed outside of the daily Bollinger Bands today.


 Here's a REALLY simple way to use ROC applied to price to give you a head's up, it clearly calls a negative divergence in AAPL's higher high, as a matter of fact you can add this to a lot of indicators and increase their performance and get earlier signals and signals no one else sees. The strength of embedded Stochastics is over, but we are close to a level in which AAPL has reversed before, not my favorite indicator, but it is what it is; just thought it was interesting with the custom indicator above.


 The money flow in AAPL at the End of Day (EOD) was higher than at the a.m., perhaps someone was buying up those shares of AAPL that were easily available.

The 1 min chart at the end of day also had a sharp positive divergence.

If AAPL does bounce and I think it has to, there's too many bears in there, it definitely helps the market cycle.

I'll post as I find interesting stuff, the bottom line though is many of the leading indicators today didn't just hold up, they went straight up against the market, that's impressive.

Other than that, enjoy your weekend!

A Short Idea For You - AZO

I really like this one because it's still in an excellent spot, there's a decent chance it will give a little better entry with less risk and it has a lot of potential downside. I do think I'll be looking at adding AZO as a core short position and watching for the opportunity starting next week.

 Take a look at the price/volume trend and percentage gains, in healthy areas AZO did pretty well, the 2002-2007 bull market wasn't great for a car parts seller as most were buying new cars off their HELOC. The 2009-present move o no volume is a sugar rush move fueled by Central Bank liquidity, it's a bit too parabolic and I don't think that ends well.

 Here the 14 day ATR is rising, partly as a function of price, but more so as a function of volatility associated with tops.

 Here are a few Channel Busters, note how they move from one extreme to the other, I think we are currently in the end game for AZO, they're setting up the exit.

 Money Stream is in one of the largest negative divergences for the stock, although we've seen worse, my guess is the near 16 P/E will see 10 and maybe overshot a little on the downside on the way there.

 The 60 min 3C chart shows this last run to be a distribution run.

 The 30 min chart confirms it.

Traders are optimistic so I'm guessing with the big green volume they think that's smart money buying and that allows them an excuse to fudge the trend lines a little to create a large continuation triangle, but triangles this large (which it is not), are tops or bottoms depending on the preceding trend. The yellow area is our target area, but I have a feeling we are very close to that target area. We'll look closer next week for the tactical entry now that we have the strategic picture.

Here's What I Think

Have you heard the name Dan Loeb before? Loeb is the manager of Third Point, an $8.8 billion dollar hedge fund. I've had the opportunity to sit down at the offices and have dinner with a few hedge fund managers and some Wall Street folk that have been on Wall Street since the 1950's, others in my family either work for very large Wall Street firms that all of you have heard of (two letter ticker that starts with an M) and another that works on a Black Box High Frequency Trading program for an independently wealthy person. None are in Loeb's class, but the hedge fund business is very simple, it's best characterized as "Sheep". There are a few leaders, but the rest spend their time following someone like Dan Loeb's 13-F filings and copying his moves.

There's a really simple reason for why most hedge fund managers own all the same assets and it makes my job easier when they all decide to start buying the same thing or selling the same thing, the signals are really clean and unbelievably strong. The reason they are sheep is because no one wants to lose their manager's position that can be worth hundreds of millions of dollars, no one wants to be the one who sticks out like a sore thumb when compares to the rest o the pack.

There's a reason the S&P is up 12.5% for the year and only 8% of hedge funds are beating the S&P! That's right, only 8% are doing better than the S&P and then you have to take out the fees, usually 2 and 20 which refers to a 2% management fee and a 20% performance fee, any money made above the high water mark has 20% sent to the fund so if your hedge fund made $200,000 for you this year, they take $40k plus another 2% of whatever your total portfolio is, even if that $200k only represents a 5% gain for the year!

In any case, Dan Loeb's biggest loser right now is none other than AAPL...
My guess is this came out somewhere between 1pm and 2 pm today, probably specifically at 1:52 pm today when the market all of the sudden changed without any sort of negative divergence at all.

AAPL would have been sold by all the sheep hedge funds and because of margin calls, they'd have to sell a lot of other assets.

I'm pretty sure this is exactly what happened to the market today.

Now how many of you can remember how long I've been warning about AAPL?


Examples

The more places I look, the more surprising signals turn up, but I can only get so many out so fast before the close so lets take a look.

 AAPL hasn't been putting in very impressive divergences lately, in fact lagging the market, this 1 min though believe it or not is pretty impressive for AAPL lately.


 This 2 day long AAPL 2 min leading positive is even more impressive.

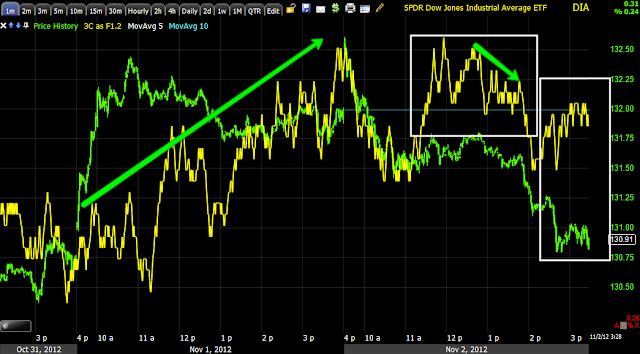
 DIA 1 min trend at a new leading high above mid October price highs.

 DIA 1 min intraday , there's no negative divergence here at all, all the green arrows are in line, even at the move down, it's just in line, it never went negative even on the fastest intraday chart!

 Euro 5 min trend, but today is even better.

 today's Euro 5 min leading positive divergence, something is being set up here.

 QQQ 1 min negative on the open, but positive most of the day and again even at the decline, it NEVER went negative and this is the intraday chart that would do that.

 QQQ 2 min in leading positive position after being positive all day, again, 3C is moving with price, it NEVER went negative! (except the open)

 Same with the SPY 1 min which is leading positive right now, has been positive all day and again never went negative before the decline.

 $USD 2 min leading negative in a large way very fast.


 5 min is even worse

 Volatility -trades opposite the market, a small relative positive divergence and then at end of day a leading negative divergence.

 A closer look, some things are being moved quickly.

 Tech 1 min leading positive divergence at a new high for the day as price is near the lows!

Migration of the divergence to the 2 min chart, there was a very sharp, fast turn around after the decline, a decline that they apparently didn't distribute in to in any meaningful way.

Interesting Moves in the Market

I'm really glad I didn't react emotionally to the market (it normally wouldn't be an issue at all if it weren't for the huge wildcard of an election next week).

In any case, there are some very recent, very big moves to the positive side developing right now, I'm going to collect a few charts, see what hints/clues I find, but I would really regret having closed the longs and then seeing these moves develop on the charts.

A Look at Tech

I used Financials as an example, here's Tech though.

 3 min trend leading positive, no sign of distribution here

 5 min with a large leading positive across a lot of time and at a new leading high


The 15 min chart was strong enough that it even migrated over to the 30 min chart.

I have a really hard time looking at charts like this and closing positions based on an emotional move, these are solid charts for a decent continued move up-don't forget how well the market performed against the flow yesterday and even today being we're not closing in on  or under $1400 where we rightfully should be based on the FX correlation

Deciding About Leveraged Longs

Most of the leveraged longs from last week are at a gain or close enough to break even that I could close them here and not have any effect at all, however I'm looking around at a lot of different assets and Financials may be a good one to use as an example on short notice anyway.

 Take FAZ-3x leveraged Short Financials, we have a relative positive opening divergence and a leading positive on a 3 min chart, this looks pretty good right now and makes me consider closing the leveraged longs with a short looking like this, but...

 If I take the trend of that same chart and zoom it out, all of the sudden it doesn't look so good anymore, there's no positive divergence longer than today.

 On a 15 min chart, we bought FAZ on the 18th expecting the market to go down and it was a good trade, but then it ended as the range started, this chart is more important than intraday 1 or 3 min charts, it is leading negative here.

 XLF Financials turned down on the 18th as mentioned above, but this intraday 2 min chart has a positive divergence that built for more than part of a day, it's nearly a wee long and still leading at a new local high.

The 15 min chart is also leading positive, not negative.

I think I'll be patient and not get emotionally tangled up and go against the evidence we have

MCP Intraday charts still holding up well

T+3?

What might make some sense is today would be the last day before the election for settlement of trades because of the T+3 rule, Trade + 3 days. That would clear any trades placed right now before the election results, perhaps a little de-leveraging?

AAPL Blamed

AAPL breaking its 200 day moving average is being blamed for this move in the market


The problem is I have the 200 day simple at $590.36 and the expo at $582.36, neither of which coincide with the move in the market, which by the way there is no warning of, not even on 1 min charts, in many cases just the opposite in fact. I think something else is going on here.

Beyond that, the $TICK chart doesn't look nearly as bad as it should, it has a few extremes, but overall something is fishy here.

 The break around 1:53 pm

 A closer look at the SPY, AAPL didn't break the expo until well after 2 pm and the simple long before.

The TICK chart shows the 1:53 initial volume, but there's only 1 min of extreme readings and the recent extreme, everything else is in a moderate position, especially for this kind of move.

1+1 is not adding up to 2 here.

FB Update

FB looks pretty simple, whenever there's doubt in charts, go to the longer term, less noise and higher probabilities, not that there's much doubt in FB.

FB is technically still in its base which needs to break above $24.75-$26.75 before it's considered stage 2 mark up where trending becomes a lot more likely.

I have no problems with sticking with FB right now.

 FB saw a nice pop of well over +20% in a day, that's going to see profit taking and consolidation.

 The 5 min chart has more detail than longer charts, the positive divergence through October launched FB higher, but there was immediate distribution in to the move, since then it has seen a leading positive divergence as it pulls back.

The 15 min chart is more trend, the positive divergence that was building before FB launched is clear, the distribution on the pop up is not as clear because it is not as strong and didn't make it to this longer chart, however the positive leading divergence on the pullback is making it on this chart, this is why I have no problem holding FB.

Some news just hit, not sure what it is yet

Leading Indicators

There are several mildly positive indications, one that exemplifies the problem of judging a move and what it can do and some charts showing what Wall Street can do when it puts its mind to it.

 This is a good overall representation of what Wall Street can do, today may not seem like much of a strong day, but that's all relative. Commodities are in brown and the $USD is in light blue, note how commodities follow the legacy arbitrage correlation of a strong dollar and weak risk assets, yet the SPX in green not only moved higher yesterday despite the dollar being stronger, with the Dollar MUCH stronger today, the SPX is holding its ground, it should be somewhere around commodities or even lower, thus the relative strength vs the FX correlations today is impressive; THIS IS WHAT WALL STREET CAN DO WHEN THEY PUT THEIR MIND TO IT, SUPPORT A MARKET THAT SHOULD BE 1-2% LOWER (maybe even more)  RIGHT FROM THE OPEN.

 The AUD is down today, partly I'd think because of $USD strength, intraday this isn't the kind of signal I like to see for a continued move higher in the market, but...

 Longer term the $AUD is still at a significant positive divergence vs the SPX, implying more upside.

 The 5 min EUR/USD since yesterday's 4 pm close, this is a big move down and a break of the psychologically important $1.29 area, the last time the market was below $1.29 we were near the recent (last week's) swing lows.

 The EUR/USD though hasn't lost much since the NY open today, as far as I can tell the Euro lost ground on expectations the European PMI manufacturing was going to be horrible and the US NFP was going to be great, the NFP was great, but the EU PMI wasn't as bad as expected, in fact in areas it was much better than expected, so it will be interesting to see if the pair re-discounts the fact as it discounted the rumor.

 This gives you some idea of where the SPX would normally be on a day like today, probably probing the $1400 level, maybe even lower, so I hope that gives you some idea of the influence Wall St. is exerting on the market today.

 FCT intraday is in a positive divergence.

 Longer term it remains positive and is gaining some ground rather than going negative, implying more upside ahead.

 Yields intraday are in line with the SPX movement


 Longer term they still remain in a leading positive divergence, but this is one leading indicator that has a current reading lower than I'm comfortable with for a VERY confident outlook on near term trade, note the emphasis on "VERY".

 HYG Credit intraday also looks better than I'd expect, this is good for near term trade expectations.

 Longer term we saw credit and the SPX hit reversion to the mean, I'm happy to see credit moving up from here.

 Junk Credit is similar, a little less intraday performance.

 It is also moving up and away from reversion to the mean which is a bullish signal for the market.


 I'm impressed with High Yield Credit today, hanging in there, this also gives me confidence in near term expectations.

Sector Rotation (which is on a relative basis) is seeing Financials staying in rotation, Defensive sectors are largely declining despite a small bump in Healthcare today, Utilities lost more ground. Energy lost ground as would be expected from the Dollar moves, Industrials are staying strong, Tech isn't that bad on the dip today, Discretionary is interestingly strong.

So far rotation still looks favorable overall.