Interestingly, There were several indications pointing to market relative strength today including yesterdays three C divergences as well as the overnight positive divergence in index futures. Also the treasury yields into the last hour of yesterday has pointed out last night in the Daily Wrap, very specifically the last hour after the bond market closed which can be seen in today's, Leading Indicators & Market Update. And of course yesterday's internals as represented by the Daily Wrap from last night:
"The dominant price / volume relationship came in at Dow 14 stocks, NDX 51, R2K 952, SPX 218. This is a dominant price/volume relationship which came in at Close Down/Volume Up.
This relationship is a short term oversold condition, not the kind of oversold that is represented by indicators such as RSI, but much more accurate based on market breadth.
The most common bias is for a next day close higher, in line with our 3C short term indications."
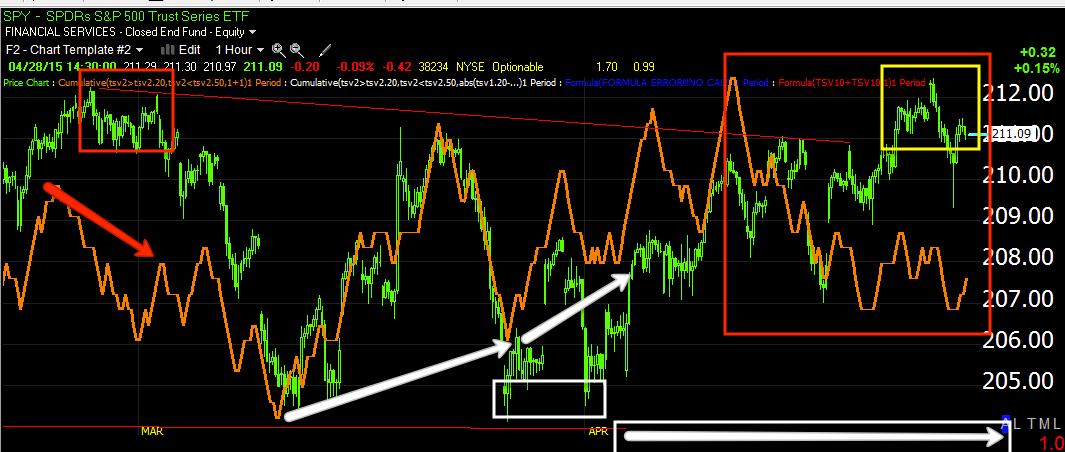
The V-shaped recovery this morning, Showed exactly the kind of intraday breadth flame out we look for in terms of a bullish candlestick on significant volume.

SPY 60 min chart and exactly what I urged you to look for, a bullish candlestick like this hammer on significant volume representing short term capitulation. The very "V" shaped recovery did not give me a lot of confidence.
As for the averages intraday…
 The Russell 2000(yellow) led and the NASDAQ 100 (Blue) lagged, certainly Apple was no help.
 This is exactly the kind of breakout move we were looking for in the April 2nd forecast using Apple as an example specifically. Note today's large bearish engulfing candle on significant volume after yesterday's Evening Star reversal candle on significant volume.
From today's, Leading Indicators & Market Update: the VIX smack-down had little to do with Iran unless there was a leak that was front run, otherwise this is a typical VIX smackdown to support the market, it seems quite strange to see protection being sold in front of tomorrow's uncertain F_O_M_C.
From the Leading Indicators & Market Update post this afternoon:
 "Interestingly, it looks like this move had VERY LITTLE TO DO WITH IRAN. First of all we had indications in 3C, yields, internals, etc.
At #1 is the VIX's reaction to news that Iran had captured a US flagged ship. However at #2, almost 45 minutes before it was made clear it wasn't a US ship, someone was already slamming the VIX (common to see when they are trying to ramp the market). At #3 we find out the ship was not US."
As suggested earlier in the day, it seemed like someone wanted the market rather neutral going into tomorrow's F_O_M_C, and protection or not… it did the trick.
 SPY (green) vs. Spot-VIX (red).
Nearly all of the averages closed with a bullish hammer reversal candle on a daily basis, with the NASDAQ being the only one at has made an appropriate Head fake move(e,optionally moving-causing a short squeeze Friday)...
 This is quite an interesting candle to close with on a daily basis in the SPX considering tomorrow's F_O_M_C. Even though my decision to remain patient on trade ideas was based on other indications, this would have given me pause as well, not to contradict my late day post clearing up the damage that has been done to the market, A Visual.
Yet, it remains very difficult to make a near term bullish case for very long with a chart like AAPL's today
I was hoping for better performance today from NASDAQ biotechs and transports, but I'm glad we waited and I'm not so sure we missed any opportunities.
TWTR was high on my watchlist for a short entry, you can probably see why on this 30 minutes chart
 Something is very wrong on a chart this long with a divergence this stark. However, someone knew something well in advance as Selerity scoured the Internet and released a series of, Ironically, Twitter posts with their leaked earnings. This is the result just one bar later...
 TWTR as of 3:07 pm when the tweets were posted. Twitter had a Q1 loss of $.25. Income adjusted EPS was $.07 versus $.04 cents consensus. However Q1 revenues came in at $435.9 million versus consensus of $456.2 million. In addition they guided lower, remember the market is all about perception. It doesn't matter what you did it matters what the market thinks you will do moving forward. Q2 was guided lower, between $470 million to $485 million versus the estimate of $538.1 million. Also full year guidance for revenues was lowered to $2.170 billion to $2.270 billion which was previously $2.3 billion to $2.35 billion versus consensus at $2.37 billion.
The closing result…
 TWTR Daily chart.
As for leading indicators... 30 year treasury yields ended up 9 basis points on the day.
Just like I showed you in last nights, Daily Wrap in which yields lifted the last hour of the day suggesting a bounce today in addition to the other indications, once again today we saw the same thing which gives some more short term authority to those closing daily hammer candlesticks.
 5 year yields showing recent market supportive activity as of yesterday into today's "V" reversal.
 This was shown most clearly in 30 year yields yesterday during the last hour of trade, in the white box. Additionally extra support was added at this morning's "V" reversal and look at the close, 30 year yield leading. I think it was good that we were patient today and took the signals as they came, not as we would have them be.
 This just shows the extent VIX (VXX) futures we're slammed versus the SPX (relative performance).
 And spot VIX..
 However the 30 minute VIX futures still hold a large leading positive divergence so it seems whatever we are in store for in the near-term, someone with deep pockets is looking in different direction...down.
 Our SPX:RUT Ratio which was also supportive of the market yesterday and into this morning's lows.
 However we should not get lost in the lines, here is the larger picture including the positive activity into April 2 and the negative activity since April 2 and especially this week..
 And as mentioned earlier today the institutional risk asset, high-yield credit was not buying it.
It seems to me there is still some short-term upside as none of the averages other than the NASDAQ have made a solid head fake move. The charts above which would suggest the same and selling into any price strength which is clearly been the theme throughout April in multiple indicators.
Internals tonight we're somewhat mixed although the dominant price/volume relationship carried for the five major averages excluding the Dow. The NASDAQ with 42 stocks, the Russell 2000 with 814 and the SPX with 177 all came in at Close up/ Volume down. This is the most bearish of the four relationships and is one we have seen with increasing frequency over the last two weeks indicating a weakening market.
As for futures tonight, more than anything it was the index futures they gave me pause today. While Russell 2000, NASDAQ and SPX futures in the five-minute Time frame are all positive...
 ES 5 min
 NQ 5 min
 TF 5 min
These were all in response to the growing positive divergence from yesterday an forecasted balance for today represented by numerous indicators including leading indicators and internals and 3C. In a way, they are in the past, but they need to turn negative before I feel comfortable with a true pivot.
 The most current one minute index futures right now are negative like ES above. They may once again gain strength with this negative divergence overnight as they did with yesterday's positive divergence and that may answer our question near-term. However with the daily candles looking the way they do I would not be surprised to see some early market price strength.
Wow we have caught F_O_M_C leaks at least twice in the past on the day of the policy statement, it is rare, But I will be looking for it. The market will be looking for how convince the F_E_D is that this weakness in the economy is temporary as well as inflationary expectations. Most think that this is not going to be a very exciting meeting, I disagree.
Although I have no specific knowledge or evidence pointing to anything regarding the F_O_M_C, as always I warn, "Beware the F_E_D knee jerk reaction" as it is almost always wrong.
I'll check futures again before turning in and let you know if I see anything of interest.
Our $USD forecast has moved exactly as expected from the April 2 post. I was going to put that out tonight, but decided to wait for the F_E_D as it will knee-jerk. However all indications point to our forecast of the USD making a lower low despite the occasional countertrend bounce which I believe we may be on the verge of. When I post the USD analysis (likely tomorrow) I will also cover the implications of the carry trade. Have a great night and I'll see you in the morning.
From the Leading Indicators & Market Update post this afternoon:
At #1 is the VIX's reaction to news that Iran had captured a US flagged ship. However at #2, almost 45 minutes before it was made clear it wasn't a US ship, someone was already slamming the VIX (common to see when they are trying to ramp the market). At #3 we find out the ship was not US."
As suggested earlier in the day, it seemed like someone wanted the market rather neutral going into tomorrow's F_O_M_C, and protection or not… it did the trick.
Nearly all of the averages closed with a bullish hammer reversal candle on a daily basis, with the NASDAQ being the only one at has made an appropriate Head fake move(e,optionally moving-causing a short squeeze Friday)...
Yet, it remains very difficult to make a near term bullish case for very long with a chart like AAPL's today
I was hoping for better performance today from NASDAQ biotechs and transports, but I'm glad we waited and I'm not so sure we missed any opportunities.
TWTR was high on my watchlist for a short entry, you can probably see why on this 30 minutes chart
The closing result…
As for leading indicators... 30 year treasury yields ended up 9 basis points on the day.
Just like I showed you in last nights, Daily Wrap in which yields lifted the last hour of the day suggesting a bounce today in addition to the other indications, once again today we saw the same thing which gives some more short term authority to those closing daily hammer candlesticks.
It seems to me there is still some short-term upside as none of the averages other than the NASDAQ have made a solid head fake move. The charts above which would suggest the same and selling into any price strength which is clearly been the theme throughout April in multiple indicators.
Internals tonight we're somewhat mixed although the dominant price/volume relationship carried for the five major averages excluding the Dow. The NASDAQ with 42 stocks, the Russell 2000 with 814 and the SPX with 177 all came in at Close up/ Volume down. This is the most bearish of the four relationships and is one we have seen with increasing frequency over the last two weeks indicating a weakening market.
As for futures tonight, more than anything it was the index futures they gave me pause today. While Russell 2000, NASDAQ and SPX futures in the five-minute Time frame are all positive...
These were all in response to the growing positive divergence from yesterday an forecasted balance for today represented by numerous indicators including leading indicators and internals and 3C. In a way, they are in the past, but they need to turn negative before I feel comfortable with a true pivot.
Wow we have caught F_O_M_C leaks at least twice in the past on the day of the policy statement, it is rare, But I will be looking for it. The market will be looking for how convince the F_E_D is that this weakness in the economy is temporary as well as inflationary expectations. Most think that this is not going to be a very exciting meeting, I disagree.
Although I have no specific knowledge or evidence pointing to anything regarding the F_O_M_C, as always I warn, "Beware the F_E_D knee jerk reaction" as it is almost always wrong.
I'll check futures again before turning in and let you know if I see anything of interest.
Our $USD forecast has moved exactly as expected from the April 2 post. I was going to put that out tonight, but decided to wait for the F_E_D as it will knee-jerk. However all indications point to our forecast of the USD making a lower low despite the occasional countertrend bounce which I believe we may be on the verge of. When I post the USD analysis (likely tomorrow) I will also cover the implications of the carry trade. Have a great night and I'll see you in the morning.