Thursday, August 21, 2014

Daily Wrap- Lowest gets Lower

The one metric/indication that virtually no one cares about (and perhaps while the Bernanke put was in place and promises of always being there for the market it truly didn't matter) which I guarantee will come raging back with a vengeance as the new crop of "BTFD" traders has grown up in the market with no clue as to what to do with it,  and that indicator is Volume .

On August 1 through August 8th we built a base with pretty decent accumulation, enough to hit all of the upside targets we set well over a week ago (except the Russell 2000 which still has barely made it above our minimum target), but as I said back then, despite what price looks like during this bounce, THIS BASE/DIVERGENCE ARE NOT A GAME-CHANGER, it's a bounce off a deeply oversold market in terms of breadth (with only 20% of NYSE stocks above their 40-day m.a. at the lows).

One of the most ominous indications of this rally being a suckers rally unless you know what to do with it is volume. Last week which is the week we forecast as being a solid move up ( as opposed to this week being more transitional) saw S&P futures volume at -40 to -55% below average. Yesterday volume collapsed to the lowest non-holiday volume of the year, today it set a new record low for the year (lower than yesterday's). Any trader around since before 2009 knows volume matters and with the Bernanke put almost completely removed and rate hikes obviously coming sooner than later, volume will be one of the most important indications in judging a move, in this case it's an abysmal failure.


For me, one of most interesting events was the much anticipated and patiently waited for, break above XLF's trading range. To understand the concept here as it is such a common concept in every asset and in every timeframe you might trade, I'd point you to my two articles that are always linked on the member's site,

Understanding the Head-Fake Move... How Technical Analysis Went From an Asset to a Trap

and

Understanding the Head-Fake Move... Motivation

To give a brief synopsis (as there are probably close to 50 posts on the subject since June) XLF was in a range, when we have well defined areas of support or resistance in popular assets, the probability of a head fake move is almost certain.

XLF is one of my core short positions (actually FAZ-3x short Financials) that I use as part of my diversification.
 While we were inside the range, I carried a partial FAZ long position with the intention of adding to it on a break above the range, as that no longer looked like a probability as the market's 3C charts started falling apart, I added to the FAZ long and gained approx. an 8-9% gain.

On 8/1 as XLF broke below support I closed FAZ long, Closing FAZ Long and the reason was the simple, to lock in gains and as a positive divegrence was already showing, I had a good feeling I'd be able to add FAZ back above the range or pretty close.

On August 5th (while we were still forming a base), I posted, Trade Idea: (Short Term) XLF / FAS

"XLF has done what I wanted to see, a wider "W" base as well as a head fake move under Friday's intraday lows. I'll post al of the charts next, but for now I'm going to enter a speculative size August 16th XLF $22 call position. For those who prefer not trade options, but would still like a little leverage, there are the two ETFs,  UYG 2x long Financials and FAS 3x long Financials."

This was a "piggy back" long trade as the base in the market/XLF was looking strong for a bounce, but a bounce that we knew/know will fail.

On 8/8 I posted a reiteration, Trade Idea-Set-Up (Swing) XLF / FAS, this was the last day of the base before the market took off to the upside.

"XLF/FAS looks pretty good for an upside move next week."

"On 8/1 I posted, Closing FAZ Long but I didn't open anything to replace it such as FAS long, I wanted to wait and make sure there was a strong trade there. Right now, FAS/XLF long looks like one of the stronger positions out there for a market bounce."

On 8/14 the following was posted, XLF Trade Set-up & Update

"On August 1st I closed a FAZ (3x short Financials) position, Closing FAZ Long ...

"This is just for now to lock in gains, I'll decide later if I'm going to add a long like FAS for a bounce."

"It was already obvious at the time that we were going to be building a base of some sort and I didn't see the risk of holding FAZ any longer as being worth the potential reward..."

This is the actual chart for the XLF/FAZ trade set-up from the post linked above...
As you can see, the entry I was looking for in FAZ long was a break above the XLF range which happened today, thus the partial position entry today (about 75% of a normal position size). 

This is how XLF acted today upon a very parabolic move above the range...
 A clear 3C negative divegrence/distribution which is the confirmation we look for in a head fake move.

The daily 3C chart already shows the highest long term probabilities are down so the head fake trade will resolve to the downside putting the FAZ position at a gain, but I left a little room to add.

The Daily MoneyStream chart shows the distribution in XLF just as 3C does.

Ultimately it was the concepts (Understanding the head fake move" that allowed us to forecast this trade set up a week in advance, you knew exactly where to set alerts, what to look for and what the purpose of the trade was, a longer term position/core short.

This is an excellent example of the concepts linked above that can be used on any asset, any time frame chart for any style of trading. Now, it's just patience, letting the reversal process finish up, but I have my core positions back in place while keeping the 9% gain and getting a better entry with lower risk and higher profit potential.

As to the market today, we ended the day with VERY sharp leading negative divergences as you saw in EOD Market Update that were all at VWAP's upper channel, for instance...
 The DIA's deeply leading negative divergence. although this is part of the reversal process and expected to be seen, there are a couple of other possibilities.

Tomorrow is an op-ex Friday (not standard), there may be a pin lower. I think most probably though this has to do with Yellen's JAckson Hole appearance tomorrow. It may be someone knows something or it may be taking risk off the table in front of an unknown. The vast majority of pundit opinions is that she'll come out uber-dovish to calm the markets after the hawkish minutes yesterday. I'm not hazarding a guess, but if she's hawkish it won't be pretty for the market and the FAZ position will pay off, if she's dovish we may get a kick to the upside, but the FAZ position will still pay off as the charts are far too damaged.

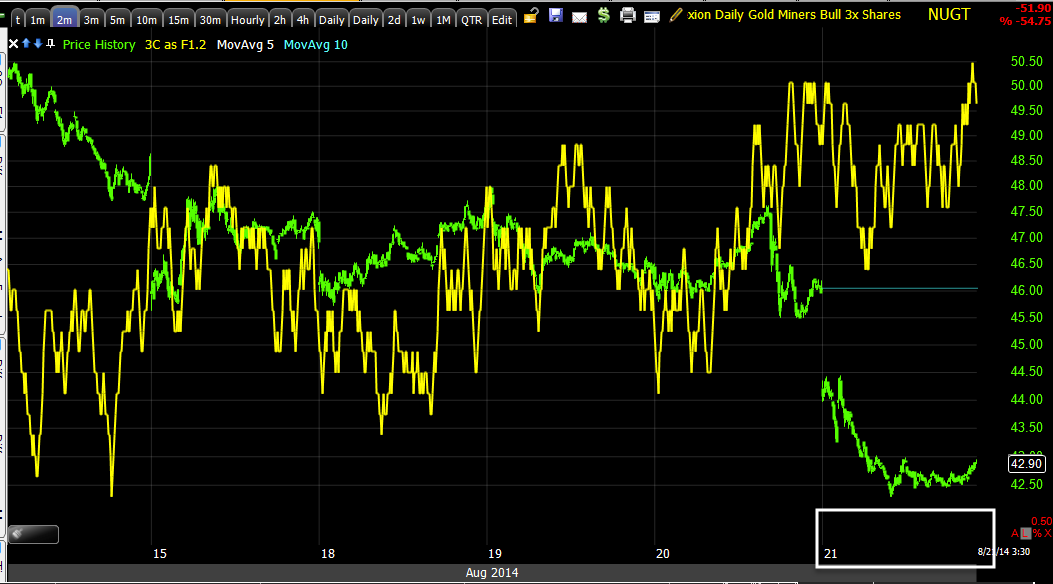
Gold as we saw today and GDX put in sharp divergences, although positive. Remember, these fell on the minutes knee jerk...


These charts are why I added to yesterday's NUGT position today, Trade Management: Adding 25% to Yesterday's NUGT Long , this wasn't dollar cost averaging to escape a losing position, this was a position entered with room to add in the risk management purposefully as I even referenced my willingness to add on a break of local resistance which happened today.

HYG has been deteriorating and is one of the leading indications that will be useful in timing our entries for our short watchlist...
As you've seen, HYG has been leading the SPX since the base started on 8/1 and reverted to the SPX yesterday (no longer leading), you can see a clear transition for intraday in line or price / trend confirmation to a trend of distribution and especially this week as we forecast last Friday. HYG started falling apart in to the close today.

Bonds are getting interesting, I showed the TLT accumulation on it's knee jerk lower on the release of the minutes, it keeps looking more and more interesting as mentioned in this morning's A.M. Update.

There are several potential reasons, chief among them is the lack of high quality collateral banks need which was addressed last night in Daily Wrap, F_O_M_C Knee Jerk Style..., particularly in the part about Bank Window Dressing and about 1/3rd of a trillion shortfall in collateral they borrowed from the F_E_D on a reverse 1-day repo setting a new record use of the facility to make their balance sheets look stronger than they are.

Another reason may be the rotation among pension funds out of stocks and in to the flight to safety bond complex. Finally today German 30 year Bunds and US T's hit a record wide spread with German bunds yielding 1.85% while UST's are at 3.19%. We'll be covering TLT a lot more in the very near term. Here's how it performed vs the SPX today...
This is TLT (white) vs the SPX intraday,  anyone notice a problem here? SPX is in a weak risk on trade (+.29% today to set a new record high, which is pathetic) while treasuries are rallying as a flight to safety trade at the same time... Perhaps it's the rotation cause by the reversal process? 

One of the other "Minutes" knee jerk moves was the $USD, I warned in this morning's update that there were negative divegrences there and $USDX looked like this...
 The 5 min $USDX with a negative divegrence has retraced a good portion of the knee jerk higher on the minutes yesterday.

Part of the reason the $USD was weaker today was Euro strength, here's the 5 min Euro single currency futures with a leading positive divegrence so I'd be on the lookout for additional upside in the Euro near term, we'll look at how it develops longer term in the days ahead.

As expected this morning, AUD/JPY led ES as you can see today.

I don't see anything that suggests an imminent decline for the carry pair.

Today's price action (other than the IWM intraday off the lows) was that typical low vol. melt-up that we saw back around the first half of the year with new highs being made on +0.10% moves, that use to be a flat day that was nothing but noise.

The major averages looked like this intraday...
The laggards were the recently very strong NASDAQ 100/QQQ and the recently strong, as well as recent short set-up and current partial short, IYT/transports which were posted as a set up yesterday, IYT/ Transports Trade Set-up. The Dow led at +0.36%, the NASDA lagged at + 0.16% and transports were the worst at -0.39%.

Like yesterday, both our Leading Indicators/Professional sentiment fell off again, yesterday was the first time in more than a week of confirming the bounce, today they looked even worse.
Note today's rapid rate of decline vs the SPX,  another clue we are well in to the reversal process.

I showed recent positive divergences/accumulation in VXX/VIX futures, that has grown from a 5 mi chart all the way out to a 60 min chart today and VXX is outperforming its correlation with the SPX.
Just another clue pointing to a downside market reversal.

As for market breadth, it barely moved at all today or yesterday.

 The Percent of NYSE stocks > than their 40-day moving average was 82% late last year, it should rise or hold with a rising market, it fell out earlier this year and recently git an unrecoverable point with lows within a week or so at 20%, worse than a full fledged bear market. This is why I expected a bounce, deeply oversold market breadth, but it has barely recovered and I don't expect it will. The orange hash mark shows how much breadth in this indicator has moved the last 2 days, almost nothing.

 I found this old note using the same indicator in which I was demonstrating how it was used to call a bottom at 2009, in similar, but opposite fashion, here it is calling a top now.

Note the inability to make a new high or even meet the last high even though the SPX made a new high today, this is bad news with almost half of all NYSE stocks trading below their 40-day average.

There was no Dominant Price/Volume Relationship today, not even co-dominance.

^ of 9 S&P sectors closed green, you might guess which one led, Financials at a gain of +1.18%, at #8 (second worst performing) was yesterday's leader, Industrials. There 's a lot of that today, worst performing yesterday are best today and vice-versa.

Of the 239 Morningstar Industry/sub-industry groups, 151 closed green, 5 of the top 10 were Financials.

Gold and Silver were the 2 worst performing sectors today (-2.39% and -2.19% respectively).

VIX has the look of a possible bottoming candlestick, while the Q's look the opposite. I still think the IWM makes another shot at a move higher being such a laggard.

Other than all of that, it's just a matter of time//patience.

Of course the main event is Yellen at 10 a.m. tomorrow at Jackson Hole, we'll see if she tries to tone down the minutes even though the market knee jerked on hawkish minutes, but as usual, the knee jerk reaction is almost always wrong.


EOD Market Update

As I said in the last post, I still think there needs to be more of a reversal process. Last Friday's "The Week Ahead" post's forecast for this week (last week's was for a rally/bounce off the 8/1-8/8 base) was the following...

"Today really skewed a lot of things (*meaning the news of the Russian convoy being shelled inside Ukraine which sent the market lower interrupting the distribution process), but just going from the trend prior to today, it wouldn't surprise me if we were very near the end of this bounce, maybe a day or two more, but I suspect we'll be seeing a lot more lateral (sideways) trade next week, a reversal process. which is where we'll find most of our short entries."

As you can see, the idea of a reversal process isn't a new one, it was forecast for the majority of this week almost a week ago.

Along those lines, it seems to be moving right along track, of course you're never going to pin every detail of the week, especially with F_O_M_C minutes and Janet Yellen speaking the same week, but I think it's pretty clear that as we made some gains Monday and Tuesday of this week, we had already entered in to the reversal process.

Here's what charts looked like in to the close which is interesting because 3C charts often pick up where they left off the next day of regular hours trade, which means these divergences in to the close may lead to early weakness tomorrow.

 SPY's intraday chart (2 min) for today...

Here's the same chart with an increased leading negative divegrence starting on 8/18, Monday or essentially the "Week Ahead".

 IWM, which has been an under performer so a little better performance today wasn't unexpected and it did well considering the intraday lows, however you can see what was done with most of today's higher prices, especially once IWM crossed above yesterday's close.

 The same chart backed out a bit showing a positive divegrence at last Friday's lows

QQQ 2 min today

And the same chart's trend with this week highlighted showing a clear change in character in 3C to the downside/ heavier distribution.

 While these 1 min charts (index futures) don't usually hold up overnight, they do tell us a lot about what the market's trend is . This is ES, remember this chart when you see it's chart with VWAP applied.

NASDAQ futures intraday (1 min) as well

And the Russell 2000 Futures, first they had to cross above yesterday's close, then they saw a strong leading negative intraday divegrence. Quite often some of the strongest divergences are in flat areas of price action like late today (yellow).

And here's VWAP, once again, the distribution signals are strongest at the upper VWAP channel which is the target area for market makers/specialists to fill sell/short sale orders.


Quick Market Update

I'll get some charts up ASAP, but the intraday (mostly 1-3 min) charts in the major averages are deeply leading negative, I still think they have to finish up a broader reversal process, but there's some very clear additional damage done today which is also seen in Index futures.

I wouldn't be surprised to see them lose ground in to the close.


Charts coming.

NUGT / GLD Charts

Yesterday I posted, Trade Idea (Swing) NUGT Long in which I thought GLD was also a bounce candidate, but didn't like the leveraged GLD ETFs vs GDX's. Then I posted the charts right after in GDX , NUGT & GLD Charts which went in to more detail,

"For now this is a trading position as there are still longer term divergences that still suggest a pullback in GDX and if there's a break below recent support that ends up being a head fake move, I'll have some room to add to the position"

Today's move in both GDX and GLD looks like a head fake move below recent/local support areas, again there are very fast divergences that have migrated to longer charts through today alone. The charts I'm posting below are especially meaningful when looking at today's action.

 GLD intraday with that typical rounding reversal process from today's gap down with a building leading positive divegrence.

That divergence was strong enough to migrate to the next longest chart at 2 min also leading positive

The 5 min intraday divergences I take very seriously as they tend to be the first or fastest timeframe where we see the movement of institutional activity intraday and this is leading positive like a rocket.

 This divegrence has moved all the way to the 15 min chart in a single day, it's not unheard of, but it's rare.

NUGT intraday 2 min shows similar activity as does GDX as well as GDX and GLD having a fairly tight correlation.

 NUGT 3 min with that same near vertical intraday divergence

And all the way out to longer intermediate timeframes like this 10 min in a single day. 

It appears something interesting is going on in the precious metals complex.

Trade Management: Adding 25% to Yesterday's NUGT Long

MCP Update

MCP looks like it put in a head fake move/ bottom as head fakes tend to come just before reversals.

The daily chart looks very interesting, if volume stays on track it will be a very high probability reversal candle.

 The daily chart's candle today is similar to a bullish reversal "Hammer", it could also be considered a long-legged Doji Star, also a bullish reversal candle and it could be considered both and a Harami as the real body falls in the range of yesterday's real body (inside day). The trick to any of the reversal candlesticks being high probability is increasing volume over the previous day which it looks like we'll see by the close.

The intraday charts just took off like rockets with leading positive divergences, this is more along the lines of the typical call / options position set-up that I prefer.

 3 min divergences, again a fast, sharp leading positive divegrence.

There are two support areas that could have been targeted . The concept of a head fake/stop run here is no different than the XLF chart, they are much different timeframes, but the head fake concept is exactly the same for the same reasons.

I see some volume at one of the support areas as it looks like some stops were hit or shorts sucked in. Either way, the long term charts are still in good condition so we'll see if this is the head fake move that turns MCP to the upside.

Market Map

Earlier in the week we had some good 5 min positive divergences building in assets like VXX and VIX futures, I'd never enter a VXX trade that early on, but it shows a process taking place away from risk and toward protection.

The VIX charts are continuing to build.

 This is a VXX 15 min chart, the 5 min positive divergences were strong enough and growing that they've migrated to longer timeframes like this 15 min chart,  I would not enter this as a long trade here because there's not a sufficient reversal process, but I do want the majority of my portfolio shifted back to the bearish stance (thus adding FAZ back today, but leaving some room to add to it).

As you know, VIX/VIX futures trade opposite the market for the most part, there can be differences in relative performance and they are often good indications, although subtle. The downtrend in VIX futures correlates with the market bounce off its Aug 1 through Aug 8th base, that's about a week long base with positive divergences on 10-15 min charts. It's not just the chart timeframe that tells us something about the strength as almost all of the averages have now hit our upper targets, it's the size of the base and similarly in a reversal / top, size counts as well.

In the area of the reversal process where you can see VXX's price rate of change start moving more to the side than down, VXX is building stronger divergences/accumulation while the market averages are doing the opposite.


Looking at a 30 min chart of the Q's, it was in line with price (moving together) at the rally/bounce area, but this week as we expected a couple more days in the bounce and then a reversal process to start, you can see the divergence form on a very strong timeframe, you can also see the rate of change in price changing as well and QQQ is moving more sideways than up.


Looking at the NASDAQ 100 Index Futures, again you see 3C confirming the bounce/rally until about this week where 3C goes leading negative on a strong 30 min chart as well.


VXX's divergence has continues to grow larger, this is no different than the market's positive divegrence as it grew larger from Aug 1 through August 8th, this is the process of a reversal.

We're even starting to see it migrate to a very strong 60 min chart.

Looking at intraday charts is a lot different than looking at a daily chart, intraday charts seem to drag on forever, but looking at a daily chart and the previous reversals both up and down, you see a proportionality to them depending on the preceding trend , top and base. If QQQ were to just head nearly straight down from here, you can see it would be out of character with the Q's normal trading character. there's a process for a reason,  this is why many technical traders won't take a divegrence on an indicator like MACD until there are 2-3, that's their rule, but if they understood why it's usually 2-3 divergences before the MACD signal is correct, it's the time it takes to create a reversal process.


This is a rough guess as we do have Yellen tomorrow and everyone has a different opinion, most that she'll come off as an uber dove to counter yesterday's minutes, some think she'll be hawkish, many think she won't get in to monetary policy at all, but taking away that unknown, this is what I'd say we have left in the reversal process, a bit more sideways either a rounding top as shown or a "W" or rectangle range like the base in white. I'd say about 80% of the time, especially if there's a clear resistance area formed during this time, we see a head fake move that shakes out shorts, brings in new longs and then fails, that's at #4. Number 1 is the standard cycle of base/accumulation, #2 is mark-up/rally, #3 is top/distribution and usually 4 would be decline, in this case I put in the head fake move we usually see right before a reversal takes place so what I have labelled as #5 is actually #4 in the cycle, decline.

For now, VXX as well as other assets are confirming the process is moving along.

Quick Market Update-More Selling at VWAP+

Intraday these charts are starting to matter less and less and the base positive divegrence charts that are in the 10-15 min range, the ones that stayed in line with the market's move higher all last week and part of this week are the main focus as they have been since the start, it's just now they have done what I was looking for them to do to give us warning that we are transitioning from a stage 2 bounce/mark-up trend to a stage 3 top/reversal process trend.

However the intraday charts (the IWM is a bit stronger as I suggested in an earlier post just because it has been such a laggard), clearly demonstrate the continued trend of distribution at the upper standard deviation of VWAP (Volume Weighted Average Price).

 ES hitting the upper VWAP standard deviation, which is used as an institutional/hedge fund measure of the fill the middle men tasked with filling larger orders in stocks they make a market in (market makers/specialists). This is where we expect to see distribution and often price drops back down to VWAP shortly after hitting this upper standard deviation simply because the demand at that level has exhausted itself.

The SPY which is connected closely to SPX futures above seeing intraday distribution at the upper VWAP channel.

The NASDAQ Futures are falling short of VWAP, I'm sure AAPL's lack of performance today is contributing to this falling short.

In any case, the QQQ seeing ditribution at the same area.

 TF/Russell 2000 futures which made a nice intraday comeback from the lower standard deviation to the upper...

And the Russell's ETF, IWM seeing distribution in to VWAP's upper standard deviation channel.


As for XLF, many of you may recall how long I waited with a partial FAZ long for XLF to break above its range in July, it started to become obvious that this wasn't going to happen without help, which means the simple concept of a head fake move (in this case something like a large Crazy Ivan) used for momentum to complete the task that couldn't be completed inside the range (as there was no incentive for retail to buy as there was no technical breakout or other technical concept in play) was actually predictable weeks ahead of time, this is one of the main reasons I closed FAZ on the first day of the move below the range (8/1), this is not what technical analysis would normally teach, it's the opposite in fact. TA would teach to short the break-down, but in this case it was being used as a bear trap/short squeeze momentum sling shot to complete the task.

 Today we got the XLF breakout above the range, the exact area I've been waiting for since July to add to FAZ and after closing FAZ August 1, the exact area I've been waiting for to re-open the position.

Look at the momentum from the head fake/bear trap to the short squeeze that finally gave XLF the momentum needed to break above the range, which in this scenario, (a very weak XLF which couldn't break above the range when it was inside it and much closer) means XLF is very weak for these kinds of tactics to have to be used, but this is what the head fake moves are all about.

See the two links on the members' site, "Understanding the Head Fake Move", they are predictable, they are easy set-ups which can be forecasted weeks and in this case, nearly a month in advance.