Thursday, July 28, 2011

Closing Wrap

Today and yesterday have both been interestng and for me, gut-wrenching days. Both days the 50-day moving average was broken on large volume, but so far the market ha faled to cascade in a waterfall move down. I don't need to repost the many postive divergences that have occurred yesterday and to a larger extent today.

The Price/Volume Relationship, price again, is dominant at Price Down, but unlike yesterday's volume up, today is volume down. To give you some idea of the dominance, this relationship covered half of the Dow, half of the NASDAQ and nearly half of all of the NYSE component stocks, considering there are 4 possible combinations, that is dominant and impressive. It's also an interesting relationship in that is is one with the least bias. It happens to be the most common relationship during a bear market, but we are in a different situation as volume was still respectably high.

My take on the relationship, the urgency was not nearly as pronounced as yesterday with regard to selling.

If these positive divergences are to play out, it will have been one of the best head fakes we have seen n awhile, a LOT of shorts would be trapped in a bounce that would likely be so scary, you would be questioning if a new bull run was in the works. That would be the entire point of bouncing the market here and the short sellers covering would just make the upside that much stronger. There's no good reason to bounce the market here other then to suck in longs and set up a major short position and to do that, the bounce would have to be very convincing.

Since my expectations from last week were for a move through $135 on the SPY and 12,750 on the Dow-30, this possibility does not seem that far fetched to me. Those were the levels I thought the market would need to break to lure longs back in to the market with some confidence.

Ultimately though, price is always the final say and the while we have some indications that have caused me to shift some things around and may have given us an edge, price will need to follow through and make the move.

Remember, the fact that the market didn't move higher today on the positive divergences doesn't say anything about their validity. A positive divergence can last for several more days and the longer it lasts, the more impressive the following move will be.

So for now, stay nimble, make sure your risk management is up to snuff, maybe raise a little cash and position your portfolio in a manner which is consistent with your outlook. Tomorrow 3C will give us more information as will price. Hopefully the pieces of the puzzle will start to form a clear image.

I expect it to be another gut-wrenchng day. I personally have closed out some short positions and have started opening a few long leveraged ETF positions. The Russell 2000 looks to be one of the stronger positive divergences out there.

As for the Euro, tonight it's sitting pretty close to some support, which could possibly mean weakness in the dollar, which is inversely correlated with most asset classes.

See you in the a.m.

The Miners Trading System

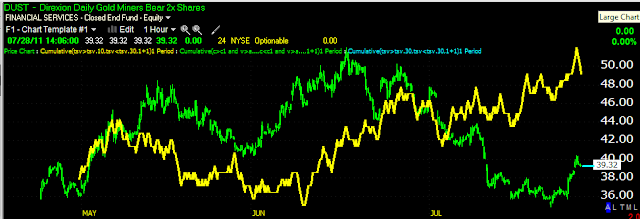
Yesterday we had a buy on today's open (DUST) signal in system 1. Tonight both systems are long DUSt, if you are following the trading system rules for system #2, you would purchase DUST on the open tomorrow at market open. Buying on the open is important, much of the gains come on a closing basis.

All positions in NUGT would have already been stopped out.

I noticed some problems with DUST today and the close was poor, forming a bearish Shooting Star candle on high volume, which in this case would be indicative of churning, also bearish.

 The 5 min chart above was showing a negative divergence at the morning highs, there was some improvement late in the day.

The 1 min chart showed very good improvement very late in the day today.

You'll have to make the decision, remember there's a 3% stop-loss from the opening price. For today's system 1 trade that stop-loss is $34.97.

The long term 60 min chart still looks very bullish.

There is a loose correlation to gold with the miners and GLD did show an impressive 10 min chart today, which would historically not be good for DUST as far as the loose correlation goes.

GLD 10 min 3C chart.

QE For Congress?

I will have my nightly update as well as the miners signal a little later tonight, I'm going to decompress and have dinner with my family and then look at the market with a fresh pair of eyes.

In the mean time, here's an interesting story that may have some influence in some of the market action we are seeing now. The Fed to the rescue?

A QUICK LOOK AT LEVERAGED ETFS

 FAS Bull Financials

 FAZ Bear Financials

 QID Short the Q's

 QLD Long the Q's

 SRTY Short the R2k 15 min

 SRTY Short the R2k 5 min

 URTY Long the R2k 15 min

URTY Long the R2k 5 min

Kind of interesting.

SPY Inverse H&S

Earlier I posted what looks like an inverse head and shoulders in the SPY and asked the question, "How is Wall Street going to game such an obvious pattern?"

In a few subsequent emails with members I and they pretty much agreed there's only 1 way and that way is likely to give me an ulcer, but it's too obvious on the charts, Wall Street never lets patterns like that do what the Technical analysis books say they should do and retail traders never adapt to that fact.

So we are seeing the conclusion I came to-they have to shake it out to the downside, which certainly contributes to me getting an ulcer!

And what went from an Inverse H&S is now looking like a more random and less bullish pattern-operation shakeout a success.

However, I still can't ignore these charts.

 1 min.

 5 min.

15 min.

Something seems to clearly be going on under the surface here.

Sector Rotation

First is the intraday, then hourly and then the daily since May 1st.
 Today Financials saw a jump as well as Health Care, Basic Materials and Tech . Industrials and Utilities are lagging.

 Click on the chart for a larger view.

AAPL Update

In my last AAPL Update today I saw a negative 1 min divergence and some positive longer term charts, the 1 min divergence lasted longer then expected, but finally played out.

 Here's the break of intraday support and all of the stop-losses and algos kicking in.

 Here's the 1 min negative divergence referred to earlier, apparently distribution lasted longer then I thought it would.

However, the 15 min chart is in a leading positive divergence right now, I suspect this chart will look a bit better later today as it is probable shares were just picked up on the break of resistance.

Market Update

Ooohh, I really hate these transient moments in the market and the "going out on a limb" posts, but it comes with the job and I will never withhold information because I'm afraid of being wrong, I owe you guys the fact of what I see. Besides, when I get those emails about the great trades you all have made, it makes it all worthwhile.

So here goes...
 The DIA has been the laggard, but the 3C version used for the DIA is also one of the slower to react and is better for longer term in general. So here's a 10 min positive/leading divergence formed today in the DIA.

 Surprisingly, here's a 30 min relative divergence yesterday and leading today-surprising because this timeframe usually takes days to move like this.

 The IWM 15 min in leading positive position, again surprising to see in a single day.

 And once again, the IWM 40 min, you can see the last time it went positive into a falling market around the 18th and the top, now looks similar to the 18th.

 The SPY  1 min just went the total opposite direction of the market.

 SPY 5 min is holding together well in leading position

And the SPY 15 min...

Those are the charts...

DUST Update

 The 60 min DUST chart-I like-good potential for DUST.

 Today's 5 min chart, I'm not very keen on.

The 1 min chart appears as if the intraday pullback is over.

DUST generally moves the opposite of the market, f yesterday was s short term game changer tactically speaking-NOT strategically, then a market rally would likely send DUST lower until it ends.

Therefore, you may want to consider using any intraday strength today to take partial profits, or perhaps just exit the trade with a nice 8% 2-day profit. Things are very transient right now and I prefer to commit money to sure things, the 5 min chart looking the way it does has me thinking these are not the odds I like to commit money to.

Possible Inverse H&S-SPY

This is a 5 min 3C chart with what could be a possible inverse H&S reversal. 3C looks pretty good for the pattern, I'm just trying to imagine how it would be gamed as it is probably pretty evident to most technical traders at this point.

Market Update

 Intraday pullback in the IWM, it is starting to build a positive divergence-

 The IWM 5 min chart looks very strong short term.

 Here's the same pullback and now positive divergence building in the SPY

As you can see, the pullback did no damage to the 5 min chart which is leading.

I would expect an intraday move up shortly.

USO Update

We have some newly emerging short term positive divergences in USO

 The 1 min chart...

 The 5 min chart in leading position...

And the 10 min chart in leading position...

USO just took out local support as well, I would set some alerts especially on the upside as this could very well be a head fake move.

AAPL Update

AAPL may make for a decent little intraday to even a swing trade.

 AAPL 10 min 3C with some accumulation yesterday and a leading positive divergence now. It looks like AAPL wants to go higher.

 The 5 min chart is in a leading positive divergence as well.

Here's the kicker, the 1 min chart suggests a pullback, so AAPL may be able to be bought on a pullback at low risk with a better entry point and then taken for a ride higher.

Market Update-SPY

I said a few things in last night's market wrap that I want to revisit.

"What seemed to be a positive divergence intraday, didn't look so hot at the end of the day. I just heard someone dumped $3.3 Billion in E-mins at the end of day. The market also closed below the 50 m.a. on volume, it is hard to imagine a bounce from here, however we'll have to let the market tell us."


"As for today's dominant Price/Volume relationship, it is easily Close Down/Volume up for all of the averages. There's a dual edge to this relationship, it can be a sign of a serious break in the market and it can be a sign of a serious oversold condition.  Since we are so close to the 50-day moving average, we cannot rule out either possibility. The divergences that formed earlier today weren't strong, only on the 1 and 5 min charts with one exception, these are usually little more then a 1-day bounce. However, such an overwhelming P/V relationship in such proximity to the 50-day moving average can set up a nasty bounce up although it doesn't look or feel that way now, we must reman open to the possibility of this happening even if it is remote."


"The key thing to remember is how bad the longer term charts look and even if we were to see such a bounce (it would likely be a scary upside bounce with so much selling today), we can't take our eye off the ball and that has been, as mentioned above-since June, the next shoe to drop is going to be very ugly on the downside; just consider the breadth posts I put up a little over a week ago."


The point of the above comments was not to sit on the fence and try to be right either way, the point was, there was a unresolved positive divergence, even though it was on the short timeframes it lasted most of the day. Secondly, with a break of the 50-day moving average, a lot of traders are going to run to the short side of the ship, this is a perfect opportunity for the market to use Technical Analysis against it's practitioners. There are very few times I have seen Wall Street lose control of the market, typically, they are planning very far out n advance. I use to get the internal trading memos from a large Wall Street firm, I couldn't make sense of them simply because they were thinking so many steps ahead, nothing they talked about seemed remotely possible looking at the charts. Some of you may also recall that while I was teaching, I use to show charts of the homebuilders which were under accumulation in a quiet lateral base for well over a year while the tech bubble had exploded and we were in a bear market. The point of showing these charts was, "Who would have thought after the tech revolution had started, that the next major trend was going to be in housing?" Well Wall Street knew and was accumulating positions almost 3 years before housing really took off. The point being, once in awhile they do lose control of the market, but more often then not, what we are seeing today has been planned out far in advance. Just look at my July 15th post, "What Can We Expect After Op-Ex Today?"  I could not have posted an outcome that was so accurate over the next week if I hadn't been able to see the underlying 3C action which was pointing to exactly that outcome. Over the next week, everything played out exactly as posted on July 15th, from the dip on Monday to the bounce through the rest of the week.


Now we have to prepapre for what may be comng next, the 3C charts wll develop and give us a better feel, but this s my initial idea and this goes back to what I had been expecting last week.


 As mentioned last night, when the Price/Volume relationship is dominant (among the 4 possibilities) as it was last night, we have to pay attention. Last night's P/V relationship was close down/volume up and it was easily the dominant relationship. Rarely when the market really breaks away to the downside this relationship will appear, but more often then not, it's a short term signal for a reversal. Just look at the chart above and the 2- heavy volume days and what happened next.

 Here's the intraday price acton, already above the average accumulation level.

 Here's the 3C 5 min chart which showed a spike in the divergence as the market broke intraday support as well as the 50-day moving average. Wall Street knows full well that traders are watching and acting on the 50-day moving average. The white box indicates improvement in the 5 min 3C chart as it leads.

 Look at the positive divergence at the break of intraday support on this 15 min chart and note all the volume, this makes it very easy for Wall Street to accumulate a large position openly as they are simply taking the other side of the trade. The 15 min has improved today as well, in a leading divergence.


 I also warned last night that it could be a "Scary" move up and as 3C develops we'll have a better idea, but the 15 min chart being so positive right now is a strong signal in itself. Last week I was expecting a breakout above resistance, and that's where I think Wall Street will go massively short when the bulls step in as buyers, the reverse of yesterday. I've had this opinion for some time, so to see the early manifestations of the possibility, I lean toward this opinion. Of course if 3C changes, I'll let you know. I'm not in the business of guessing where the market will go, I bring you the indications I see.

This would be the breakout level on the DIA. 


As of today, I'm going to lighten up a bit on my shorts and perhaps hedge a bit until this becomes more clear.