Friday, July 24, 2015

*Important* New Website Update

Thank you for your patience with the new website, and duplicate emails today. Once we added all the members and tested the site today, we found that we need more email capacity.

For the time being the new website will still be open for you to look around at functions, but all posts will continue next week on the current Blogger /Groups system until we can integrate a new mail server with more capacity.

We will automatically unsubscribe you from emails from the new site so you are not receiving duplicates and Monday we'll carry on as usual with updates as we move forward with the new site.

All of your login and password information is the same so you don't have to do anything.

Thank you so much for being patient with the duplicate emails today, I'm truly blessed to have such a fantastic group of people.


Have a fantastic weekend!

The Week Ahead

There are numerous smaller indications that make me think we either open higher early next week or we try to put in more of a base for a bounce, but I mean bounce in the most nearly meaningless way, nothing I would trade (other than a speculative position) and nothing that would make me think that our course is going to be interrupted by anything more than some short term noise if that.

I went through the Futures charts, it seems the 30 year Treasuries are showing the same thing as TLT, which could be the leading divergence in yields will flip and support a short term bounce which I would only use to short in to , or perhaps as it was just before the July 10th bounce when the carry trade was being unwound, Treasuries too will be unwound due to liquidity concerns and Yields will stop working again as a leading Indicator.

That said, there is some very near term support for the market in assets like HYG, but nothing that would be of much more interest to me than the speculative IWM call, partial position.

 The ES 1 min chart shows the overnight distribution in to higher prices as mentioned this morning and in line to reversion to the divergence as of just before the close.

TF/IWM futures which have taken it on the jaw the hardest, look more likely to try to bounce, thus the last post. However if we get more market dispersion between the averages, there's no way that can be considered bullish for anything other than the very short term period of the bounce.

The SPY 3 min chart today looks like it has been putting in some accumulation for a bounce early next week, whether it's out of the gate on Monday or needs to do a little more work, I can't say, it may just fail as several divergences this week have been run over, but not 1 was strong enough to make it to the 5 min charts.

The IWM 3 min looks even better to me and I could see a quick lightening bolt shaped bounce, but I don't expect anything to hold. As I have said several times this week, it would be absolutely normal behavior even during a full blown bear market.

As for the longer term probabilities, this ES 10 min chart should be VERY clear as to which way probabilities lay.

This Es 30 min chart of the bounce should be even more clear. No 1 or 3 min charts are going to change the path this juggernaut is heading toward, at most they'd be like waves crashing off its bow.


 If you need more, the NDX futures 2 hour chart leading negative at a new leading low.

 And the Dow 2 hour futures, this isn't a recent trend and that's why we knew the bounce would fail before it even started.

 As for 30 year futures, this 10 min chart is a reflection of the TLT charts seen. This may mean the Yields leading indicator stops working again. I need to do about an hour's worth of analysis here, but Treasury market liquidity is very thin and a lot of traders are getting very nervous.

 The $USD 7 min looks like it could bounce a bit from here supporting a very near term/short term bounce.

 However beyond that at the $USD 60 min chart, the highest probability is down which makes a rate hike more likely and market downside as well as a lot of commodities.

 The $USD 2 hour looks as we have expected, the $USD is in a primary downtrend, the F_E_D needs it to be- or at least it will continue the trend started.

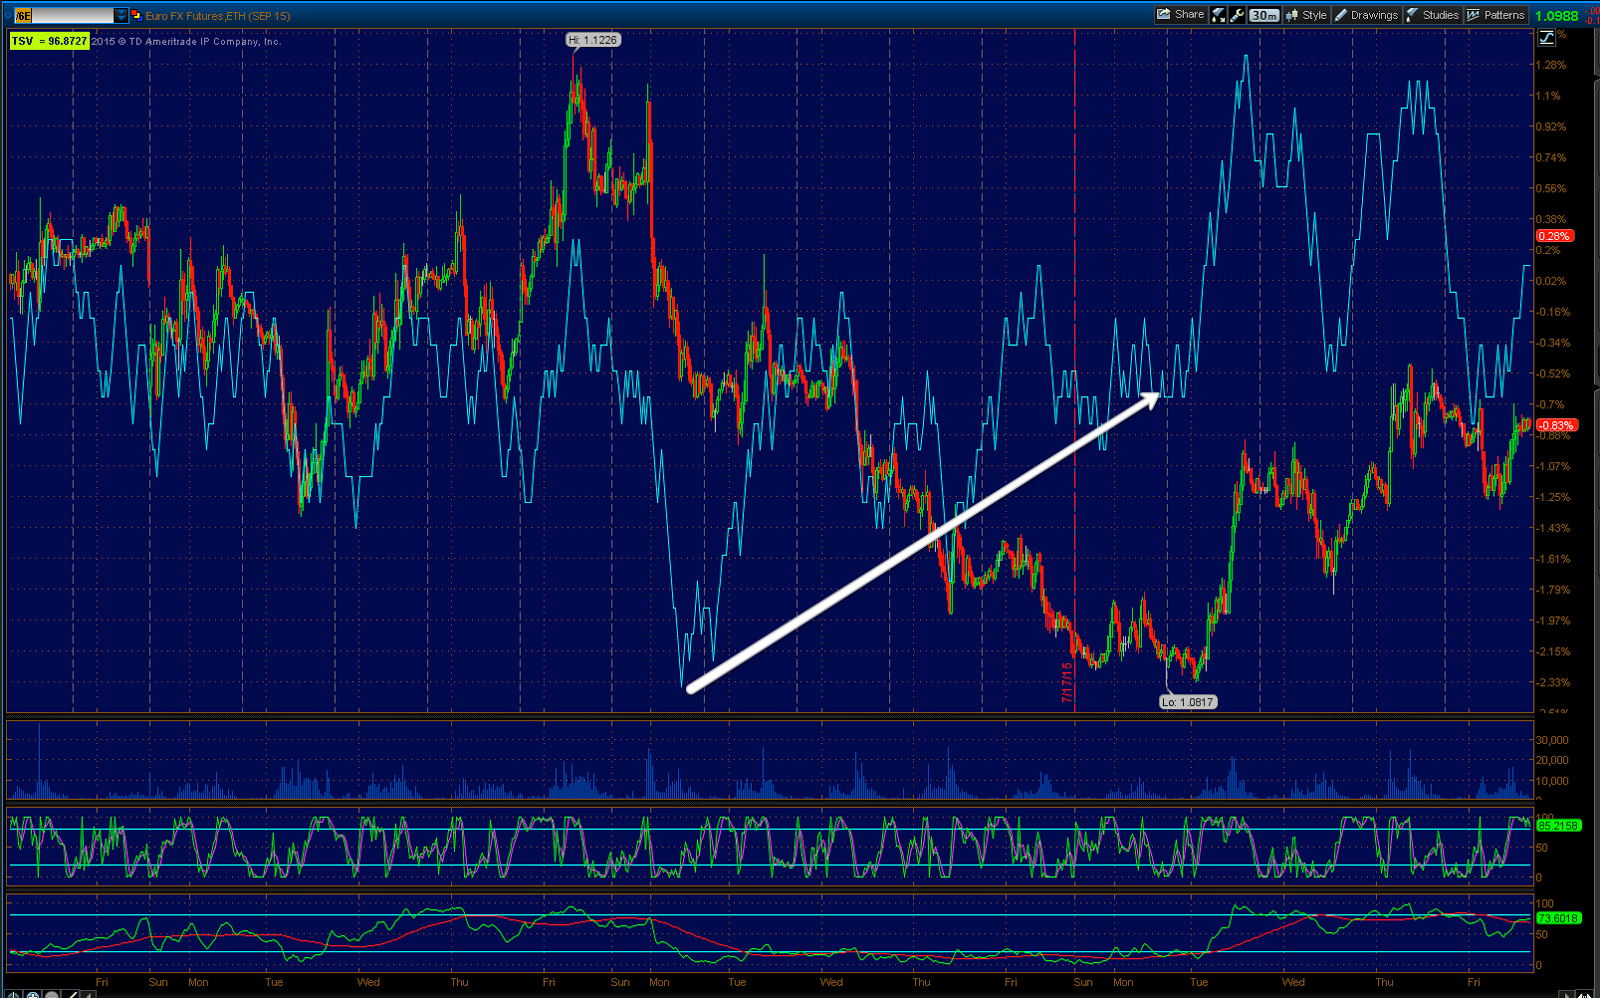
 As for the 15 min Euro it looks as we said earlier this week, consolidating for more gains, not good for the market.

 The Euro futures 30 min shows the same.

 As does the Yen futures 10 min, right at the exact area I guessed it would consolidate in to accumulation.

 And the Yen 30 min. This would facilitate the carry unwind not just in the FX pairs, but all assets financed with carry proceeds, bonds, equities, etc.

 As for VXX, the 2 min chart has a VERY slight negative.

 The 10 min chart leading positive in a big way. UVXY longs and VXX should do very well as the market moves the opposite direction.

 And VIX 30 min futures showing the same.

As well as VIX 2 hour futures.

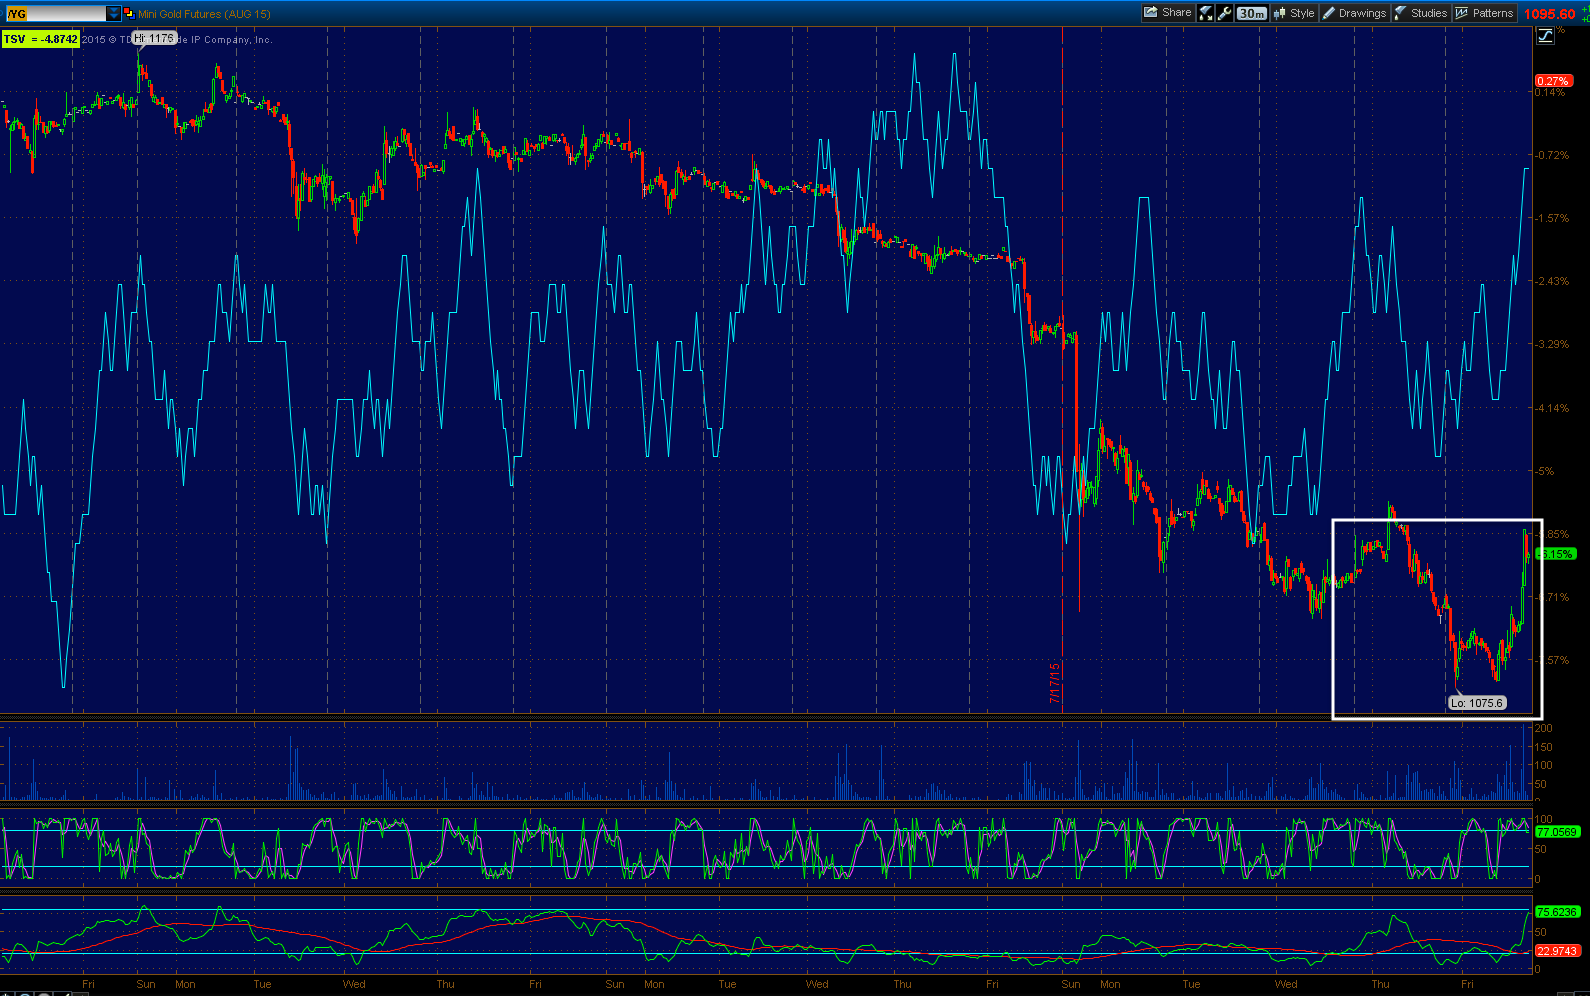
 Gold has bounced here off a weak base, but I'll let the open GLD calls work until it looks like they won't anymore. We still have a mystery in the gold slam downs, I suspect it's part of longer term basing, but we'll know more next week.


Other than that, this is what I expect to see in the market within the next week or so...
Stage 4 of the bounce concludes slicing through the 200-day moving averages, once that happens, the entire tone of the market changes and things move much more quickly and more volatile.

Have a great weekend, I hope you had a good opportunity through this bounce to get some decent short positions in place for longer term trend trades.

Trade Idea: VERY SPECULATIVE

I'm going to try a VERY speculative (half size position) in IWM $122 July 31 Expiration for a quick bounce.

I have more than enough short exposure to offset any losses.

FX Update

I'm getting ready to go through the 100+ Futures charts in getting ready for next week, but I have a pretty good idea where we are going. I often post the 4 stages of a cycle because you have to know where you are to know where you are going or at least the highest probability.

In downtrends like this we can get some monster looking bounces , even intraday which is what I have suspected we may be building up to today, but so far beyond that, I'm not seeing anything really convincing that would take us of course in what I believe the next significant downside target is, which is a break below the SPX's 200 day.

As for the Carry trade intraday as I don't have much reason to believe it can do much more than a very short term move based on what I've seen in the Futures charts this week, it may be able to offer some support through the close.

 This is USD/JPY in candlesticks and ES in purple since the bounce cycle. ES follows the USD/JPY almost perfectly. but remember the earlier in the week warning of being careful about what assets you choose to trade and making sure they are liquid as even a winning trade can be difficult and sometimes impossible to get out of in a market like this when liquidity is low in the asset, this happened to me with SKF years ago, but had more to do with the discretion NYSE specialists have over NASDAQ market makers.

There was another analogy of a crowded room and a shrinking door, that's the panic of a bear market and the reason they fall approx. 2.5 to 4x faster than a bull market rises. Note to the far right ES has dropped correlation with USD/JPY, that's fear.

 This is the USD/JPY intraday, it has a negative divergence ore-market and taken alone, I wouldn't think there would be much opportunity for it to turn to the upside intraday.

 However the EUR/USD which if it turns down would help the $USD and by extension. likely the USD/JPY does have a negative divergence in it, this is a 1 min chart though so it's not something I'm considering beyond this afternoon in to the close and "maybe" early next week if it were to show more weakness.

 This is the $USDX  min chart, slight positive as it loses some downside momentum.

 This is the Euro intraday (futures) also with a negative divergence like EUR/USD which could be helpful to $USD upside.

 And 1 min Yen futures negative, again, if it worsens and they come down, it would be helpful to moving the USD/JPY up and that would give the market some intraday support, possibly in to early next week if it were to strengthen or rather weaken in this case significantly more.

 USD 3 min positive

 Euro 3 min negative

 Yen 3 min negative.

Those are NOT screaming signals, they are not on 5 min timeframes.

Really the main concern I have near term for the market's downside is the TLT  divergences which could support a market bounce.
 The 1 min chart that I just started noticing yesterday is very clear today.

The divergence has migrated through several timeframes and is leading at the 5 min.
TLT 5 min.

Remember that Yields which have been leading the market, trade opposite bond prices so a drop in TLT/30 year Treasuries would send yields higher which is what equities have been following.

Quick Intraday Update

Really this is where I should have taken QQQ puts off the table. Are you watching the volume as we near the 2 pm hour, SPY volume looks very close to an intraday flameout or capitulation/short term selling event. Keep an eye on TICK as well.

 SPY

 IWM

QQQ

Looking like an intraday flameout on the downside. Watch TICK. There's also a possibility USD/JPY is about to reverse very short term. If anything develops from here with what we have now, I'd expect more of a parabolic "V" shaped intraday move.

Quick Update

Intraday tone seems to be changing a bit and right on time for the 2 pm hour. I'd watch TICK,
Which is showing some very recent improvement and as always, watch volume intraday for a downside flameout.

I'll have updated charts in a few minutes.

Leading Indicators

Leading Indicators are looking interesting as they are clearly in line with the stage 4 trend and worse on a longer term scale or bigger picture of the market, but intraday, they look to be either putting in some support for the 2 pm post pin market action which can include a bounce or perhaps something a bit larger in to early next week. I don't want to read too much in to these signals, but it's also hard to just pass them by when you see how accurate they have been intraday as well as the TLT changes.

 This is the SPX:RUT Ratio in red vs the SPX in green. At the start of the bounce's base the indicator is positive, you can see where it puts in a clear negative at stage 3 and the head fake area and more recently a relative positive in this area.

 Intraday it was very negative on the open taking price down, but has since flipped to a more positive intraday tone.


 Our Pro Sentiment Indicator has been ruthless to the downside and still is, however...

 While I don't want to read too much in to this intraday, it is a similar signal throughout leading indicators intraday which makes me think perhaps the post pin (2 pm) action may look different than the earlier price action and perhaps lead in to early next week.

Our secondary confirmation Pro Sentiment Indicator is choppy and sloppy, but has a more positive tone intraday,

This is a reminder of the saying, "Credit leads, stocks follow" as HYG leads the SPX lower, however there has been some very light, short term positive action in HYG, I wouldn't expect pros to put any kind of real money in HYG, but they seem to be trying to dip their toes in and I see no reason other than the typical support they tend to use HYG of since it's already in a bear market.

 And HYG vs SPX intraday, again note how accurate it is even on an intraday basis.

 This is the HYG 1 min 3C chart.

The 2 min is positive as well as the 3 min and it has a much more lateral look than the market averages.

While there's no VIX slam, it does appear to be underperforming as of this capture as it should be seeing a higher high to the right.

And Yields as mentioned earlier through the bounce cycle leading to the upside then to the downside.

Intraday though, they too like all of the other Leading Indicators have moved sideways and slightly up.

The asset that has a direct correlation to their movement is bonds, in this case the 20+ year TLT with a 1 min negative that saw some intraday support, but overall it keeps getting worse.

This is the 5 min chart now in TLT leading to the downside a lot more and a 5 min divergence intraday is a pretty significant thing.

As to that bigger picture, I was showing the custom TICK and it was a bit harder earlier in the week to see the deterioration in TICK, although I could see it, I imagine most of you could. Here it's very clear.

Keep an eye on the intraday TICK around 2 p.m., I suspect we are either seeing support for post 2 pm  price action or perhaps the start of a bounce finally that is a bit larger in to early next week.

I'll have a market update out soon as well.