Tuesday, November 12, 2013

TLT, Yellen and some odds and ends

I was thinking about how quiet Janet Yellen has been, I don't think she's said much since April and this week she'll be in front of the Senate Banking committee going for confirmation on Thursday.

I have to wonder if she won't take on a more hawkish tone than would normally be her demeanor? Especially when questions come in about this month's Non-Farm Payrolls blowout, many would wonder why that isn't proof that tapering should begin and Yellen may have to tread carefully as these aren't people there to listen, they're minds are made up, they're there to grill.


On another note, looking at the dominant Price/Volume relationships tonight, there's no single dominance, but a co-dominance of Close Down / Volume Up which is generally taken as short term oversold and Close Up/ Volume Up, which is the most bullish of the four combinations, but often taken as a 1-day overbought condition, however I wouldn't think too much about it as not one average was dominant.

What does catch my attention is not the CBOE's SKEW Index reading, it's how fast it's moving, this is an indicator that tries to predict an improbable event, a Black Swan or market crash. $115 is the normal range, $130's is elevated, but it's the recent ROC that caught my attention.
Recent Rate of Change in Skew is a bit alarming.

I also am starting to like where TLT is ending up, you may recall I had a core long and closed it on pullback signals for a small gain, I'd like to leverage it by shorting TBT, but the $100-$102 was my TLT target area and we are getting close.

For some reason I don't like 10 year treasuries as much, they do look like they can bounce with TLT around the same time, but they haven't had the same consistiency many, many times over the last several months.

 TLT was clearly going to pullback, in April I actually thought it would in part be to help the market move higher. I took a position around August and closed it out for a small gain seeing a pullback coming and have been waiting for $100-$102 ever since and now we are close.

The 60 min chart which has been helpful.

The 15 min is showing that basing action I expected to see around the $102 area.

And here it is again with more detail.

TLT is 20+ year treasuries so here's the 30 year Treasury futures 1-day.

Obviously I like this too. I just think TLT needs some leverage and a stop really isn't too far away, you could do 3 or 4% on the position and way below the 2% rule, even with leverage, but I'm not interested in options, this looks like it will be a longer term trend.

I don't understand it, but have watched it develop for a while, the 10 year though just doesn't have the same look, interesting.

Otherwise, we'll look at gold from a different perspective, I envisioned one of 2 pullbacks a shallower one which we blew past that could lead gold up on a sub-intermediate to intermediate uptrend, like a strong counter trend rally or if gold pulled back enough to widen its base, then I envision an intermediate to primary uptrend or bull market.

We'll take a closer look and at gold futures too, I think the December contracts have plenty of time to benefit from a move on the upside, depending on what we find, it may even be an equity long that I'd be more interested in, even if we get a counter trend bounce, hey- they are some of the strongest rallies out there.

Futures tonight don't look great to me, it's that 5 min chart that's really nasty.
 The 5 min chart leading negative, unlike Thursday. Remember earlier I said 1 step at a time, well...

 Just looking ahead, the 30 min chart and...

This tells me that the funds that have come out and said they have been selling everything including the kitchen sink for the last 15 months are done and have nothing to lose, this daily ES chart of 2013 tells me that these guys weren't lying.

 RUSSELL 2000 FUTURES 1 DAY AND A BROADER PERSPECTIVE...

NASDAQ 100 FUTURES, 1 WEEK. There was damage before 2013, but the damage picked up in 2013 incredibly, the same time for the first time the F_E_D let on that they were looking at possible exit strategies, before September of 2012, they'd never even hint at hinting of something like that.

1 step at a time, but sometimes the market makes moves that skip a few flights of stairs, just saying, I've seen a gap down take out several months of longs and there was nothing they could do about it.

Retail bullish sentiment is strong and arrogant.

See you in a few hours, it looks like we might be looking at a lower open, especially if this Yen positive divegrence- 5 min + I'm watching lifts the Yen and drops the carry crosses, although as you saw today, even they have little power over the market, even with an out of no where Yen smack down.


Some Charts To Get You Started

I'm going to look at lot closer to today's action, but I have a feeling I may be looking for something that just doesn't exist, something other than pure vanilla, plain old market weakness.

I mentioned ES as it seems that way just from price action, remember VWAP is a tool used by institutions to judge how good of a fill a market maker or specialist got them.

 ES/VWAP, in this configuration, the bottom channel to VWAP in the middle, this would normally be selling, it looks like every time price fell away from VWAP, some attempt was made to get it back up there where an order could be executed. Whether it's VWAP or not, there's some thing VWAP-related going on.

As I said about the averages, short term intraday and others...
 This was the SPY w/ a positive intraday yesterday, it didn't go anywhere and today's didn't get far, in fact the positive around 2:45 was apparently to lift ES off the lower VWAP channel-look above.
 Longer chart, but not much like 3 min, pretty clear, note the mini cycle, what we saw, why we called it that and what has happened since.

 SPY 5 min is clear, the mini cycle is there, it looks like it was there for a reason, but other than distribution at higher prices, I don't know what else it could be at this point.

 QQQ intraday is just a mess, no real trend at all.

 That means you go to longer charts like the 5 min, the mini cycle is clear and so is the leading negative after it.

 QQQ 15 min around the mini cycle shows why there may have been a mini cycle to start with, this was and is falling apart in the area pretty quick.

IWM 2 min with the cycle and the deterioration today after yesterday's weak showing.

 IWM 5 min chart with the entire trend, it looks pretty clear in 3C and price action alone.

Here's the larger 30 min, 3C is clearly leading negative badly, note the rounding top. We seem to be rolling over.

As mentioned, before the mini cycle or as it was identified., but before prices moves, I noted 5 min positives in the Index futures, now look at the 5 min leading negative for ES.

 This is ES 5 min

And I said it is through 15, 30, 60 min and more charts.

NQ 4 hour, nice rounding top, it's the process though, not the price pattern.

TF 5 min.

As far as credit among leading indicators
 HYG vs the SPX even worse today, HYG's close yesterday is at the red arrow.

Note HYG's lack of enthusiasm as ES tried to move to VWAP around 2:45

 Every time a positive gets started in HYG, it's just run over, I don't think the pros want to be holding it when things get ugly.

 Junk Credit acted the same way today, no excitement at the EOD bounce attempt to VWAP.

No 3C attempt to get anything going.

As for sentiment which has been pretty reliable.
 Yesterday's more bullish sentiment did NOTHING for the market today, it fell in to line today.

Our second sentiment indicator did worse, especially at the move to VWAP this afternoon.

As for VIX, I said yesterday it was unremarkable, today seemed to show a bid uin UVXY/VXX and VIX futures.
 UVXY giving a nice clean reversal pattern with 3C support.

The 15 min VIX futures also caught a bid, I believe it can even be seen in spot VIX.

As for currencies,
 This is the 1 day Yen 3C chart, if you read the articles linked on the members' site, you'll see that my opinion has been when the Yen rises, the market will fall with it, this triangle is very tight and 3C is very positive.

 The 15 min $USD is a bit tough to call, it ran up on the bad NFP report and that's a QE off response.

When we look at the longer term though
The 4 hour chart looks like whatever noise the $USDX might see very short term, it's going higher, a QE negative signal.

As for  carry pairs, they are the candlesticks, ES is purple...
 The long term 4 hour EUR/JPY has clearly fallen away from ES, it's hard to imagine much support on anything other than a very short basis.

Intraday the EUR/JPY outperformed ES, so ES couldn't even take advantage of the pair that has been lifting it since November of last year! It's the "Go to" asset to move the market and it can't!

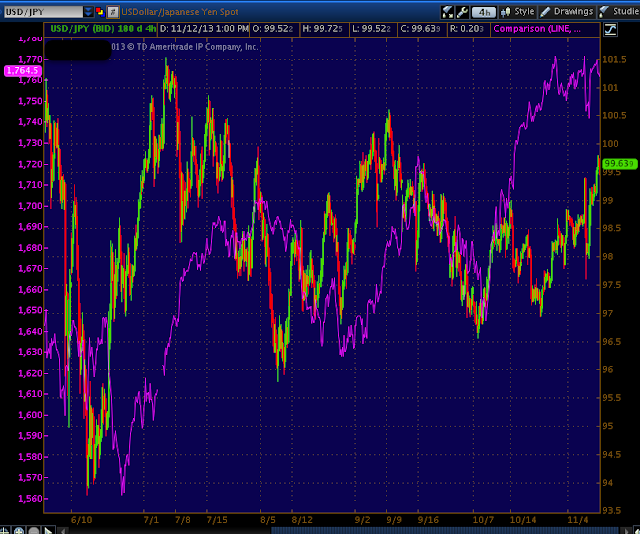
Today it seems the $USD/JPY was a closer match, however

This pair on a 4 hour chart isn't offering much support either.

It really seems like they are running out of tricks, they whacked the Yen, it worked last week, didn't work this week. VIX smack downs aren't getting it done. Even a clear range RIGHT THERE isn't getting it done. Now Credit looks to have left the building and not even the carry trades can carry the market?

I do think we may have to move very fast very soon, but until that point which will scream and jump off the charts, why would you want to trade this 2 + weeks of pure lateral chop, drifting down?

Patience is the hardest lesson for me and many of us, but it's also one of the most valuable.

I'll be back with more as I dig up more.

Strange, Strange Market

I'm going to urge patience, there may be some things we come across, but there was definitely a reason for the cycle that started to be put together Thursday and moved Friday.

I now think it may be more about getting out of whatever positions possible at or near VWAP.

Earlier today around noon CONTEXT was +10 points, now it is flat at ZERO. The 3C charts I told you about, very short term intraday positive as ig to save the market from falling are there, but the slightly longer, stronger are falling apart.

Leading Indicators show Credit was already dislocated, but on the market's afternoon bounce attempt, HYG and JUNK Credit went the EXACT OPPOSITE direction, down and I don't see anything in 3C that makes me think they'll try to use HYG to hold up the market, making me think they don't want to be caught when the music stops without a chair.

Sentiment indicators that were positive yesterday are at best in line, one is negative and specifically at the afternoon bounce attempt.

VIX futures were unremarkable yesterday, today they not only look like they are in a reversal process and pretty far along, but they are seeing a serious bid for protection that wasn't there yesterday. Commods wouldn't even follow the market this afternoon,

This is a strange market, it REALLY looks like they are doing the bare minimum to prop it close to VWAP where selling or short selling would take place.

I'm very anxious to get in to some positions, especially as the market looks like this, but most of us have some short exposure, I WOULD URGE PATIENCE, IT OFTEN PAYS OUT THE BIGGEST.

Lets see what this is and where the opportunities are.

Charts after the close.


Quick Market Update

I'll try to get some charts up because they are worth more than what I can say. Pretty much all of the averages are showing intraday positives, 1 min usually, but 3-5 min are deteriorating badly, it's almost as if they are trying to sell at VWAP and maintain price in a range.

I'm going to check Leading Indicators real quick and then put those charts up.

The 5 min Index futures have not improved  and the intraday are close to in line, so that's the feeling I get, maybe they try for an EOD ramp, but for now, I see very short term and weak positives and larger, longer term negatives.

PCLN

In Sunday's "The Week Ahead " post I was talking about the "mini cycle set up Friday and had mentioned PCLN which is a partial core short waiting to be filled out...

"However, as I said, "I don't believe Wall St. does anything without a reason and they saved this cycle when the NFP Friday morning threatened to send the market lower as the good employment report makes F_E_D tapering more likely, at least that's the market's (retail's) take. To me it seems setting up and seeing through this mini cycle through the NFP'd (Friday morning volatility) shows some commitment to the cycle, even though all indications are that it's a "Mini" cycle.

This is one of the reason I said on Friday that I like PCLN as a core short, but I wouldn't be interested to add to the position unless it made a move above $1100 and to do that, the market would have to make a head fake move above the range above, the more defined and obvious the range, the more likely it is to be hit and shaken out, there's too much money, too many orders, too many volume rebates to leave all that money on the table. However, that's just my speculation."


Yesterday I received an email from some members that are very experienced traders and had essentially told me (since I don't /won't watch CNBC), what Cramer was up to last night (what follows is my response in regular italics and today's chart comments in bold)...

Member:
" Jim Cramer went on for a 10 minute special how PCLN is actually the “least expensive” growth stock ... had a great quarterly report ... picked a great CEO ... and recommended people buy deep in the money calls “because the stock is expensive for some people”.


My Response:

"I suspected PCLN would do this, but it was more based on instinct or market behavior, that FLAG-LIKE AREA FROM AROUND 10/22 (60 MIN CHART) to about 11/6 was just too simple of a channel, too easy to head fake and run because traders were expecting that from what they view as a large flag.

Try to focus on the channel left of the orange line, this is what we were seeing at the time.

"The final straw for me was the break below the channel on 11/7, that's a channel buster and whenever you see them, they are bound to reverse the exact opposite way of the break or channel bust, in this case it was clearly below the defined channel "
We have an upside Channel Buster that quickly sends price through the bottom of the channel, then a strong reversal to the upside Monday, this is the Channel Buster and how they work.


"So what you said about the big run up on Monday, it was a direct result of the channel buster the day before.

This was more than likely set up in advance, it would take a week or so to accumulate even a small position like the move we are seeing now, you can see on the next chart where the two breaks were accumulated, but it's the channel breaks that create the momentum they need without them investing money to mark up the stock.
So is it probable that Goldman Sachs Alumni, Cramer was part of the catalyst to send PCLN higher off a momentum producing "Channel Buster" AFTER there had already been accumulation just before the move up? Well I can remind you of the week Cramer told his audience to buy USO on the next bad EIA report as a contrarian trade (how millions of viewers all doing the same thing is contrarian...?) this was the same week we called the top in oil around mid July 2008, after the Bush oil run from the mid-tenns to the mid $100's.

It's not a huge amount of accumulation so I don't think it was meant to last as long as what Cramer is trying to sell, but they don't need that and they know it likely wouldn't hold that long.

The "Cramer Effect", just everyone buying tomorrow is another free bit of momentum like the channel buster so you are probably correct that this is all connected.

I wouldn't short it immediately, although it will be interesting to see how much pump the Cramer effect still has after he spent so much time on it, remember that first and foremost Cramer is Goldman Sachs alumni and that's his most powerful card so his loyalties are first and forever with them, if CNBC lets him go, GS will always be there for him-look at the leaders of Greece, Italy, the ECB- ALL FORMER GS EMPLOYEES.

The distribution in PCLN makes sense that they'd try to push it higher, whether to get out of long exposure, to short or both, they need demand and that's what Cramer is giving them the night after PCLN already showed the sheep it can move (before Cramer mentioned them).
Daily

 4-Hour

60 min


"We'll see distribution start and know we need to start paying attention to an entry area.

 I'm really interested to see how much oomph the Cramer effect has left considering margin/leverage" levels."
_________________________________________________________________________________
And that's the end of the email response.

Surprisingly the Cramer Effect was or has been thus far, very mild. I don't watch Cramer, I don't know what he's pushing or pumping, I just know that the day after he pumps, especially that hard for that long, retail usually responds. I see about a 1/2% gain with a potentially bearish/reversal "Daily" candlestick set up.

As far as the head fake set up that I'd expect...
The red arrows show what some technical traders would take to be a bullish "Bull Flag", however in actuality it is too big or pretty darn close to too big. Traders would expect a bull flag to breakout to the upside above the flag which it did yesterday cleanly BEFORE Cramer started hyping PCLN. The Channel Buster in Yellow is on increased volume, that's part of the reason for this version of a head fake move and it's that little trap that is set that helps the upside reversal momentum.

It seems the Cramer effect has been quite muted, but I'd expect any head fake set up to target the area above the yellow trendline which is one of the reasons I said I wouldn't consider adding to PCLN unless it was above $1100.

As for what has happened today...

First I wouldn't expect that the accumulation cycle seen above on a 2 min chart could be distributed in the 2.5 days since there has been an opportunity, but it's also hard to know how much was actually accumulated and for what reason, (to buy shares and sell a few percent higher and perhaps short in the head fake range or maybe just to give PCLN enough support to break in to the head fake range to do nothing more than to sell short? It's difficult to say what the reasons are for what we see at the time).

 The 30 min chart has a cleaner trend, less detail, but cleaner and shows the same accumulation as the 2 min chart in to the first channel buster in yellow and the second in yellow at the lows. The 3C signal now is a slight relative negative as price is higher, 3C should be higher, but this is not a huge deal. I'd call this close to in line for this move.

The 10 min chart is nearly perfectly in line with the price move.

And intraday it looks like the 3 min chart is getting intraday support to perhaps try pushing it higher.

As I told our member who is really paying attention to this one, "I'd wait until distribution of the recent accumulation at the channel buster lows is VERY clear, PCLN is in the range, the area, it's probably not a huge deal if you entered here or at the exact area of a reversal, maybe a few percent, but it will be clear when distribution of that accumulated area is done. I'm guessing it would take several days, maybe a week to go through all of it, depending on price movement and of course volume.

I would have PCLN on the radar though. Remember AAPL had a similar type of divergence that I was trying to trade around and got caught without a seat when they all got run over.

The daily chart is what is ugliest about this right now.
First we are above the resistance range, buyers are not stepping in aggressively and that's the point of a head fake above an obvious range. Yesterday's closing candle has a long upper wick showing higher prices were rejected and there may have been some churning up there. Today's candle, even with the Cramer Effect has a VERY small body, if it were a bit higher it would be a bearish reversal pattern called a "Hanging Man".

I'd keep this on the radar, 3C or not just because of the AAPL effect. I'll set price alerts.